
Top Crypto Gainers: BCH, ALGO, XMR – Made in USA and privacy coins lead the smoldering market recovery
- Bitcoin Cash extends its recovery to hit a record high in 2025, suggesting a potential breakout rally.
- Algorand edges higher as the recent V-shaped reversal picks up bullish momentum.
- Monero’s falling wedge breakout rally gains traction, nearing a critical local resistance level.
Made in USA altcoins, such as Bitcoin Cash (BCH) and Algorand (ALGO), have made significant gains on Monday, outpacing the broader market over the last 24 hours. Similarly, Monero (XMR), a privacy coin, maintains bullish momentum following last week’s recovery run, with further gains on the horizon.
Bitcoin Cash nears key resistance trendline breakout
Bitcoin Cash, a “Made in the US” Bitcoin hard fork, edges higher by over 2% at press time on Tuesday following a silent opening this week. BCH crosses above the $500 psychological level, reaching a new year-to-date high.
The uptrend challenges the $523 mark, which aligns with the 78.6% Fibonacci level drawn between the 52-week high of $640 and the low of $249. Further up, an overhead resistance trendline connected by swing highs on May 8 and June 19 coincides with the 78.6% Fibonacci level.
A potential daily close above the adjoining resistances could prolong the uptrend towards the 52-week high of $640.
The Moving Average Convergence/Divergence (MACD) indicator displays a wave of bullish histogram bars suggesting the altcoin is sustaining bullish momentum.
The Relative Strength Index (RSI) at 67 hovers below the overbought boundary, indicating heightened buying pressure.
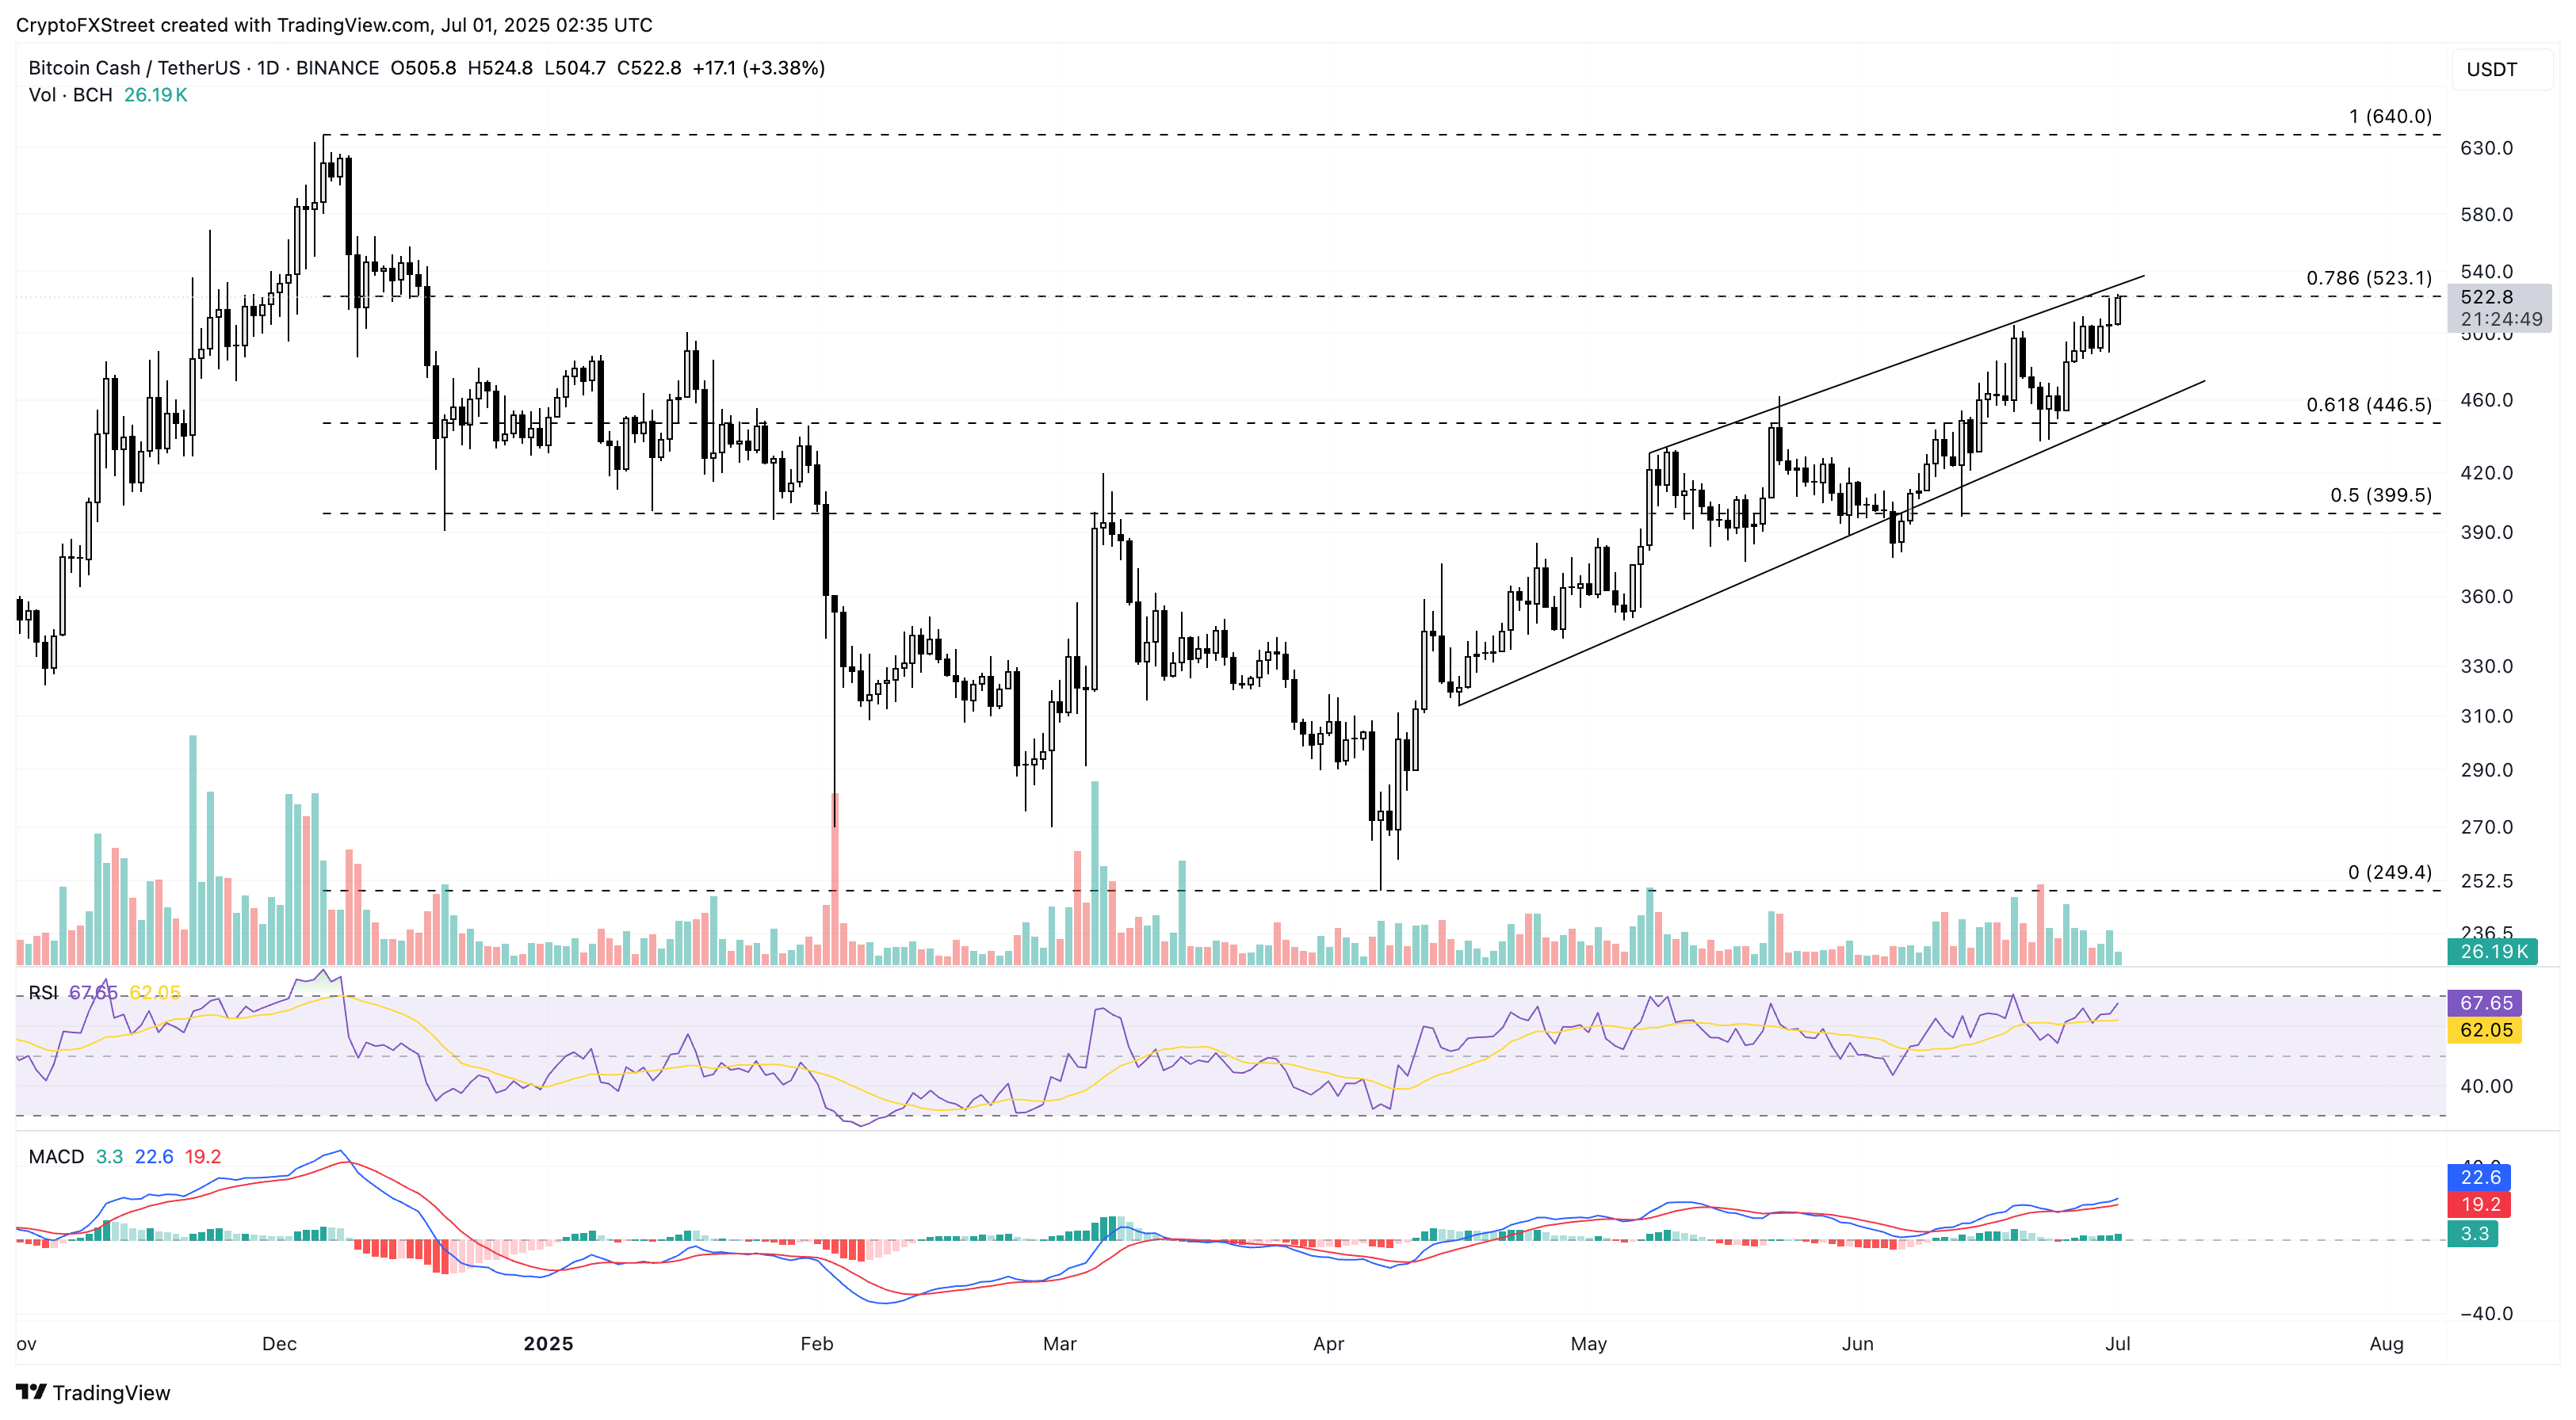
BCH/USDT daily price chart.
If BCH reverses from the resistance level, it could decline towards $446, aligning with the 61.8% Fibonacci level.
Algorand’s recovery targets $0.20
Algorand trades in the green as it extends its 15% recovery run from last week. At the time of writing, ALGO is trading 3% higher on the day, surpassing the $0.1909 resistance level, last tested on June 9.
If ALGO holds a daily close above this level, it could extend the uptrend towards the highest price in June of $0.2092.
The MACD indicator displays a rising trend in green histogram bars, indicating a strengthening of trend momentum.
The RSI crosses above the midpoint level to 56, indicating a potential increase in buying pressure.
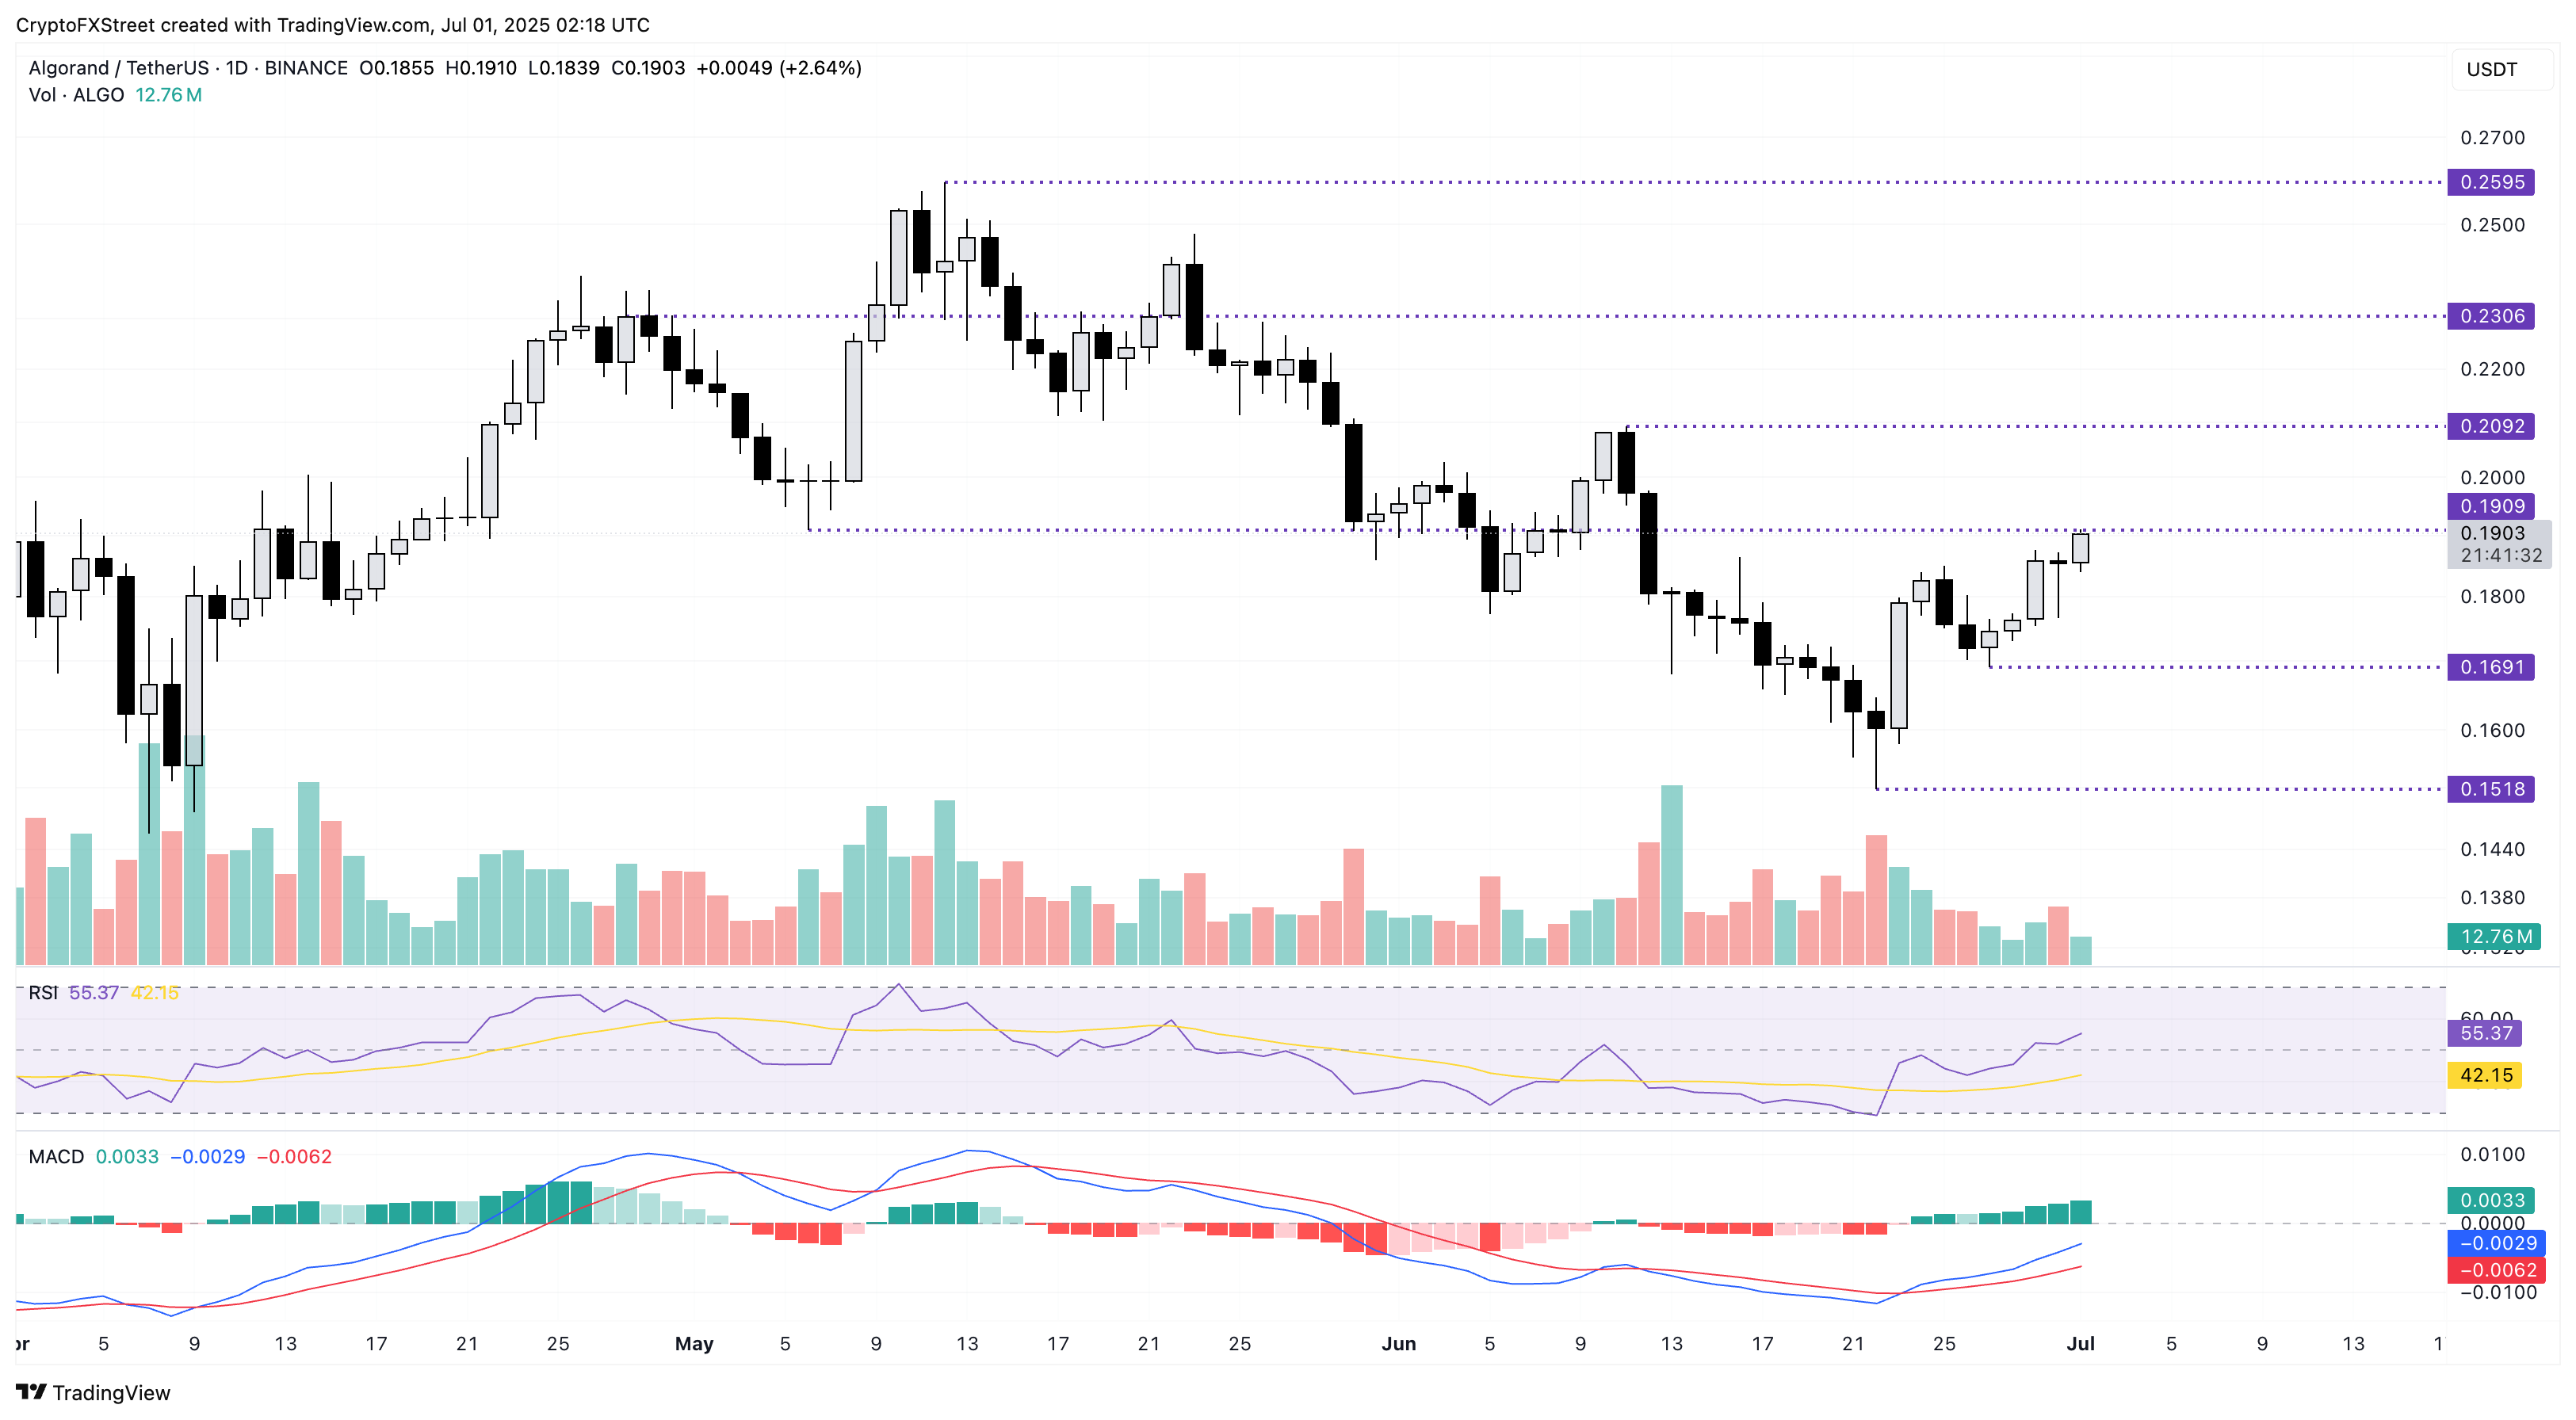
ALGO/USDT daily price chart.
However, a bearish close to the day could test Friday’s low at $0.1691.
Monero aims to surpass the $322 resistance level
Monero softens by 1% on Tuesday, following a 3.80% rise on Monday, as it struggles to hold its gains. The recovery run in XMR, marked by a falling wedge pattern breakout, is shown in the daily chart below.
However, the breakout rally faces opposition from the area below the $322 resistance level, last tested on June 18. A clean push above $322 could extend XMR’s price to its June high of $372.
The MACD indicator triggered a buy signal on Sunday, as the MACD line crossed above its signal line.
The RSI indicator crossing above the halfway line suggests a minor bullish tilt in trend momentum.
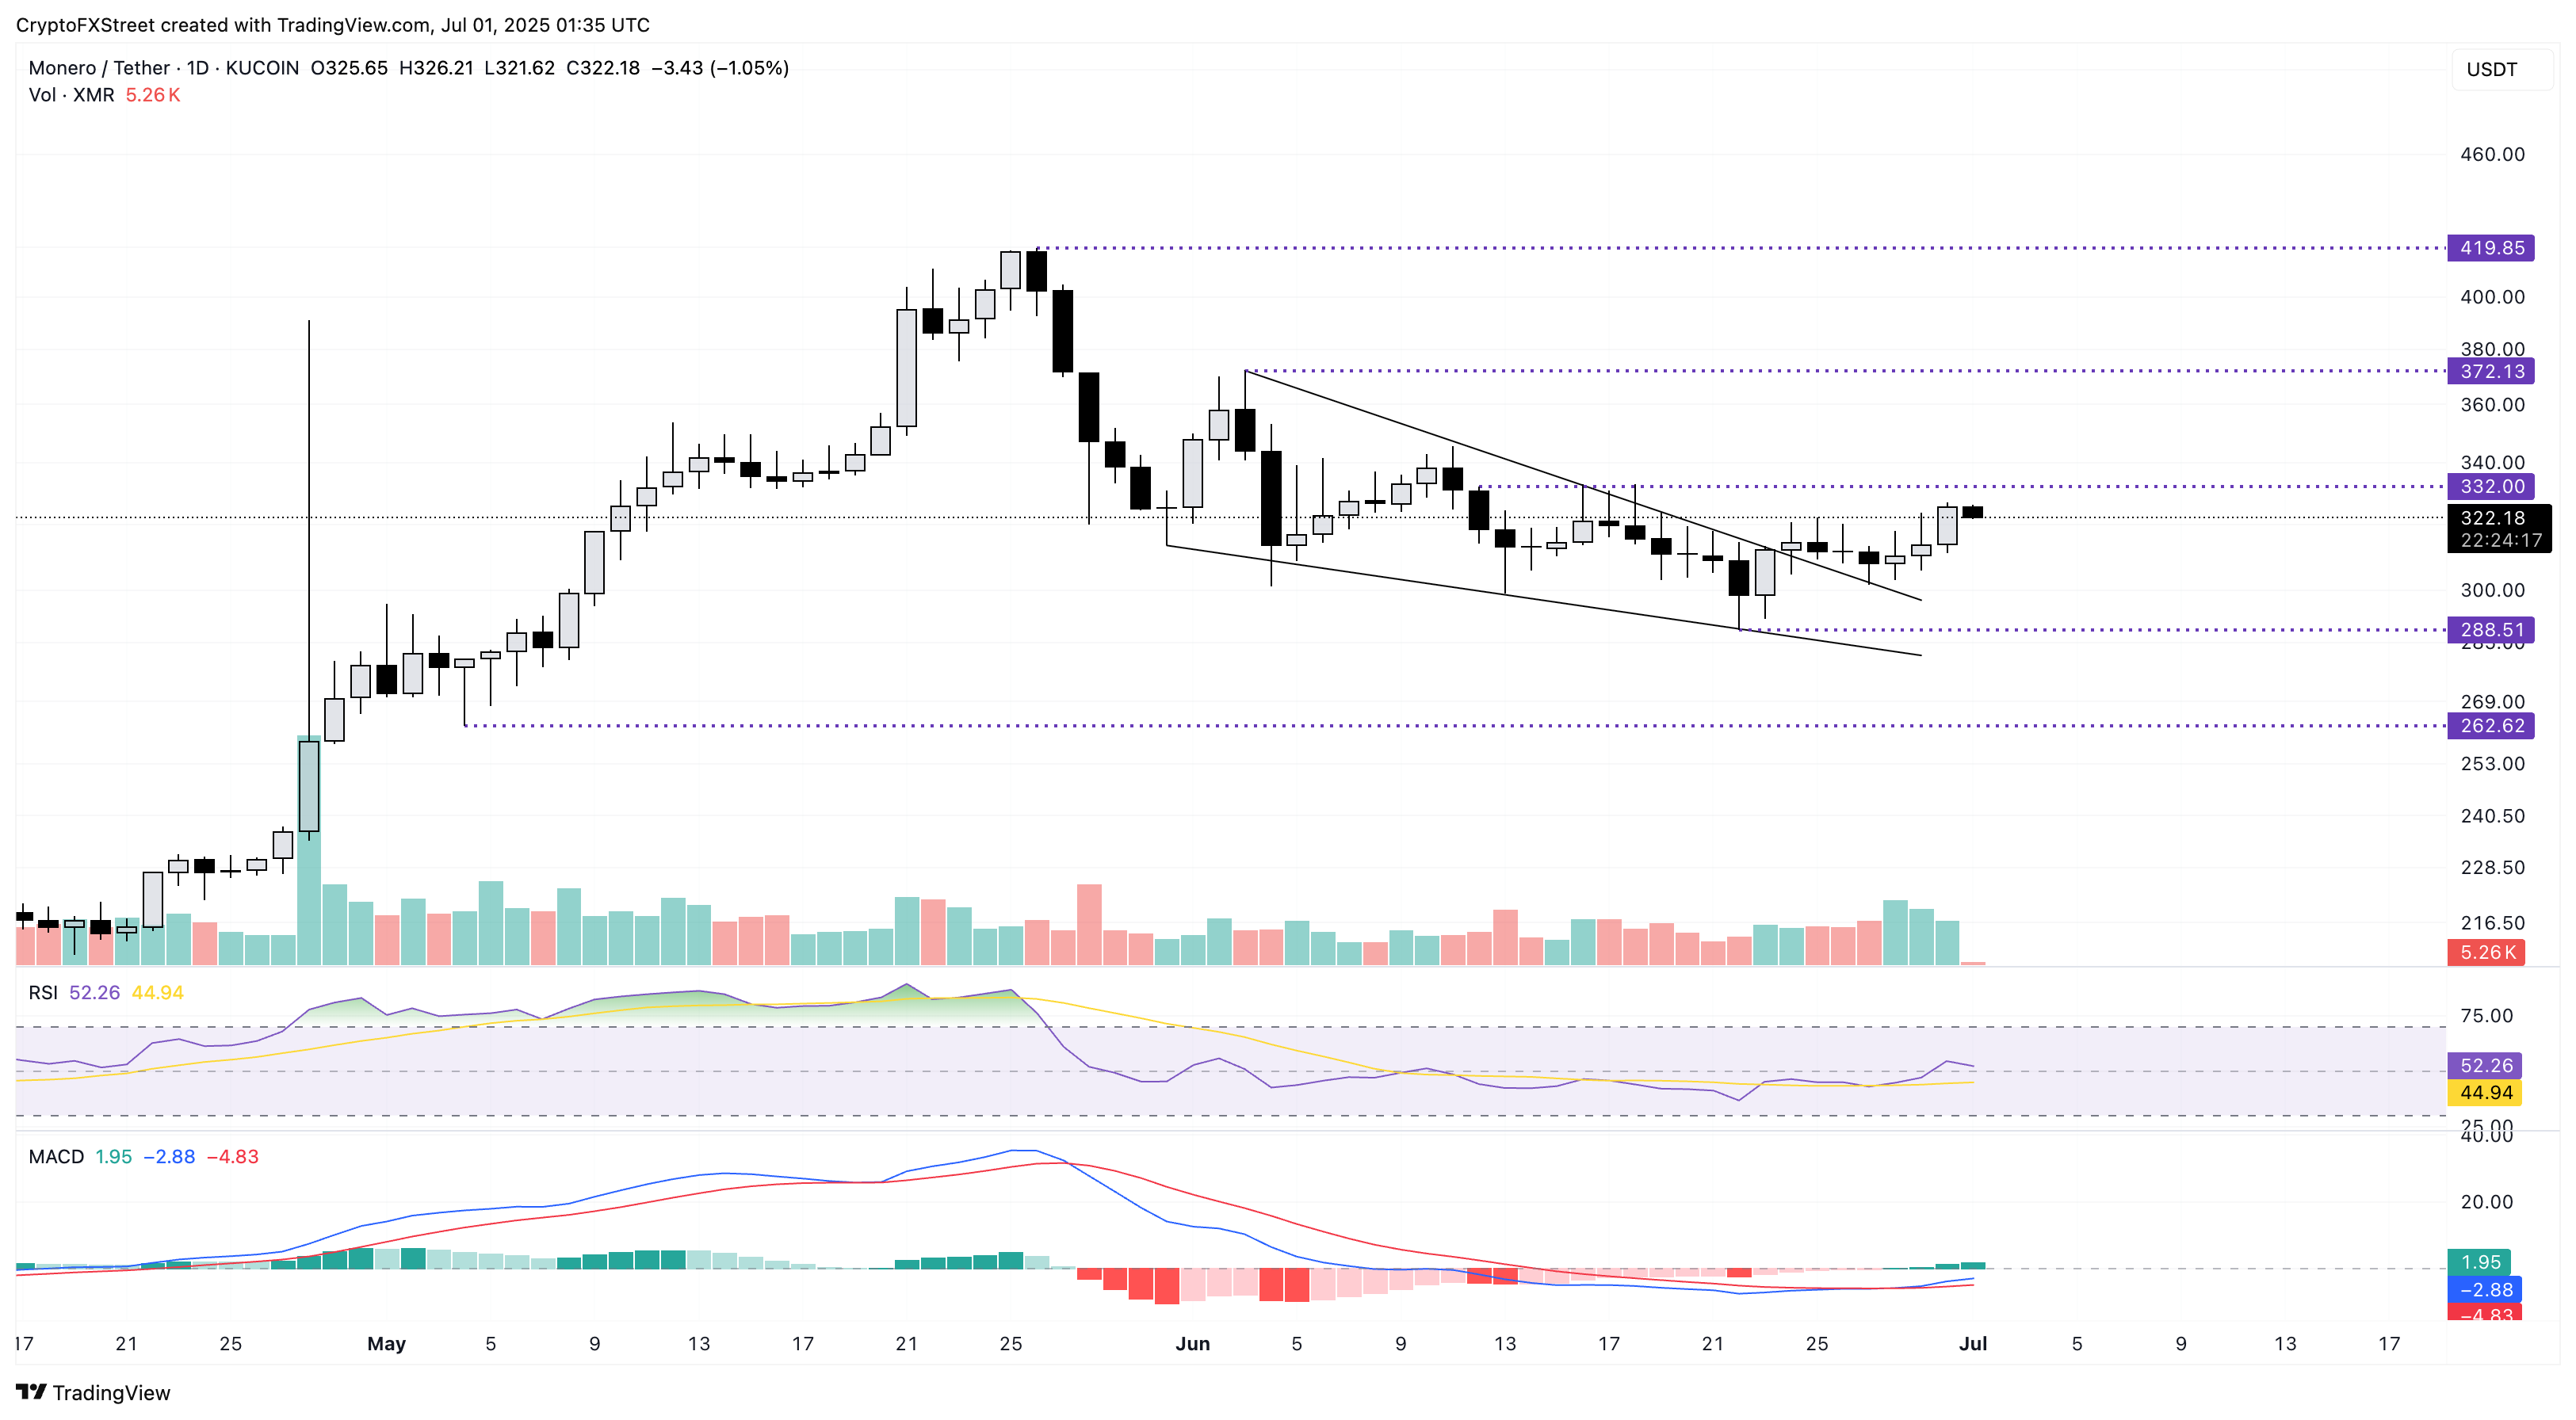
XMR/USDT daily price chart.
However, a reversal from the high supply zone could test the June 22 low at $288.
บทความแนะนำ


