
Ripple Price Forecast: Signs of bearish reversal emerge as XRP Ledger’s active addresses plunge
- XRP recovery loses momentum under the $2.24 supply zone, reflecting aggressive downside risks and geopolitical uncertainty.
- The XRP Ledger network activity suffers a significant decline as active addresses drop sharply to 100,000.
- XRP futures Open Interest rises slightly to $4 billion but remains in an overall downtrend from the mid-May peak of $5.52 billion.
Ripple (XRP) remains highly vulnerable to downside risks as the broader cryptocurrency market consolidates while on the edge amid geopolitical tensions in the Middle East. Meanwhile, the price of XRP hovers at around $2.20, down nearly 1.5% at the time of writing on Tuesday.
The downturn from XRP’s recent peak of $2.34 coincides with a sharp decline in the network’s activity, particularly in the number of active addresses, which plummeted 84% to 100,000 in under three days.
XRP shows resilience amid slump in network activity
The downside risks preventing the XRP price from extending the uptrend remain largely limited between the key support level around $2.09 and the resistance at $2.34. In addition to the geopolitical tensions between Israel and Iran, which are marked by a delicate conflict, the lethargic price action can be attributed to declining network activity on the XRP Ledger (XRPL).
Santiment shows that after active addresses monitored on a 24-hour basis exploded on Saturday, reaching 609,000, a sharp drop followed, resulting in an 84% decline to 100,000 as observed on Tuesday.
 [15-1750169823466.07.05, 17 Jun, 2025].png)
XRP Ledger Active Addresses metric | Source: Santiment
Network activity metrics track the performance of the XRP Ledger in terms of active addresses interacting with the protocol, either by sending or receiving XRP. The sharp slump witnessed over the last three days indicates a decline in interest in the cross-border money transfer token, effectively reducing demand.
If the downtrend sustains, reflecting the minimal activity experienced between early April and June, it could be challenging for the price of XRP to stabilize the uptrend and aim for highs beyond $3.00.
Key fundamental indicators, such as the futures market Open Interest (OI), support the lack of conviction and interest in XRP. CoinGlass highlights a minor uptick in the OI to $4 billion, as illustrated in the chart below. However, the overall trend has remained downward since the surge to $5.52 billion around mid-May.
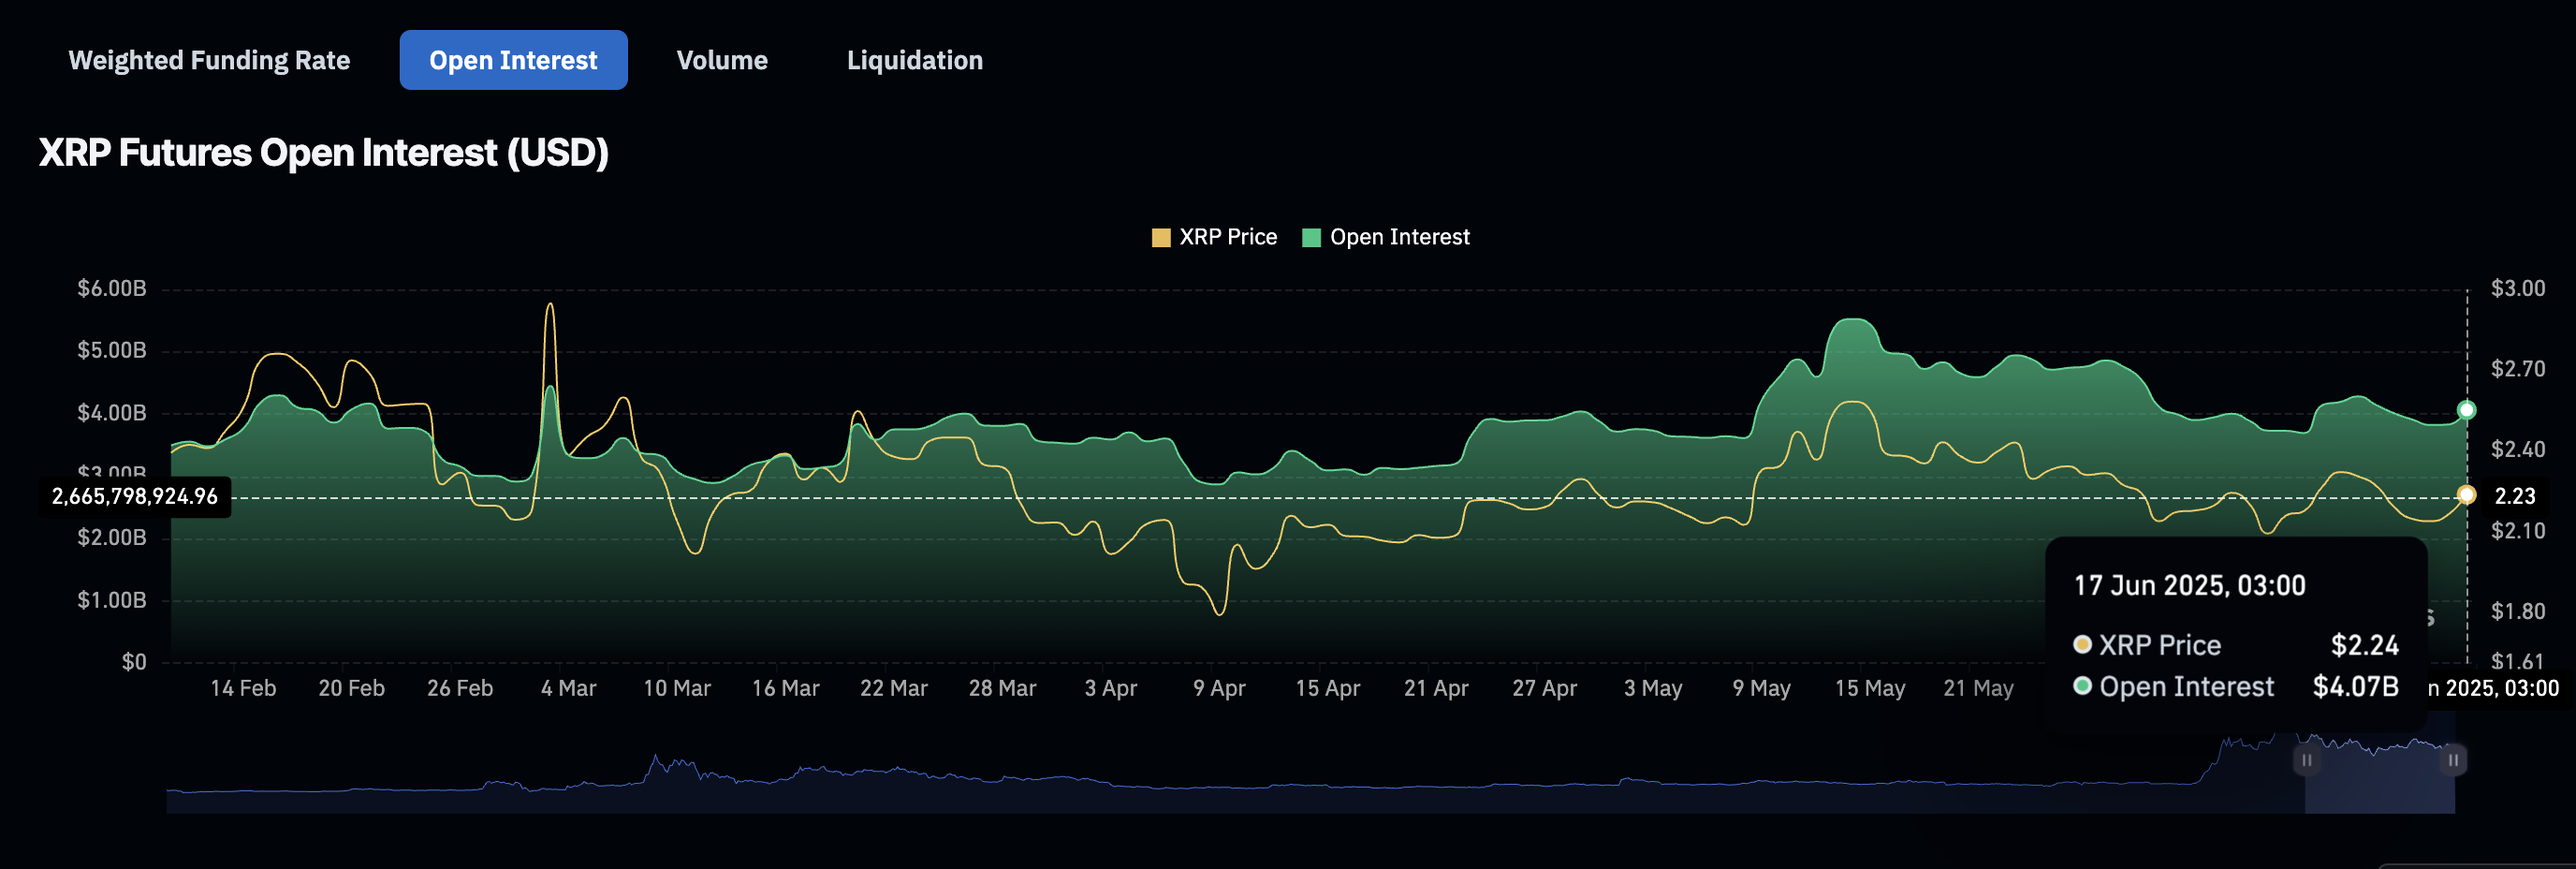
XRP futures OI | Source: CoinGlass
The persistent downtrend in OI, which refers to the value of active futures and options contracts that have yet to be settled or closed, coincides with a bearish bias, underpinned by long position liquidations of $4.21 million compared to shorts at $739,000 over the last 24 hours.
Meanwhile, the subsequent increase in derivatives market trading volume by over 200% to $9.8 billion points to an increase in demand for XRP as traders cover their positions amid growing uncertainty due to geopolitical tensions in the Middle East.
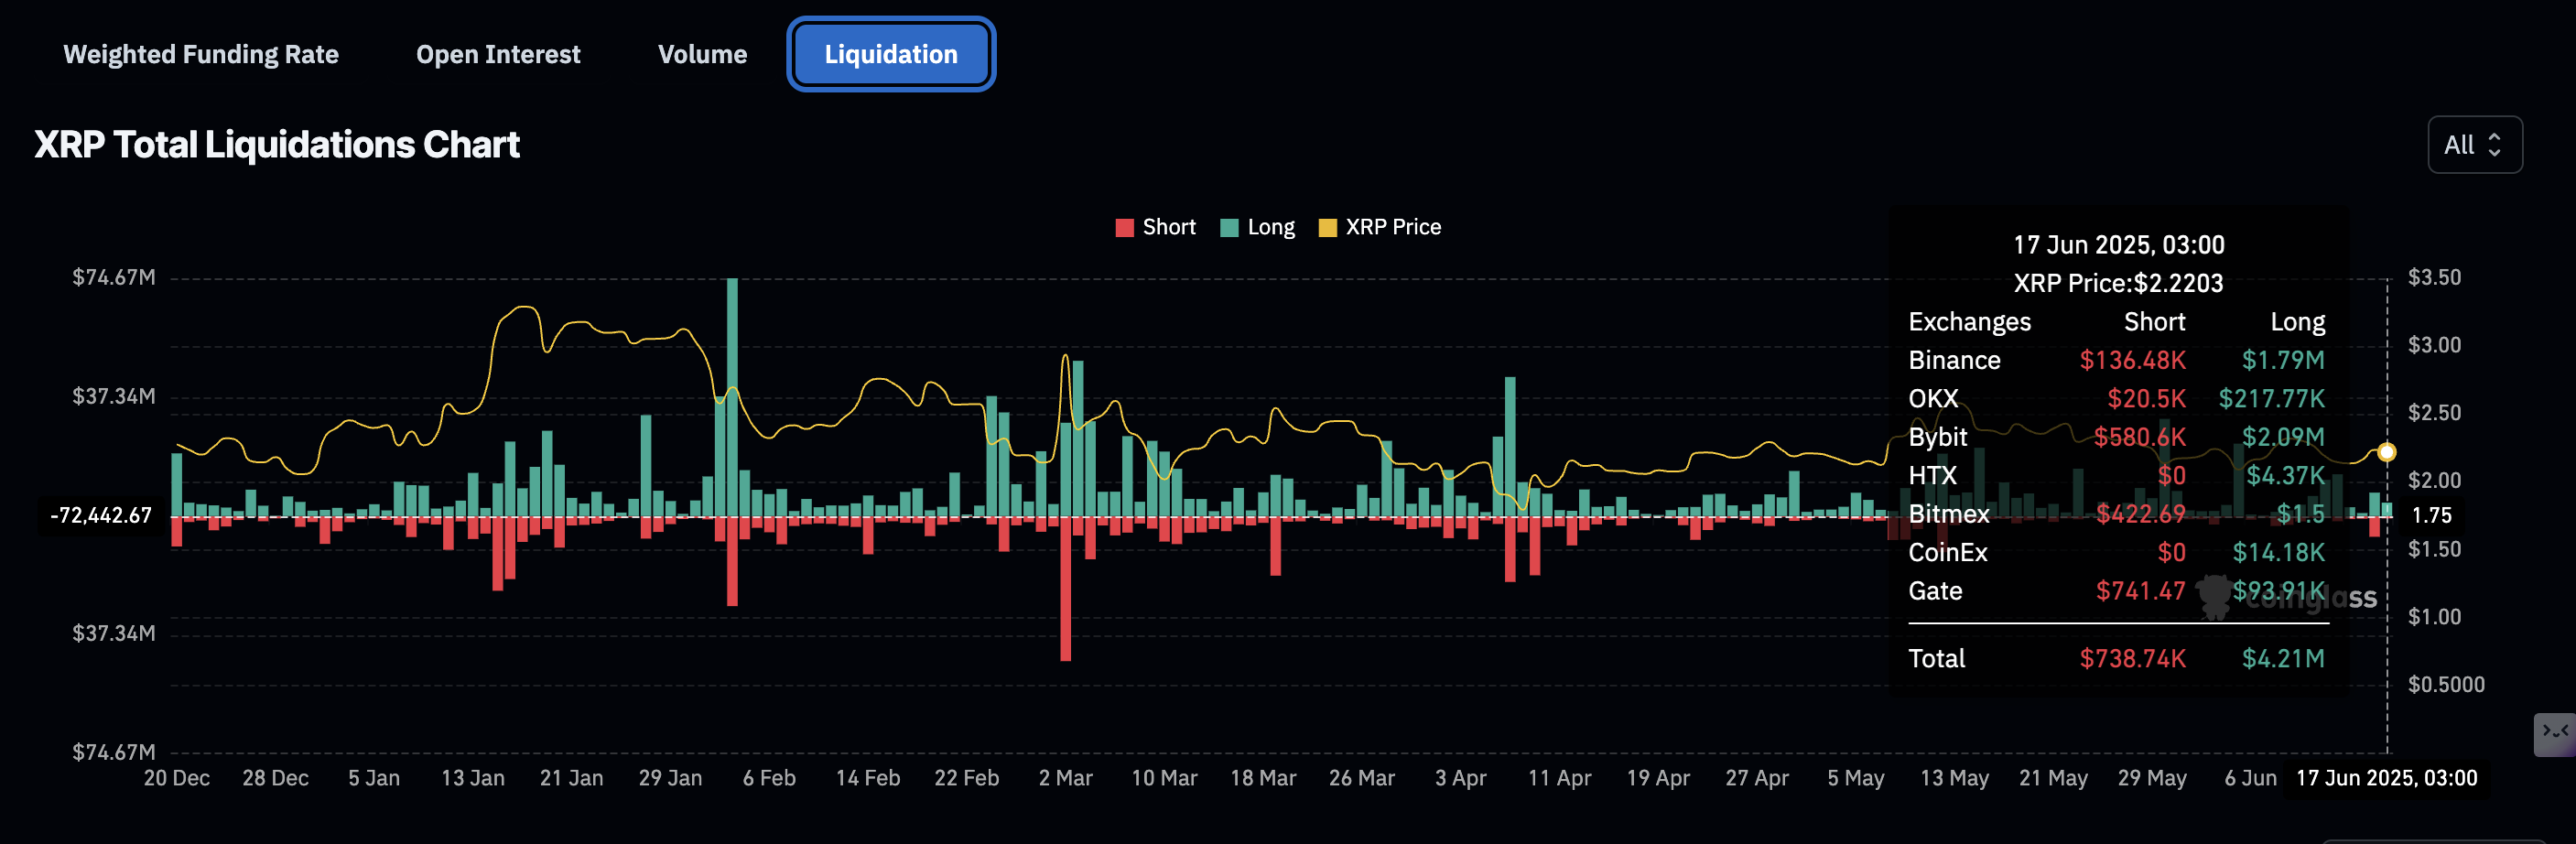
XRP futures liquidation chart | Source: CoinGlass
Similarly, price action is expected to remain relatively muted ahead of the Federal Reserve (Fed) meeting on Wednesday. The event “stands as this week’s focal macro event, with traders watching closely for the updated dot plot for clues on rate trajectories,” a K33 Research report states.
“While recent inflation data and geopolitical strife may encourage a dovish Fed outlook, potential fiscal expansion through a multi-trillion-dollar budget bill could nudge policymakers toward a more hawkish stance,” the report projects.
Technical outlook: XRP trending downward
XRP’s price generally slides within a descending channel, extending the decline from May’s peak of $2.65. An attempt to break free of the upper trendline resistance on Monday failed, highlighting the supply-rich confluence resistance at around $2.24. The 50-day Exponential Moving Average (EMA) and the 100-day EMA converge at this level, marking a robust hurdle.
A breach of this resistance could shift market dynamics for XRP, paving the way for a swing high targeting $2.65 and $3.00 levels.
The Relative Strength Index (RSI) continues to uphold bearish momentum, as it has been sloping downward below a descending trendline since mid-May. Bears could tighten their grip on XRP if the RSI extends toward the oversold region.
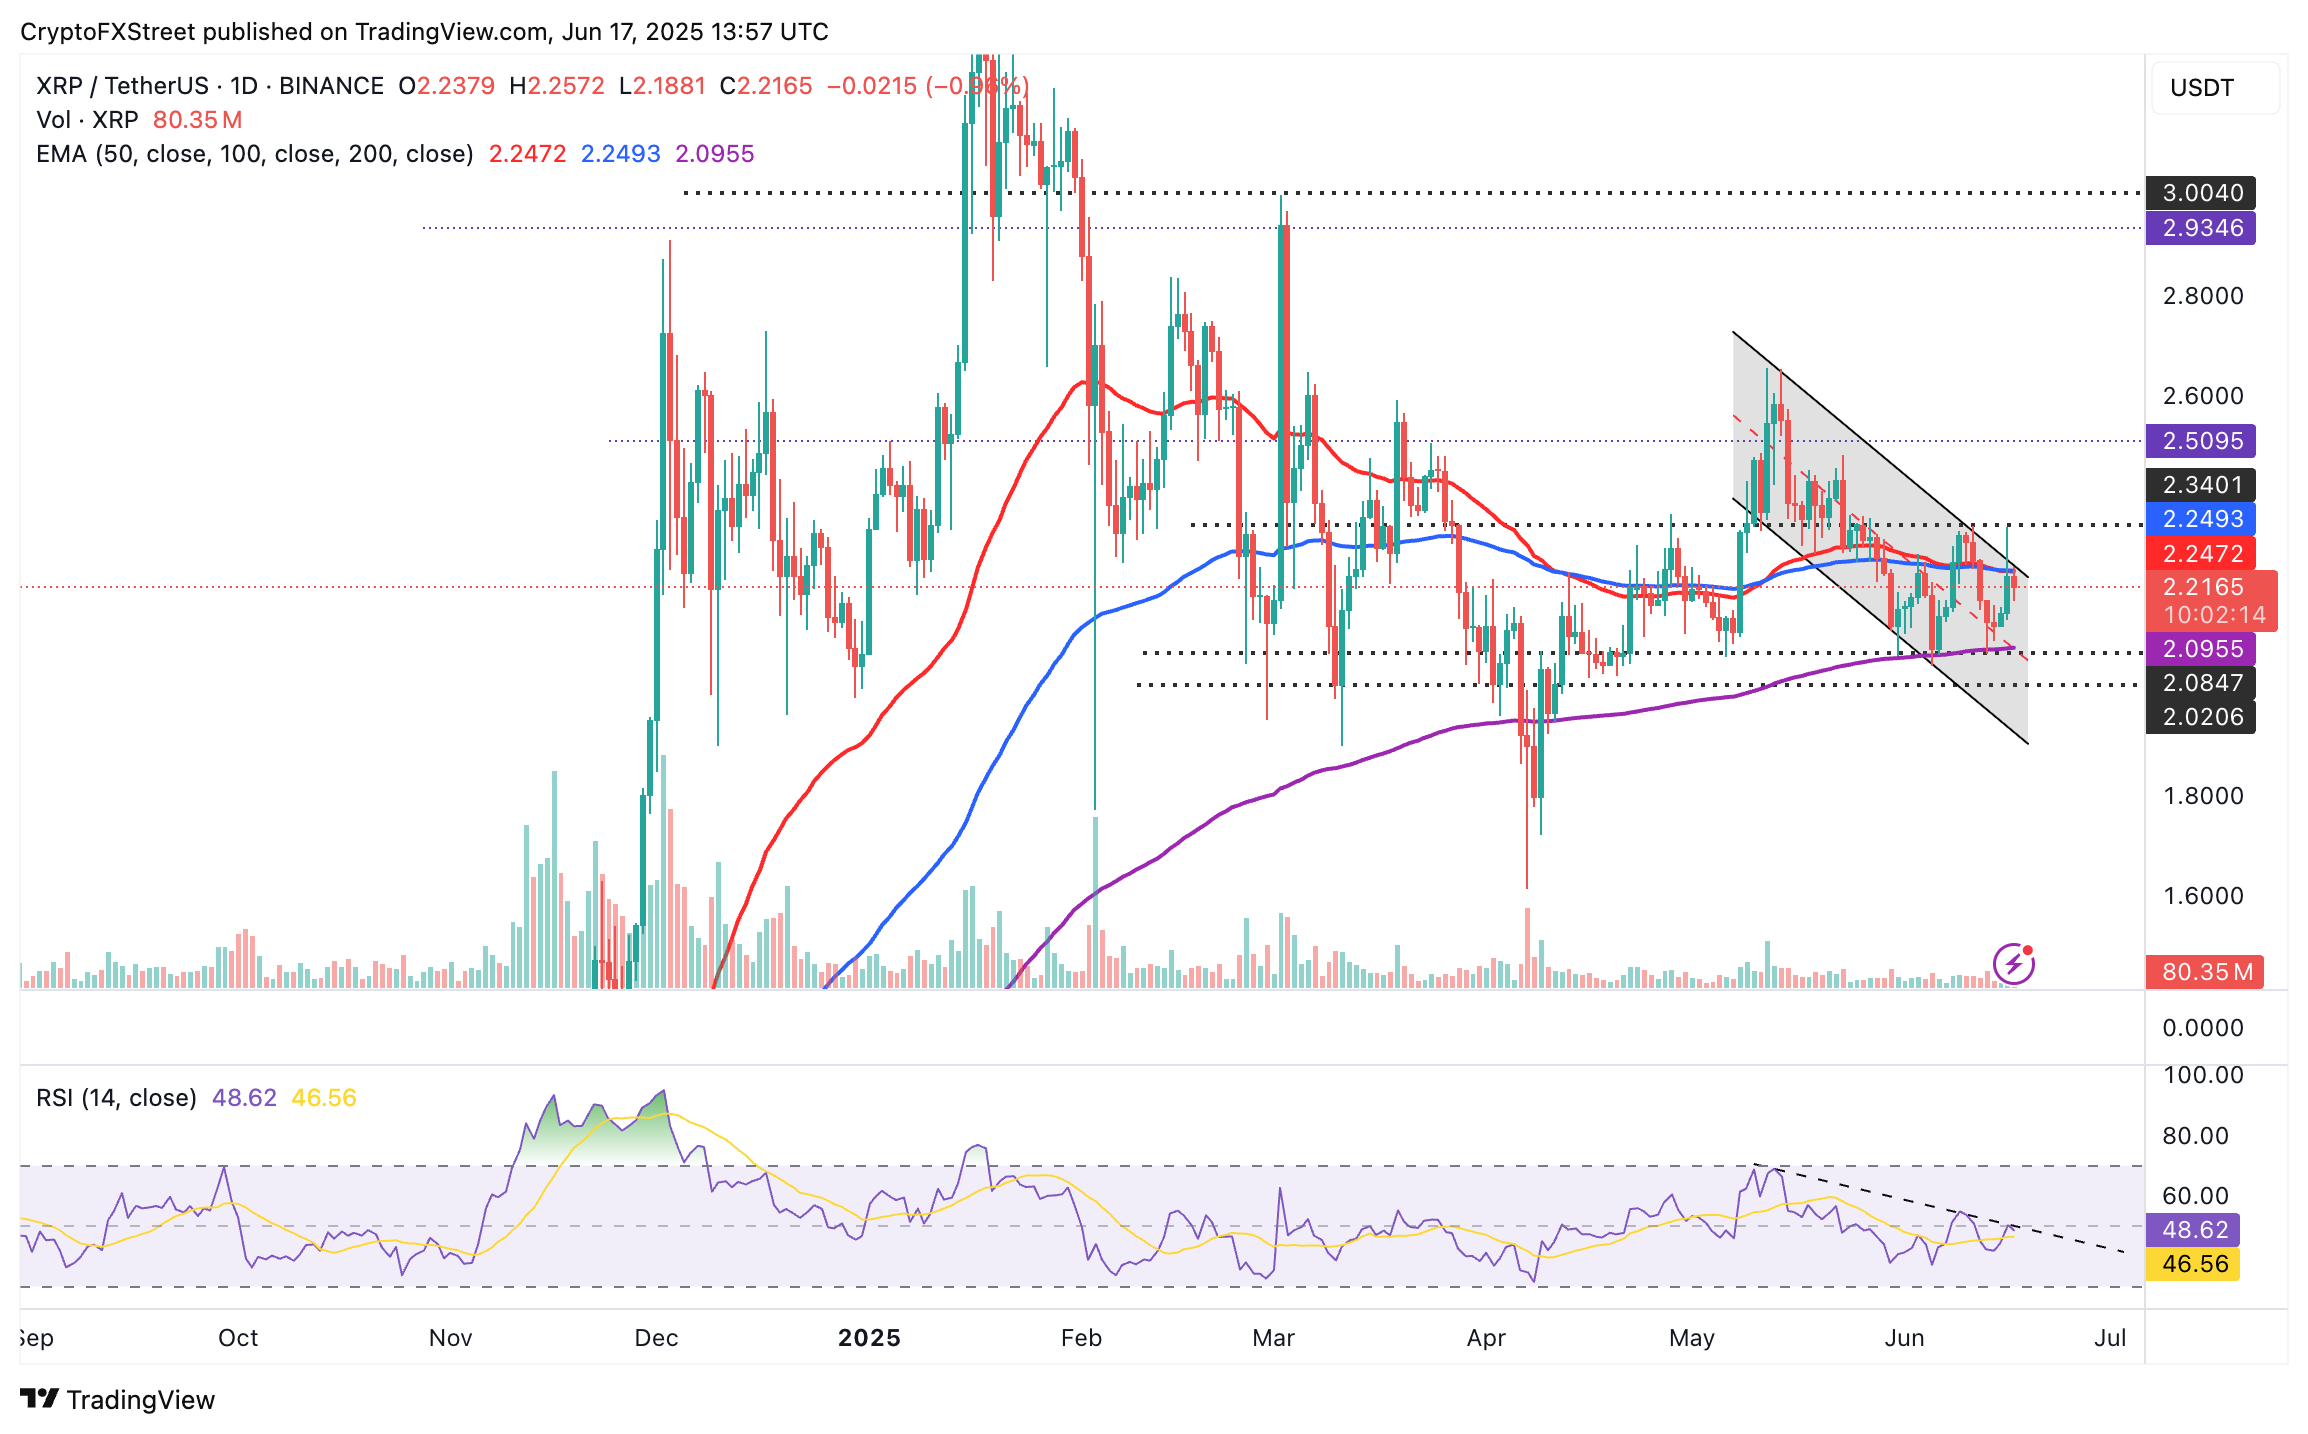
XRP/USDT daily chart
Key areas of interest include the 200-day EMA support at $2.09, which was tested on Friday, and the area around $2.00. Below these two levels, further losses could bring the April low of $1.61 reached during the tariff-triggered sell-off into sight.
Ripple FAQs
Ripple is a payments company that specializes in cross-border remittance. The company does this by leveraging blockchain technology. RippleNet is a network used for payments transfer created by Ripple Labs Inc. and is open to financial institutions worldwide. The company also leverages the XRP token.
XRP is the native token of the decentralized blockchain XRPLedger. The token is used by Ripple Labs to facilitate transactions on the XRPLedger, helping financial institutions transfer value in a borderless manner. XRP therefore facilitates trustless and instant payments on the XRPLedger chain, helping financial firms save on the cost of transacting worldwide.
XRPLedger is based on a distributed ledger technology and the blockchain using XRP to power transactions. The ledger is different from other blockchains as it has a built-in inflammatory protocol that helps fight spam and distributed denial-of-service (DDOS) attacks. The XRPL is maintained by a peer-to-peer network known as the global XRP Ledger community.
XRP uses the interledger standard. This is a blockchain protocol that aids payments across different networks. For instance, XRP’s blockchain can connect the ledgers of two or more banks. This effectively removes intermediaries and the need for centralization in the system. XRP acts as the native token of the XRPLedger blockchain engineered by Jed McCaleb, Arthur Britto and David Schwartz.
บทความแนะนำ


