
Top 3 Crypto Price Predictions: Bitcoin, Ethereum, Ripple - Bulls catch the dip in BTC, ETH, and XRP
- Bitcoin recovers over 1% on Friday, holding above the 50-day EMA and limiting any losses below $100,000.
- Ethereum price range breakdown fractures the 200-day EMA, with an over 1% intraday recovery on Friday retesting the dynamic support.
- Ripple’s XRP holds above the 200-day EMA with an intraday growth signaling a resurgence in bullish momentum.
The cryptocurrency market experienced a sudden crash on Thursday after Circle, the issuer of USDC stablecoin, went public on the New York Stock Exchange (NYSE). Bitcoin (BTC) dropped to $100,000 levels with a 3% pullback, while Ethereum (ETH) recorded a nearly 8% decline, and Ripple’s XRP saw an almost 5% drop.
The shakeout resulted in nearly $1 billion worth of liquidations in the crypto market, with buyers incurring $888 million in losses, compared to $99 million in short liquidations. At the time of writing, BTC, ETH, and XRP are recovering, with over a 1% jump on Friday, indicating a bullish breather may be at hand.
Bitcoin recovery resurfaces above the lost $102k zone
Bitcoin’s recovery is approaching 1.50% at press time on Friday, shrugging off the sudden 3% drop last night. As a bullish candle springs above the 50-day Exponential Moving Average (EMA) at $100,908, Bitcoin resurfaces above the $102,500 zone, which acted as a crucial support zone in May.
The persistent bullish failures to sustain an uptrend above $102,500 formed a head and shoulders pattern on the daily chart shared below. Bitcoin’s recovery on the day aims to invalidate the pattern if BTC closes above the zone.
However, the momentum indicators signal downside risk as the Moving Average Convergence/Divergence (MACD) shows a bearish trend with the average lines approaching the centre line. In addition, the RSI at 46 spikes towards the halfway line after the recent drop, signaling an overall decline in bullish momentum.
If Bitcoin's closing price holds above the $103,000 mark, it will mark a bear trap, resulting in a surge towards the all-time high at $111,980.
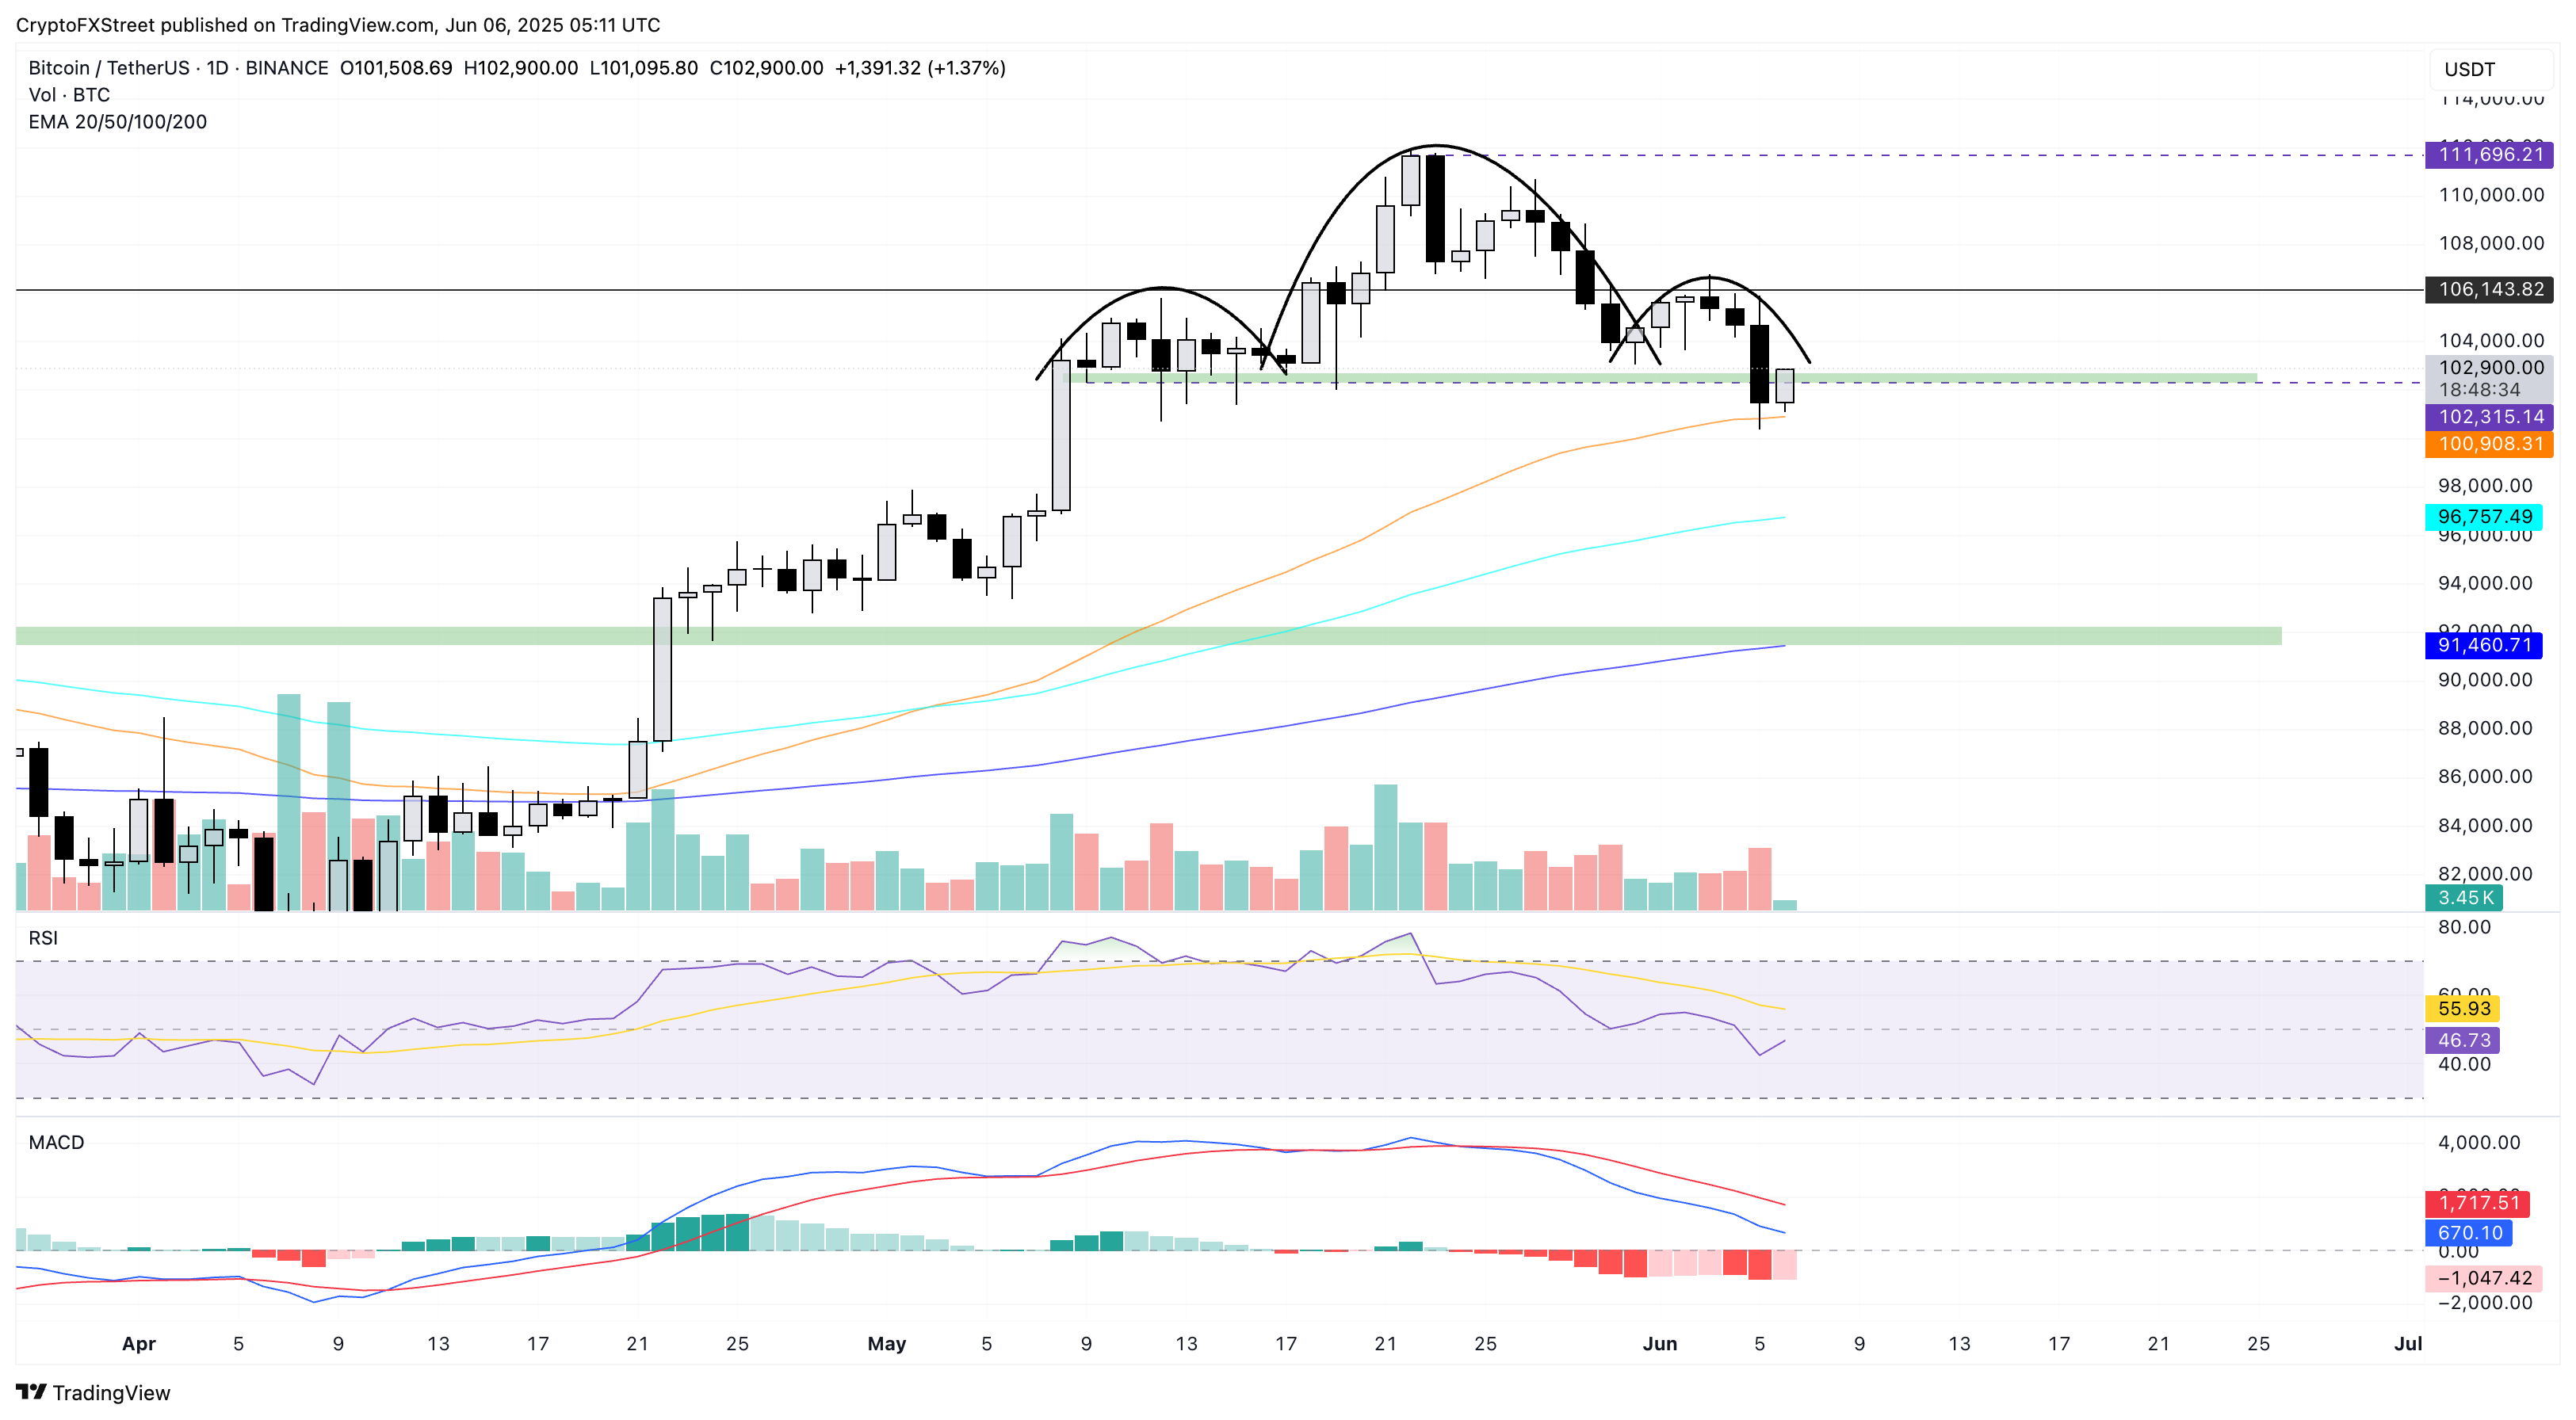
BTC/USDT daily price chart. Source: Tradingview
Conversely, sideline traders looking for a sell signal could find the 50-day EMA breakdown to be an entry spot. The next key support level is at the 100-day EMA at $96,757.
Ethereum range meltdown breaks below $2,500
Ethereum is up nearly 1.50% in the day at press time, after a decline of over 7% on Thursday, breaking below the 200-day EMA at $2,460, which had acted as the lower boundary of a consolidation range.
ETH’s intraday growth on Friday creates a bullish candle and attempts to reclaim the dynamic support to nullify the breakdown, as previously seen on May 18 and May 19. However, the previous closing prices were bound within the price range, marking this potential attempt as a bear trap.
Similar to Bitcoin, the momentum indicators project increased downside risk as the MACD and its signal line remain in a freefall, while the RSI at 48 prolongs the declining trend below the halfway line.
If Ethereum bounces above the 200-day EMA at $2,460, it could rise towards the range’s upper ceiling near $2,700.
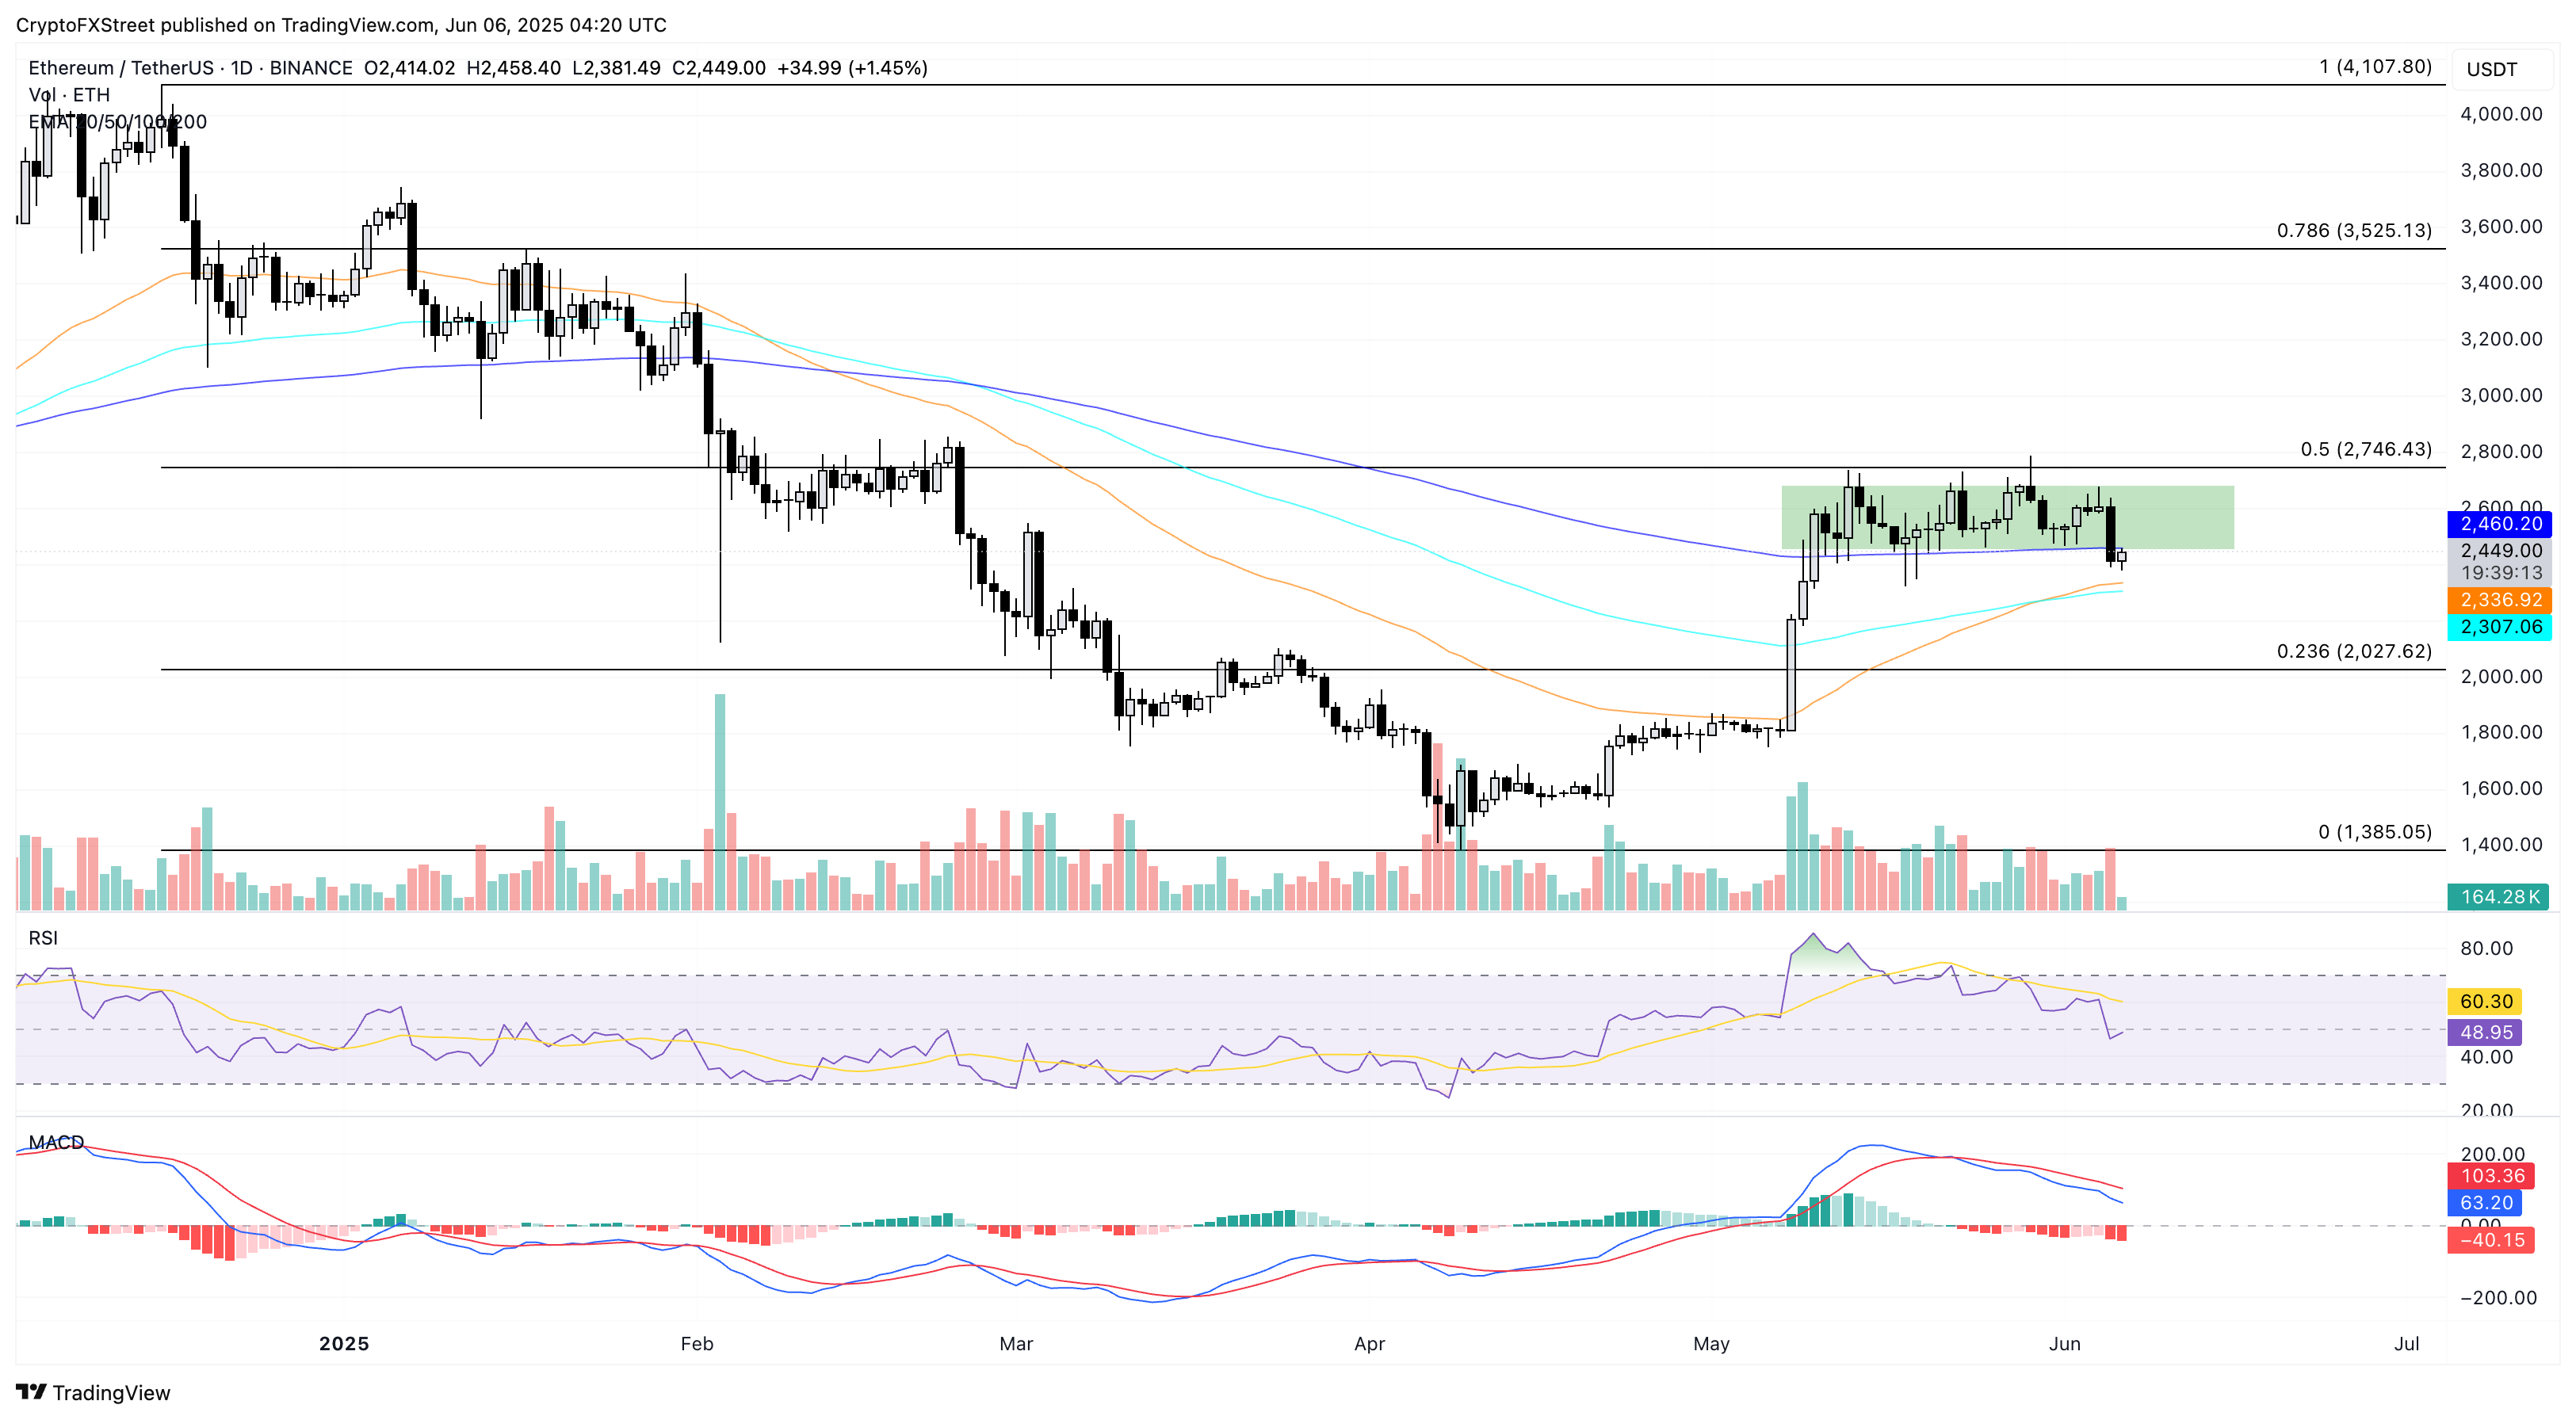
ETH/USDT daily price chart. Source: Tradingview
However, a closing below the 100-day EMA at $2,307 could extend ETH’s losses towards $2,000.
XRP’s recovery holds above the 200-day EMA
Ripple’s XRP token shows a similar recovery on Friday as Bitcoin and Ethereum in attempts to shrug off last night’s drop. Holding above the 200-day EMA near the $2 psychological support, XRP eyes to reclaim the lost $2.13 level.
The momentum indicators in XRP mirror those of Bitcoin and Ethereum, signaling a loss of bullish momentum as the gains made earlier this week deplete.
A daily close above $2.13 could test the converging 50-day and 100-day EMAs near $2.25.
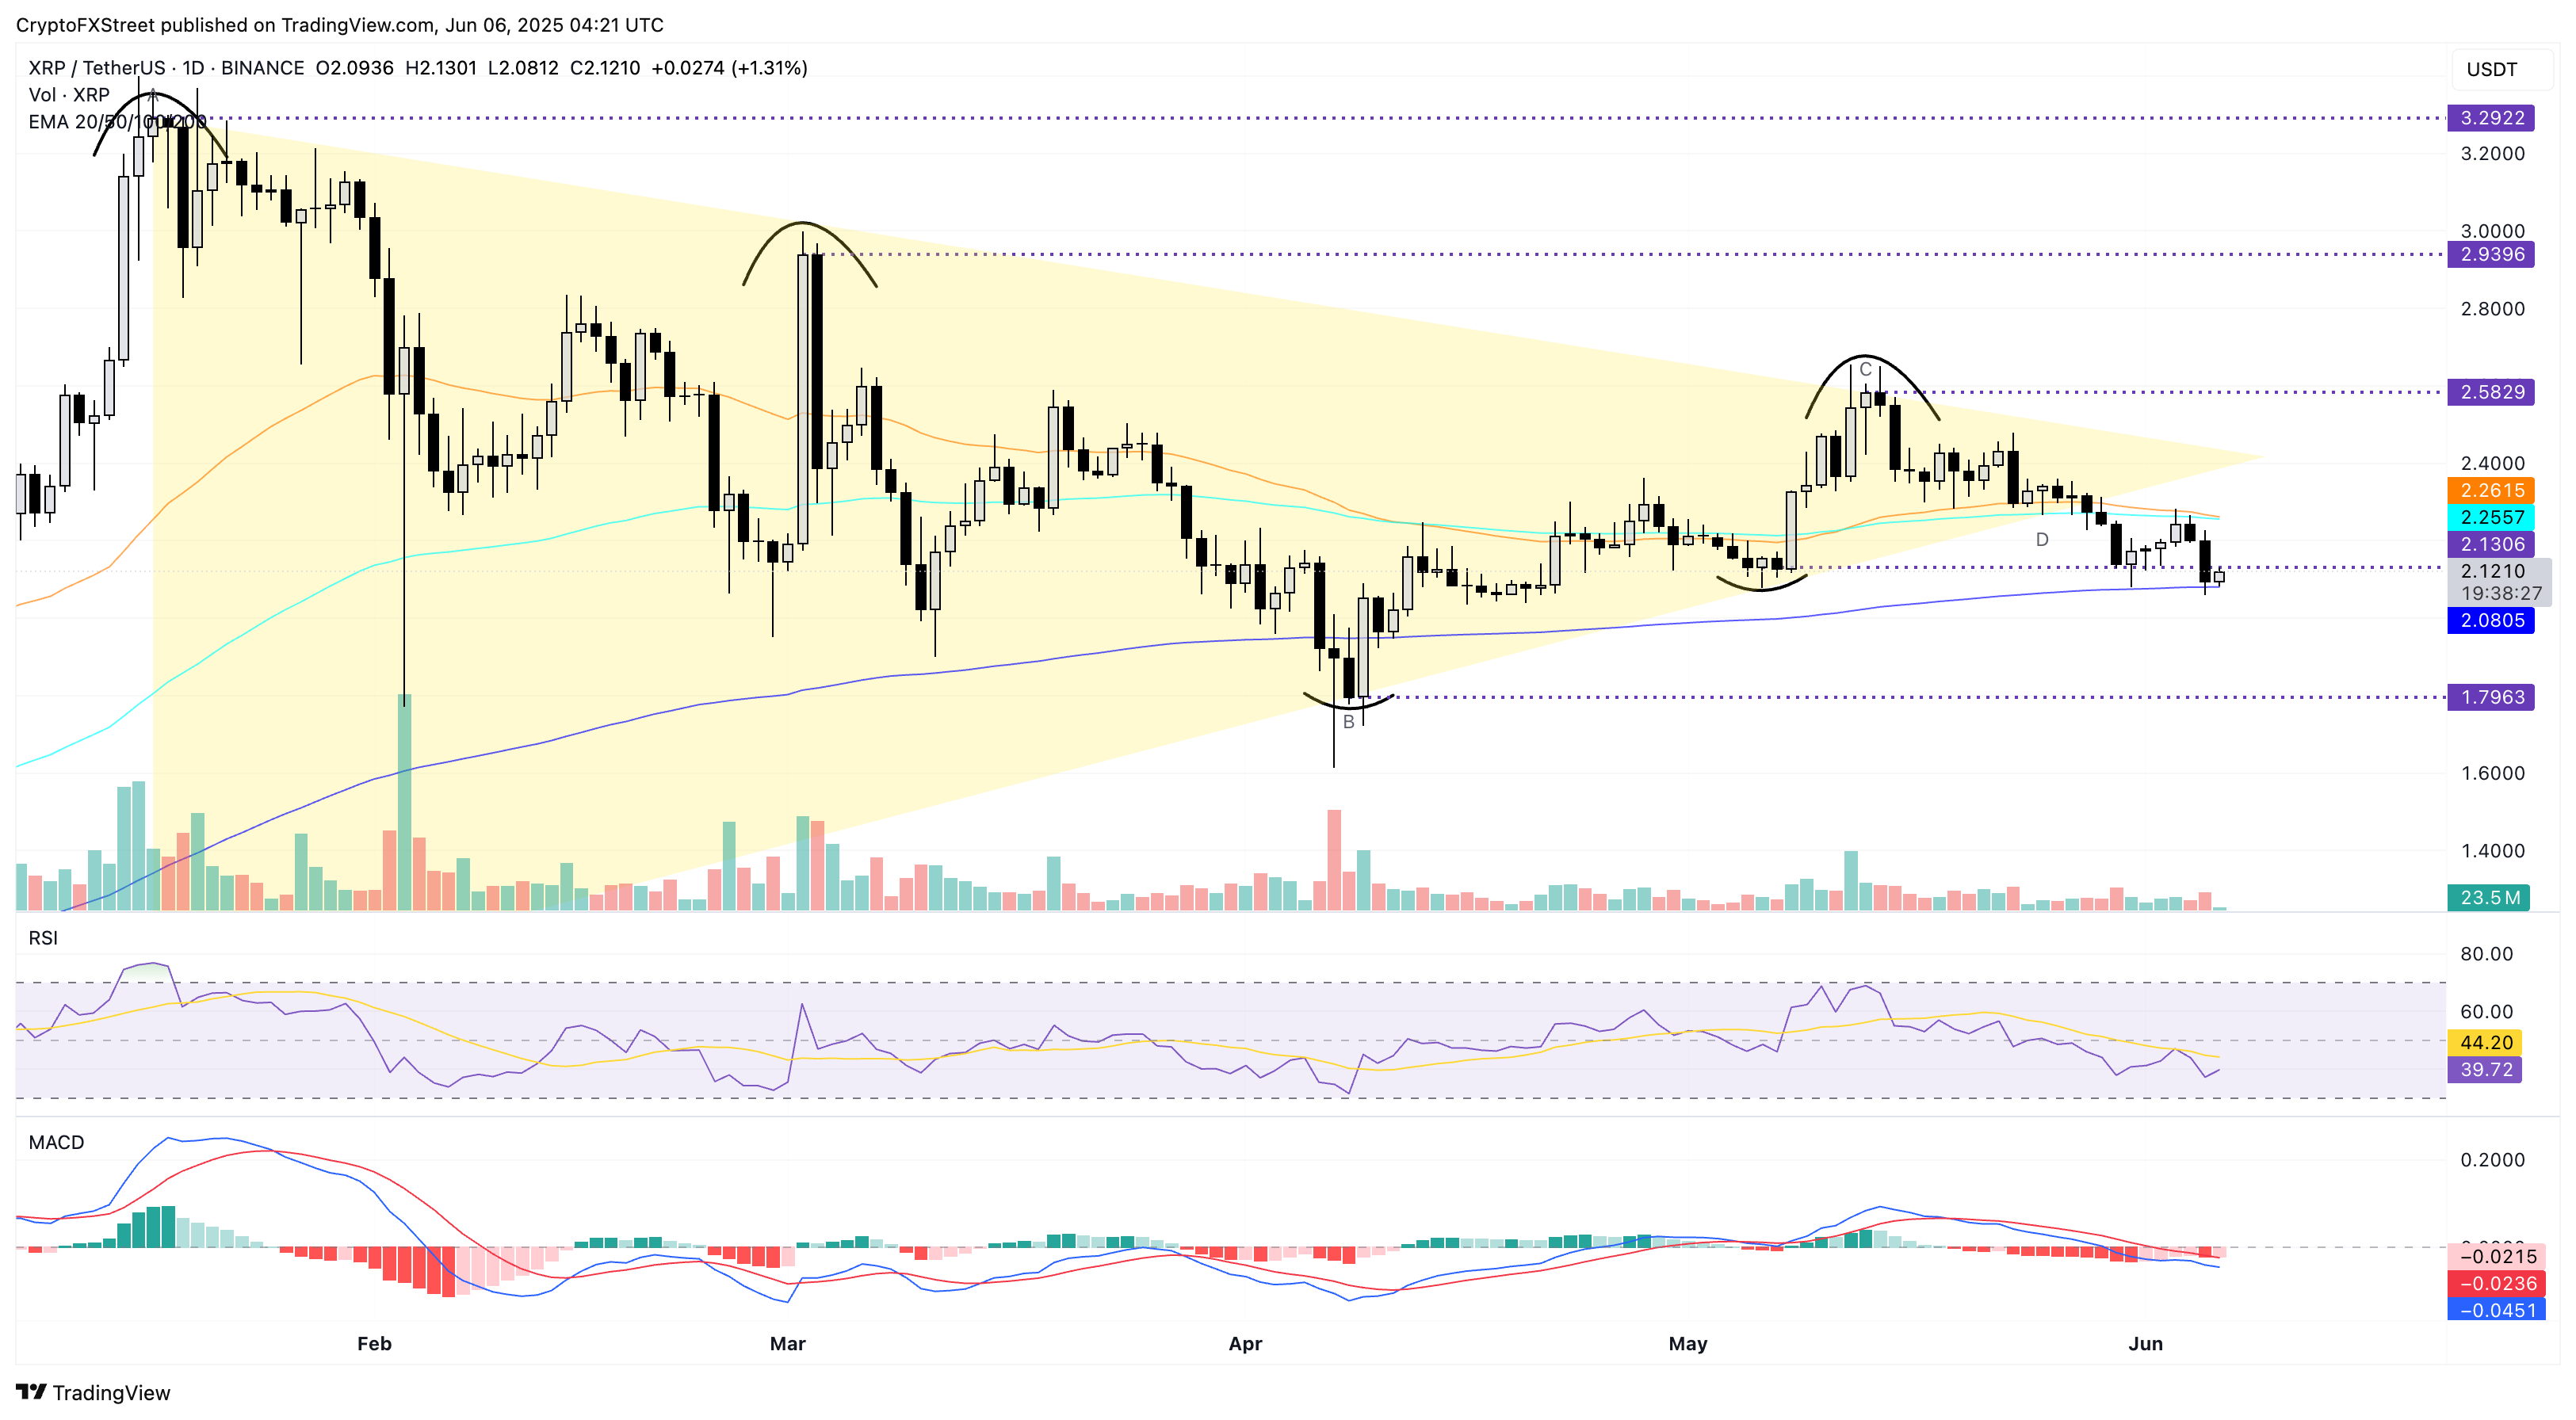
XRP/USDT daily price chart. Source: Tradingview
If XRP breaks below the 200-day EMA, it could extend the declining trend to the $1.79 support level, the lowest closing price in April.
บทความแนะนำ


