

Pi Network Price Forecast: PI halts decline at key support amid easing retail support

แหล่งที่มา Fxstreet
  • PI Network is up nearly 2% on Thursday, ticking higher after a roughly 7% decline the previous day.
  • PI futures Open Interest declines to $8.94 million, suggesting reduced risk appetite.
  • The technical outlook for PI is bearish, as downside momentum prevails.

Pi Network (PI) price is up nearly 2% on Thursday, ticking higher after seven consecutive bearish daily closes, including a 7% decline the previous day. Despite the mild recovery, retail support is lacking as PI futures Open Interest declines to $8.94 million, from $10.38 million the previous day. The technical outlook for the PI token is bearish as downside pressure mounts on the $0.0800 support level.

Pi Network is losing retail demand despite elevated social chatter

Pi Network futures witness a decline in the notional value of all open positions. CoinAnk data shows the PI futures Open Interest (OI) down to $8.94 million from $10.38 million the previous day, suggesting a reduced value due to a spot price decline or a possible positional wipeout. 

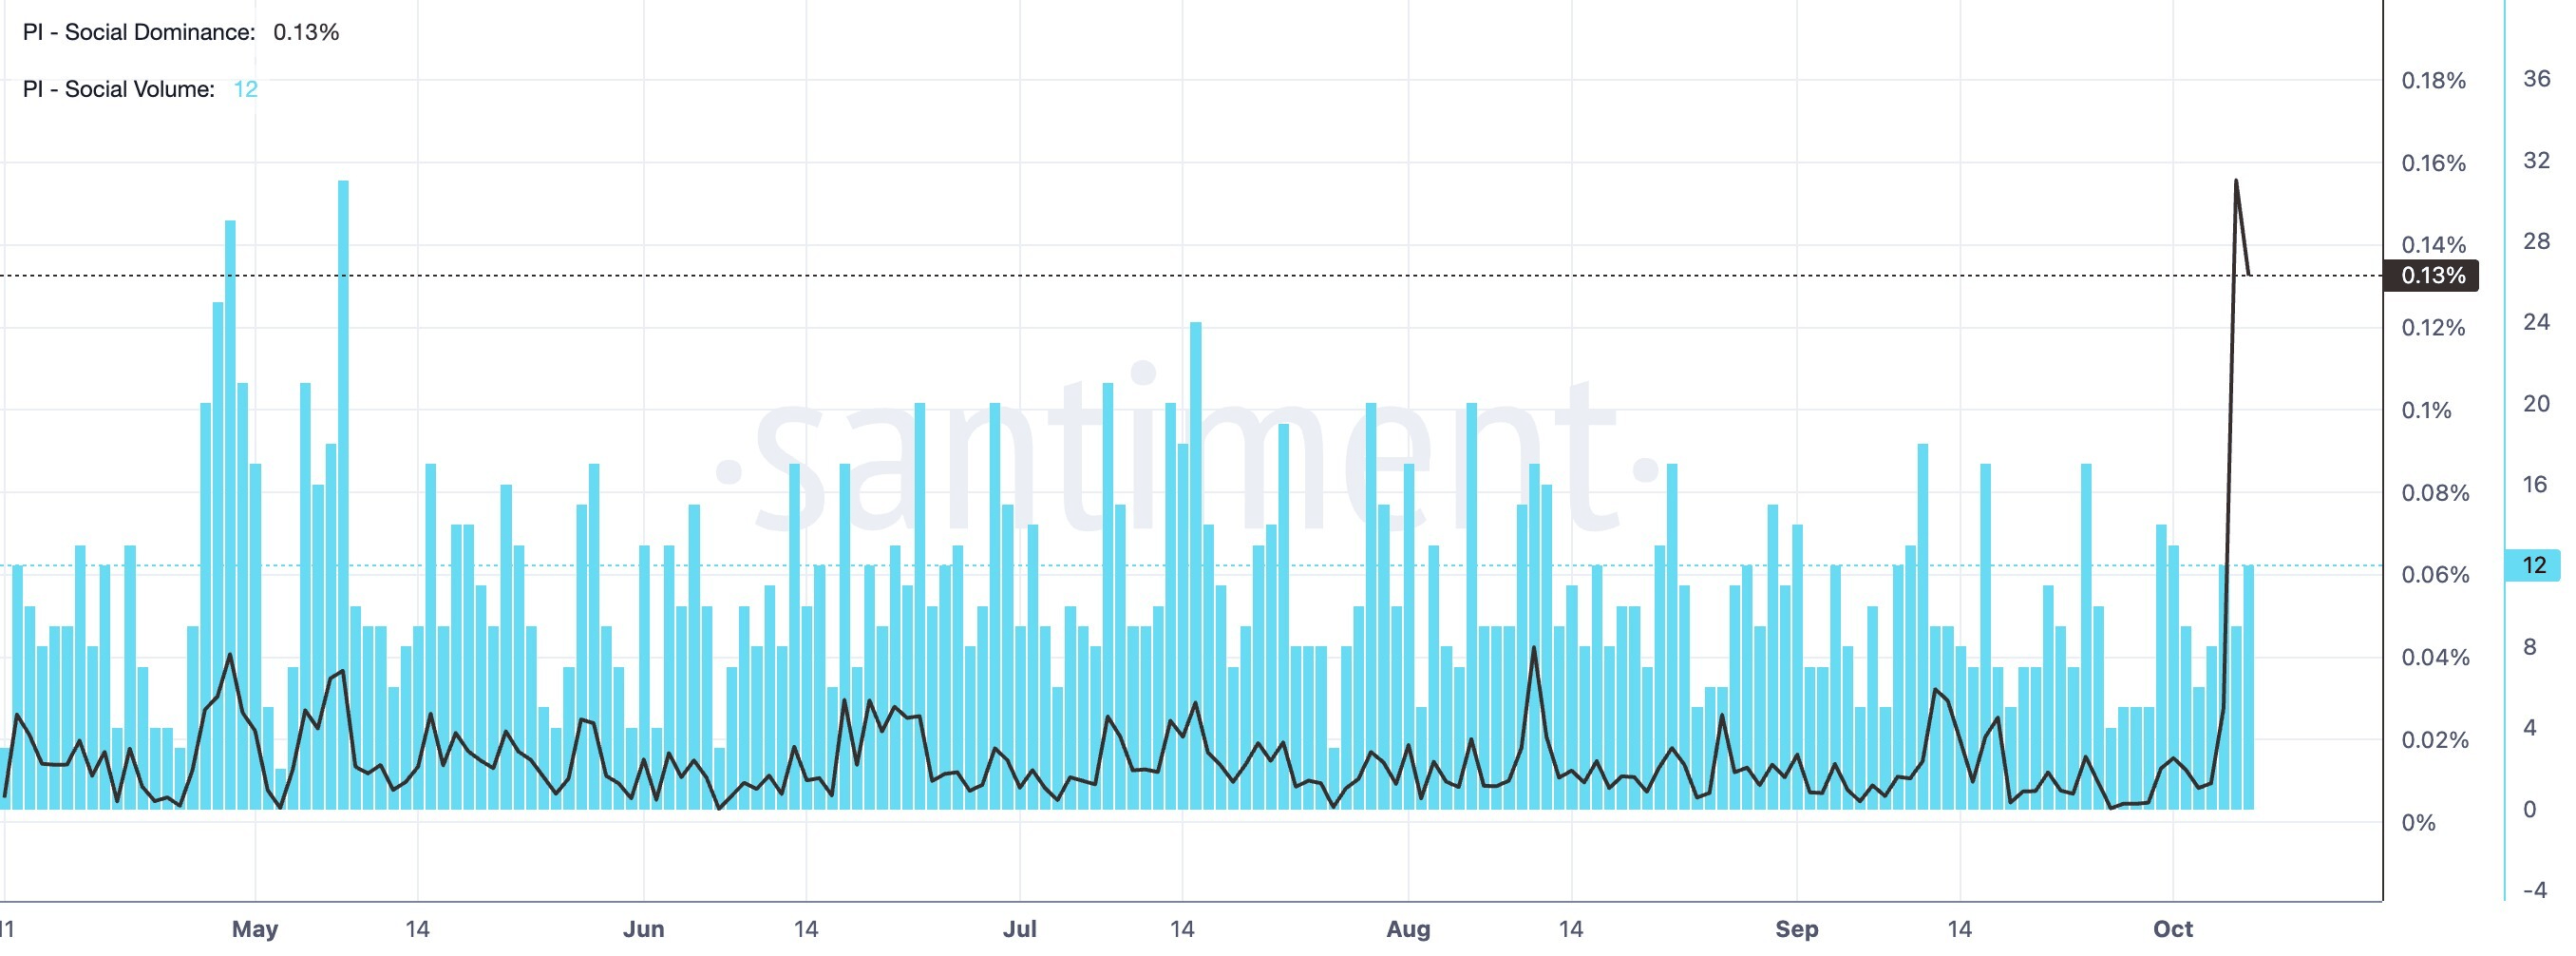
On the other hand, Santiment data shows elevated social buzz for the PI token, with the social dominance score at 0.13%, after a surge to 0.14% the previous day.
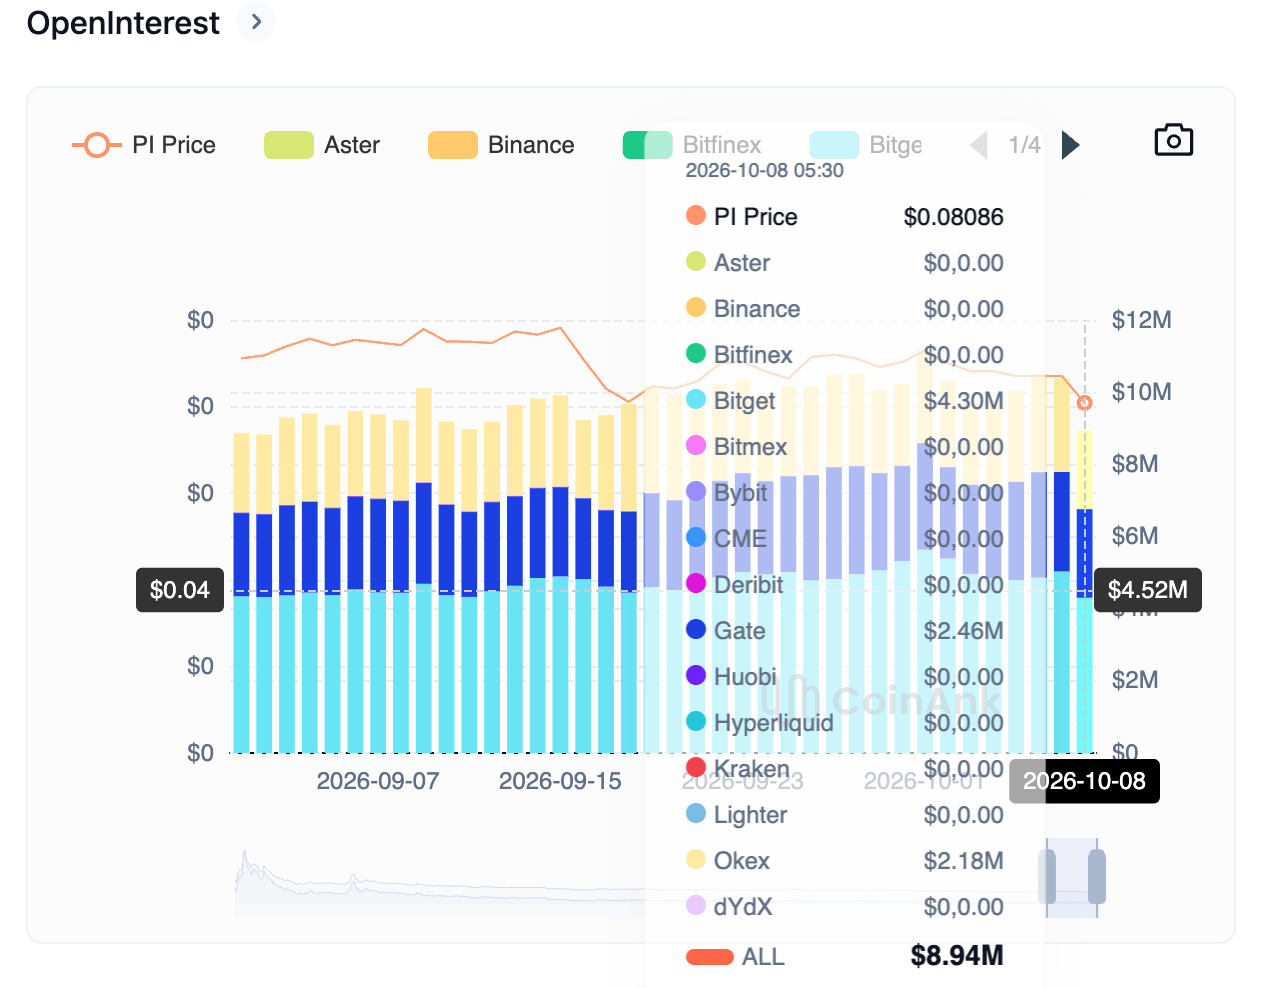
PI token Open Interest chart. Source: CoinAnk
PI social interest data. Source: Santiment

Technical outlook: Pi Network hints at a rebound

Pi Network trades around $0.0823 at press time on Thursday, extending a mild rebound from the $0.0801 support level set by the July 31 low. The PI token maintains a bearish near-term tone as it holds beneath both the 50-day and 200-day Exponential Moving Averages (EMAs) at $0.0902 and $0.1247, respectively.

From a technical perspective, PI trades below the 23.6% Fibonacci retracement at $0.0827, measured from $0.1341 to $0.0704, keeping the broader downside bias intact. For a sustained recovery, PI must reclaim the $0.0827 level, which could pave the path toward the 50-day EMA at $0.0902.

Momentum remains soft on the daily chart, with the Relative Strength Index (RSI) around 38, suggesting firm selling pressure rather than outright oversold conditions. At the same time, the Moving Average Convergence Divergence (MACD) line declines below the signal line into the negative territory, hinting that bearish momentum is gaining strength.

Chart Analysis PI/USD (baha Crypto)
PI/USD daily price chart.

On the downside, the only nearby structural support is at the July 31 low of $0.0801, guarding the Fibonacci anchor around $0.0704, where buyers may attempt to build a more durable floor.

(The technical analysis of this story was written with the help of an AI tool. Know more.)

ข้อจำกัดความรับผิดชอบ: เพื่อการอ้างอิงเท่านั้น ผลการดำเนินงานในอดีตไม่ได้บ่งบอกถึงผลลัพธ์ในอนาคต
placeholder
แนวโน้มราคาน้ำมันดิบ: WTI ขยับเข้าใกล้ 92 ดอลลาร์ ขณะที่วิกฤตช่องแคบฮอร์มุซส่งผลชดเชยอุปทานน้ำมันดีเซลของรัสเซียTradingKey - ขณะที่ความตึงเครียดในตะวันออกกลางยังคงอยู่ในระดับสูง อุปทานพลังงานทั่วโลกต้องเผชิญกับการทดสอบอีกครั้ง โดยเมื่อวันที่ 9 ตุลาคม ตามเวลาท้องถิ่น กองทัพพิทักษ์การปฏิวัติอิสลามของอิหร่านอ้างว่
ผู้เขียน  TradingKey
เมื่อวาน 08: 50
TradingKey - ขณะที่ความตึงเครียดในตะวันออกกลางยังคงอยู่ในระดับสูง อุปทานพลังงานทั่วโลกต้องเผชิญกับการทดสอบอีกครั้ง โดยเมื่อวันที่ 9 ตุลาคม ตามเวลาท้องถิ่น กองทัพพิทักษ์การปฏิวัติอิสลามของอิหร่านอ้างว่
placeholder
Netflix วางแผนปลดพนักงาน 5% ก่อนประกาศผลประกอบการ ขณะที่การเติบโตที่ชะลอตัวและแรงกดดันด้านต้นทุนสร้างความกังวลTradingKey - รายงานจาก Puck News เมื่อวันศุกร์โดยอ้างอิงแหล่งข่าวที่คุ้นเคยกับเรื่องนี้ระบุว่า เน็ตฟลิกซ์ (NFLX) มีแผนจะเลิกจ้างพนักงานประมาณ 5% ของจำนวนพนักงานทั้งหมด แผนดังกล่าวยังไม่ได้มีการประกาศอ
ผู้เขียน  TradingKey
เมื่อวาน 08: 49
TradingKey - รายงานจาก Puck News เมื่อวันศุกร์โดยอ้างอิงแหล่งข่าวที่คุ้นเคยกับเรื่องนี้ระบุว่า เน็ตฟลิกซ์ (NFLX) มีแผนจะเลิกจ้างพนักงานประมาณ 5% ของจำนวนพนักงานทั้งหมด แผนดังกล่าวยังไม่ได้มีการประกาศอ
placeholder
คาดการณ์ราคาหุ้น Tesla: ยอดส่งมอบจากโรงงานเซี่ยงไฮ้เดือนกันยายนเพิ่มขึ้น 10.7% MoM, ราคาหุ้นแตะระดับสูงสุดนับตั้งแต่ปลายเดือนกรกฎาคม; การปรับตัวขึ้นจะดำเนินต่อไปได้หรือไม่?TradingKey - เมื่อวันที่ 9 ตุลาคม ตามเวลาฝั่งตะวันออก หุ้นเทสลา (TSLA) ปรับตัวขึ้นมากกว่า 3% ทำสถิติสูงสุดใหม่นับตั้งแต่ช่วงปลายเดือนกรกฎาคม จากข้อมูลสถิติล่าสุดของสมาคมรถยนต์นั่งแห่งประเทศจีน โรงงานก
ผู้เขียน  TradingKey
เมื่อวาน 01: 44
TradingKey - เมื่อวันที่ 9 ตุลาคม ตามเวลาฝั่งตะวันออก หุ้นเทสลา (TSLA) ปรับตัวขึ้นมากกว่า 3% ทำสถิติสูงสุดใหม่นับตั้งแต่ช่วงปลายเดือนกรกฎาคม จากข้อมูลสถิติล่าสุดของสมาคมรถยนต์นั่งแห่งประเทศจีน โรงงานก
placeholder
แนวโน้มราคาทองคำ: ทองคำดีดตัวขึ้นเหนือ $4,200, ราคาน้ำมันที่ร่วงลงจะช่วยหนุนการปรับตัวขึ้นอีกครั้งได้หรือไม่?ณ วันศุกร์ (9 ตุลาคม) ราคาทองคำ (XAUUSD) ดีดตัวขึ้นอย่างชัดเจนหลังจากปรับตัวลดลงติดต่อกัน โดยในระหว่างช่วงการซื้อขายในตลาดเอเชียวันนี้ ราคาทองคำได้ดีดตัวขึ้นเหนือระดับ 4,200 ดอลลาร์ชั่วขณ
ผู้เขียน  TradingKey
10 เดือน 09 วัน ศุกร์
ณ วันศุกร์ (9 ตุลาคม) ราคาทองคำ (XAUUSD) ดีดตัวขึ้นอย่างชัดเจนหลังจากปรับตัวลดลงติดต่อกัน โดยในระหว่างช่วงการซื้อขายในตลาดเอเชียวันนี้ ราคาทองคำได้ดีดตัวขึ้นเหนือระดับ 4,200 ดอลลาร์ชั่วขณ
placeholder
คาดการณ์ราคา EURJPY: ทดสอบแนวต้านที่ 177.50 ใกล้เส้น EMA 9 วันEURJPY ปรับตัวขึ้นเป็นวันที่สองติดต่อกัน โดยเคลื่อนไหวอยู่ที่ประมาณ 177.40 ในช่วงตลาดลงทุนเอเชียวันศุกร์ การวิเคราะห์ทางเทคนิคของกราฟรายวันแสดงให้เห็นว่า คู่สกุลเงินกำลังเคลื่อนตัวลงภายในรูปแบบกรอบราคาขาลง ซึ่งบ่งชี้ว่าแนวโน้มขาลงยังคงมีอยู่
ผู้เขียน  FXStreet
10 เดือน 09 วัน ศุกร์
EURJPY ปรับตัวขึ้นเป็นวันที่สองติดต่อกัน โดยเคลื่อนไหวอยู่ที่ประมาณ 177.40 ในช่วงตลาดลงทุนเอเชียวันศุกร์ การวิเคราะห์ทางเทคนิคของกราฟรายวันแสดงให้เห็นว่า คู่สกุลเงินกำลังเคลื่อนตัวลงภายในรูปแบบกรอบราคาขาลง ซึ่งบ่งชี้ว่าแนวโน้มขาลงยังคงมีอยู่
goTop
quote