Cardano Price Forecast: ADA set for further decline on profit-taking acceleration, selling pressure

แหล่งที่มา Fxstreet
  • Cardano price breaks below the ascending trendline, signaling a bearish move ahead.
  • On-chain data indicate that ADA holders are realizing profits, which is fueling the selling pressure.
  • The technical outlook suggests a potential correction ahead, with a downside target near the $0.70 level.

Cardano (ADA) is trading in the red at around $0.80 as of Thursday’s writing, following a close below the ascending trendline earlier this week. On-chain data paints a bearish picture as holders realize profits and increase selling pressure. Furthermore, the technical outlook suggests a potential correction is on the horizon, with bears targeting the $0.70 mark.

Cardano faces pressure as profit-taking rises and bearish bets increase among traders

Santiments’ Network Realized Profit/Loss (NPL) metric shows Cardano holders are booking some profits after a massive drop in ADA price this week. This metric computes a daily network-level Return On Investment (ROI) based on the coin’s on-chain transaction volume. Strong spikes in a coin’s NPL indicate that its holders are, on average, selling their bags at a significant profit. On the other hand, strong dips imply that the coin’s holders are, on average, realizing losses, suggesting panic sell-offs and investor capitulation.

As shown in the chart below, the metric showed a strong spike on Tuesday and Wednesday, indicating that holders are, on average, selling their bags at a significant profit and increasing the selling pressure.

ADA NPL chart. Source: Santiment

ADA NPL chart. Source: Santiment

Apart from increasing selling pressure, Coinglass data show that the long-to-short ratio for Cardano reads 0.84 on Thursday. This ratio, below one, reflects bearish sentiment in the markets, as more traders are betting on the Cardano price to fall.

Cardano long-to-short ratio chart. Source: Coinglass

Cardano long-to-short ratio chart. Source: Coinglass

Additionally, as explained in the previous report, the rising activity among the dormant wallets further supports the bearish sentiment.

Cardano Price Forecast: ADA bears aiming for further correction 

Cardano price broke below the ascending trendline (drawn by connecting multiple lows since early July) on Monday and declined 8.83% by the next day. However, on Wednesday, it recovered slightly, facing resistance around the 61.8% Fibonacci retracement level at $0.82 (drawn from the June low of $0.51 to the August high of $1.02). At the time of writing on Thursday, it trades around $0.80.

If ADA continues its downward trend and closes below the 100-day EMA at $0.80 on a daily basis, it could extend the decline to retest its 50% price retracement level at $0.76. A successful close below this level could extend the losses toward the daily level at $0.70.

The Relative Strength Index (RSI) on the daily chart reads 40, below its neutral level of 50, indicating bearish momentum. Additionally, the Moving Average Convergence Divergence (MACD) also showed a bearish crossover on Monday, signaling a sell and indicating bearish momentum and a downward trend ahead.
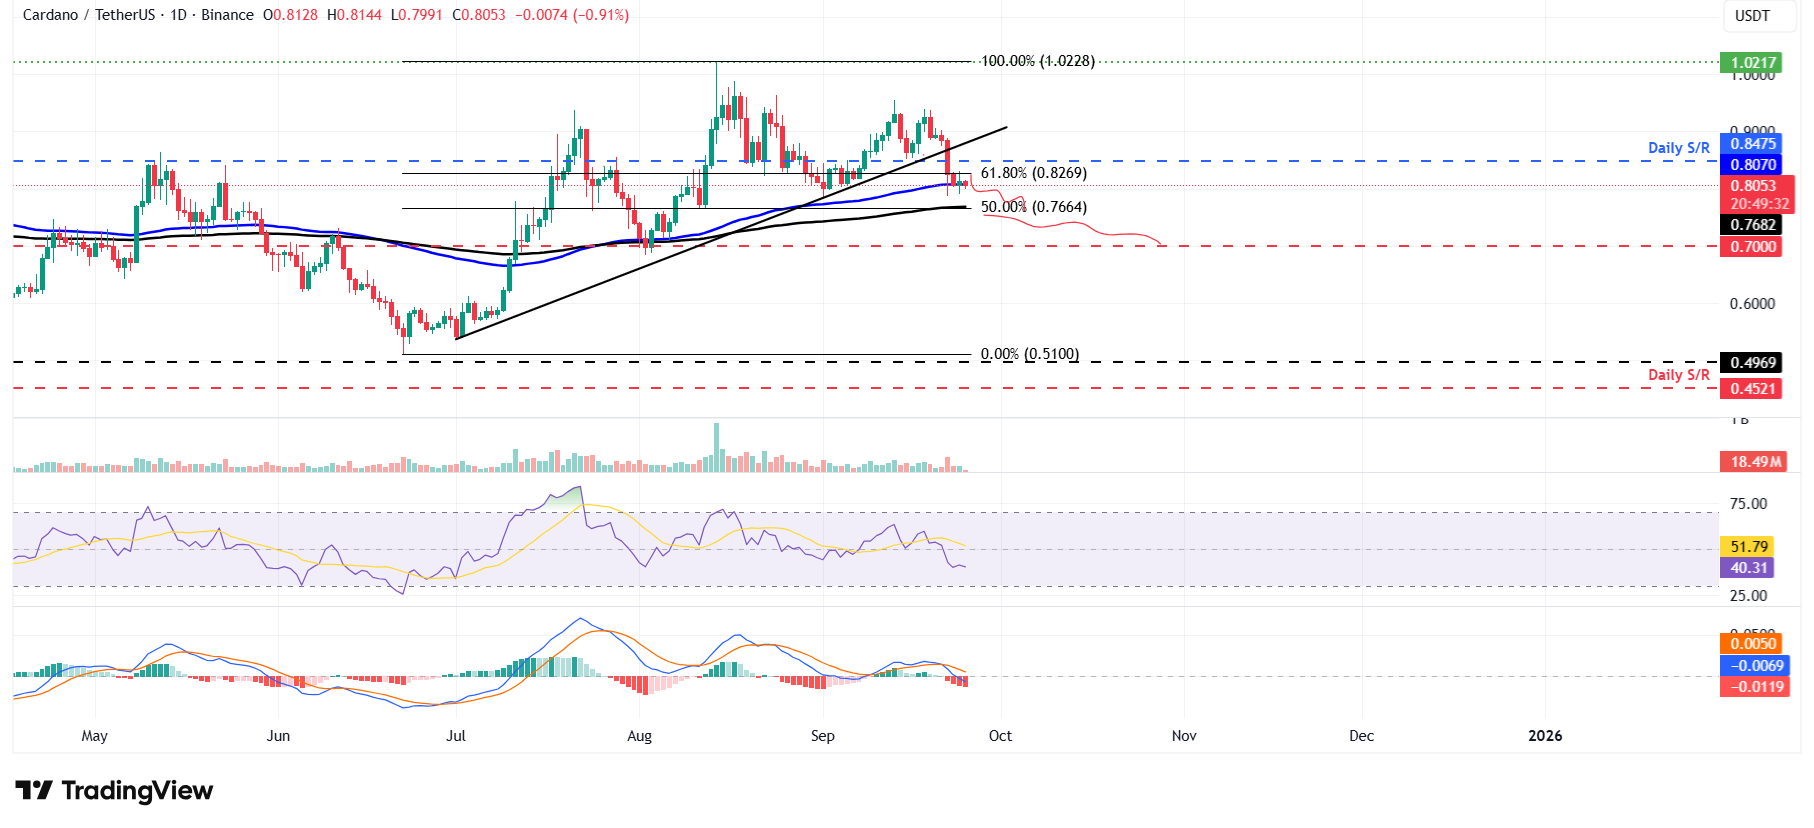
ADA/USDT daily chart

ADA/USDT daily chart

However, if ADA recovers, it could extend the recovery toward the daily resistance level at $0.84.

ข้อจำกัดความรับผิดชอบ: เพื่อการอ้างอิงเท่านั้น ผลการดำเนินงานในอดีตไม่ได้บ่งบอกถึงผลลัพธ์ในอนาคต
placeholder
คาดการณ์ราคาเงิน: XAG/USD ยังคงอยู่เหนือ $45.00 ใกล้ระดับสูงสุดในรอบ 14 ปีใหม่ในช่วงเช้าของตลาดลงทุนยุโรป ราคาเงิน (XAG/USD) ยังคงอยู่ใกล้ระดับสูงสุดในรอบ 14 ปีใหม่ที่ $45.29 ซึ่งทำได้เมื่อวันศุกร์ ซื้อขายอยู่ที่ประมาณ $45.20 โลหะมีค่าเงินยังคงเป้นขาลงหลัเพิ่มขึ้นเกือบ 3% ในเซสชันก่อนหน้า นักลงทุนรอข้อมูลดัชนีราคาการใช้จ่ายเพื่อการบริโภคส่วนบุคคล (PCE) ของสหรัฐฯ ในเดือนสิงหาค
ผู้เขียน  FXStreet
เมื่อวาน 08: 49
ในช่วงเช้าของตลาดลงทุนยุโรป ราคาเงิน (XAG/USD) ยังคงอยู่ใกล้ระดับสูงสุดในรอบ 14 ปีใหม่ที่ $45.29 ซึ่งทำได้เมื่อวันศุกร์ ซื้อขายอยู่ที่ประมาณ $45.20 โลหะมีค่าเงินยังคงเป้นขาลงหลัเพิ่มขึ้นเกือบ 3% ในเซสชันก่อนหน้า นักลงทุนรอข้อมูลดัชนีราคาการใช้จ่ายเพื่อการบริโภคส่วนบุคคล (PCE) ของสหรัฐฯ ในเดือนสิงหาค
placeholder
ทองคำลดการปรับตัวขึ้นเมื่อข้อมูลเศรษฐกิจสหรัฐฯ ที่แข็งแกร่งทำให้แนวโน้มการลดอัตราดอกเบี้ยราคาทองคำปรับตัวลดลงจากการเพิ่มขึ้นก่อนหน้านี้หลังจากแตะระดับสูงสุดในวันที่ 3,761 ดอลลาร์ในวันพฤหัสบดี หลังจากการเปิดเผยรายงานการจ้างงานของสหรัฐฯ ที่แสดงให้เห็นถึงสัญญาณความแข็งแกร่ง ซึ่งตรงข้ามกับเหตุผลหลักในการปรับลดอัตราดอกเบี้ยเมื่อสัปดาห์ที่แล้ว นอกจากนี้ เทรดเดอร์ยังจับตามองการเปิดเผยข้อมูลเงินเฟ้อในวันศุกร์
ผู้เขียน  FXStreet
เมื่อวาน 01: 50
ราคาทองคำปรับตัวลดลงจากการเพิ่มขึ้นก่อนหน้านี้หลังจากแตะระดับสูงสุดในวันที่ 3,761 ดอลลาร์ในวันพฤหัสบดี หลังจากการเปิดเผยรายงานการจ้างงานของสหรัฐฯ ที่แสดงให้เห็นถึงสัญญาณความแข็งแกร่ง ซึ่งตรงข้ามกับเหตุผลหลักในการปรับลดอัตราดอกเบี้ยเมื่อสัปดาห์ที่แล้ว นอกจากนี้ เทรดเดอร์ยังจับตามองการเปิดเผยข้อมูลเงินเฟ้อในวันศุกร์
placeholder
AUD/USD อ่อนค่าลงต่ำกว่า 0.6600 จากมุมมองอัตราดอกเบี้ยที่ระมัดระวังของนายพาวเวลล์จากเฟดในช่วงเช้าของตลาดลงทุนเอเชียวันพฤหัสบดี คู่ AUDUSD ปรับตัวลดลงมาใกล้ 0.6585 ท่าทีที่ระมัดระวังเกี่ยวกับอัตราดอกเบี้ยของประธานธนาคารกลางสหรัฐฯ (เฟด) นายเจอโรม พาวเวลล์ ให้การสนับสนุนค่าเงินดอลลาร์สหรัฐ (USD) ต่อดอลลาร์ออสเตรเลีย (AUD)
ผู้เขียน  FXStreet
9 เดือน 25 วัน พฤหัส
ในช่วงเช้าของตลาดลงทุนเอเชียวันพฤหัสบดี คู่ AUDUSD ปรับตัวลดลงมาใกล้ 0.6585 ท่าทีที่ระมัดระวังเกี่ยวกับอัตราดอกเบี้ยของประธานธนาคารกลางสหรัฐฯ (เฟด) นายเจอโรม พาวเวลล์ ให้การสนับสนุนค่าเงินดอลลาร์สหรัฐ (USD) ต่อดอลลาร์ออสเตรเลีย (AUD)
placeholder
คาดการณ์ XAUUSD: ราคาทองคำเคลื่อนตัวสูงขึ้นใกล้ $3,750 ท่ามกลางการเก็งการลดดอกเบี้ยและความเสี่ยงทางภูมิศาสตร์ในช่วงเช้าของตลาดลงทุนเอเชียวันพฤหัสบดี ราคาทองคํา (XAUUSD) เคลื่อนไหวในแดนบวกที่บริเวณ $3,750 ทองคำปรับตัวสูงขึ้นท่ามกลางความคาดหวังเกี่ยวกับการปรับลดอัตราดอกเบี้ยของสหรัฐฯ จากธนาคารกลางสหรัฐฯ (เฟด) ในปีนี้และความเสี่ยงทางภูมิรัฐศาสตร์ที่ยังคงมีอยู่
ผู้เขียน  FXStreet
9 เดือน 25 วัน พฤหัส
ในช่วงเช้าของตลาดลงทุนเอเชียวันพฤหัสบดี ราคาทองคํา (XAUUSD) เคลื่อนไหวในแดนบวกที่บริเวณ $3,750 ทองคำปรับตัวสูงขึ้นท่ามกลางความคาดหวังเกี่ยวกับการปรับลดอัตราดอกเบี้ยของสหรัฐฯ จากธนาคารกลางสหรัฐฯ (เฟด) ในปีนี้และความเสี่ยงทางภูมิรัฐศาสตร์ที่ยังคงมีอยู่
placeholder
บิตคอยน์เข้าใกล้ 110,000 ดอลลาร์ แตะจุดต่ำสุด 2 สัปดาห์TradingKey – บิตคอยน์ (BTC) ยังคงทิศทางลง โดยเข้าใกล้ระดับ 110,000 ดอลลาร์ ในช่วง 24 ชั่วโมงที่ผ่านมา บิตคอยน์ร่วงลงแตะจุดต่ำสุดที่ 111,000 ดอลลาร์ในช่วงเช้า ซึ่งเทียบเท่ากับจุดต่ำสุดเมื่อวันที่ 10 กั
ผู้เขียน  TradingKey
9 เดือน 24 วัน พุธ
TradingKey – บิตคอยน์ (BTC) ยังคงทิศทางลง โดยเข้าใกล้ระดับ 110,000 ดอลลาร์ ในช่วง 24 ชั่วโมงที่ผ่านมา บิตคอยน์ร่วงลงแตะจุดต่ำสุดที่ 111,000 ดอลลาร์ในช่วงเช้า ซึ่งเทียบเท่ากับจุดต่ำสุดเมื่อวันที่ 10 กั
ตราสารที่เกี่ยวข้อง
goTop
quote