
Bitcoin Cash hits a yearly high following the Fed's 25 bps rate cut
- Bitcoin Cash price is extending its gains on Thursday, reaching a new year-to-date high of $648.20.
- The price surge follows the US Fed's decision to lower interest rates by 25 bps, with the possibility of two additional rate cuts this year.
- On-chain data show that BCH's trading volume reached 1.18 billion on Thursday, levels not seen since December 2024.
Bitcoin Cash (BCH) surges to a fresh yearly high of $648.20 at the time of writing on Thursday, extending its bullish momentum in the wake of the US Federal Reserve’s (Fed) 25 basis point (bps) rate cut. Moreover, the possibility of additional cuts later this year further fueled risk-on sentiment across the cryptocurrency market. On-chain data also support the bullish outlook, with trading volumes hitting the highest levels since December 2024, indicating renewed investor interest in BCH.
Fed’s rate cut decision fuels risk-on sentiment
Bitcoin Cash gained nearly 3% on Wednesday after the Federal Open Market Committee (FOMC) announced a 25 basis point (bps) interest rate cut, boosting risk appetite across cryptocurrency markets.
Apart from the 25 bps rate cut, which the market participants had expected, the FOMC's latest dot plot indicates that interest rates will average 3.6% by the end of 2025, below the June projection of 3.9%.
If this forecast comes true, the Federal Reserve (Fed) could implement two additional 25 basis point (bps) rate cuts or a single 50 bps cut in 2025, after trimming the interest rate by 25 bps on Wednesday. Moreover, in 2026, rates are projected to drop to 3.4% from the previous 3.6% and to 3.1% in 2027, below the 3.4% projected in the June dot plot. The longer-term forecast remains at 3%.
This dovish stance by the Fed triggered a risk-on sentiment, with BCH reaching a new yearly high of $648.20 when writing on Thursday.
BCH’s trading volume hit a new yearly high
Santiment data indicate that the BCH ecosystem’s trading volume reached a new yearly high of $1.18 billion on Thursday, and levels not seen since December 2024. This volume rise indicates a surge in traders’ interest and liquidity in the BCH chain, boosting its bullish outlook.
 [09-1758174546820-1758174546823.45.42, 18 Sep, 2025].png)
BCH trading volume chart. Source: Santiment
Futures’ Open Interest (OI) in Bitcoin Cash at exchanges rose from $486.36 million on September 11 to $595.78 million on Thursday, and has been consistently rising. Rising OI represents new or additional money entering the market and new buying, which could fuel the current BCH price rally.
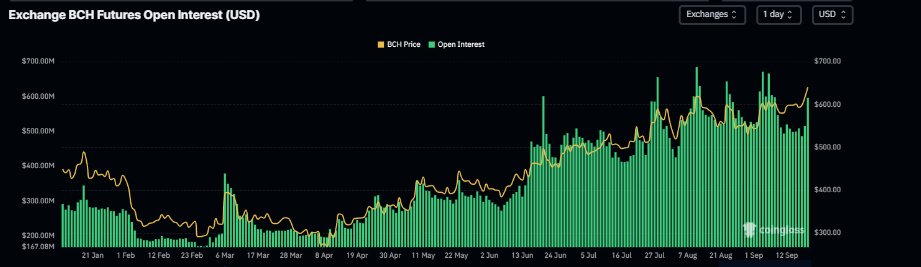
Bitcoin Cash open interest chart. Source: Coinglass
Another bullish sign is Coinglass’s BCH long-to-short ratio, which stands at 1.28, the highest level in over a month. This ratio, above one, reflects bullish sentiment in the markets, as more traders are betting on the asset price to rise.
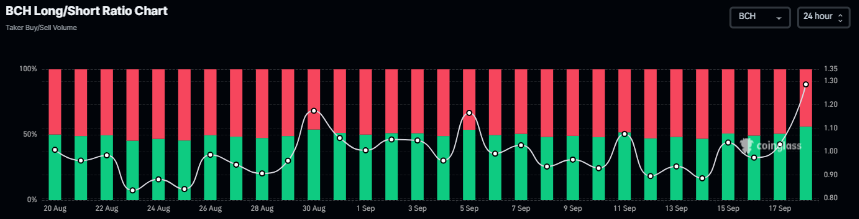
BCH long-to-short ratio chart. Source: Coinglass
Bitcoin Cash Price Forecast: Bulls aiming for levels above $700
Bitcoin Cash price declined slightly at the start of the week on Monday, but recovered the next day and closed above $616.70 on Wednesday. At the time of writing on Thursday, it continues its upward momentum, reaching a new yearly high of $648.28.
If BCH continues its upward trend, it could extend the rally to retest its April 5, 2024, high of $719.50.
The Relative Strength Index (RSI) on the daily chart reads 65, above its neutral level of 50, and points upward, indicating that bullish momentum is gaining traction. The Moving Average Convergence (MACD) indicator on the same chart displayed a bullish crossover in early September, which remains in effect, indicating sustained bullish momentum and an upward trend ahead.
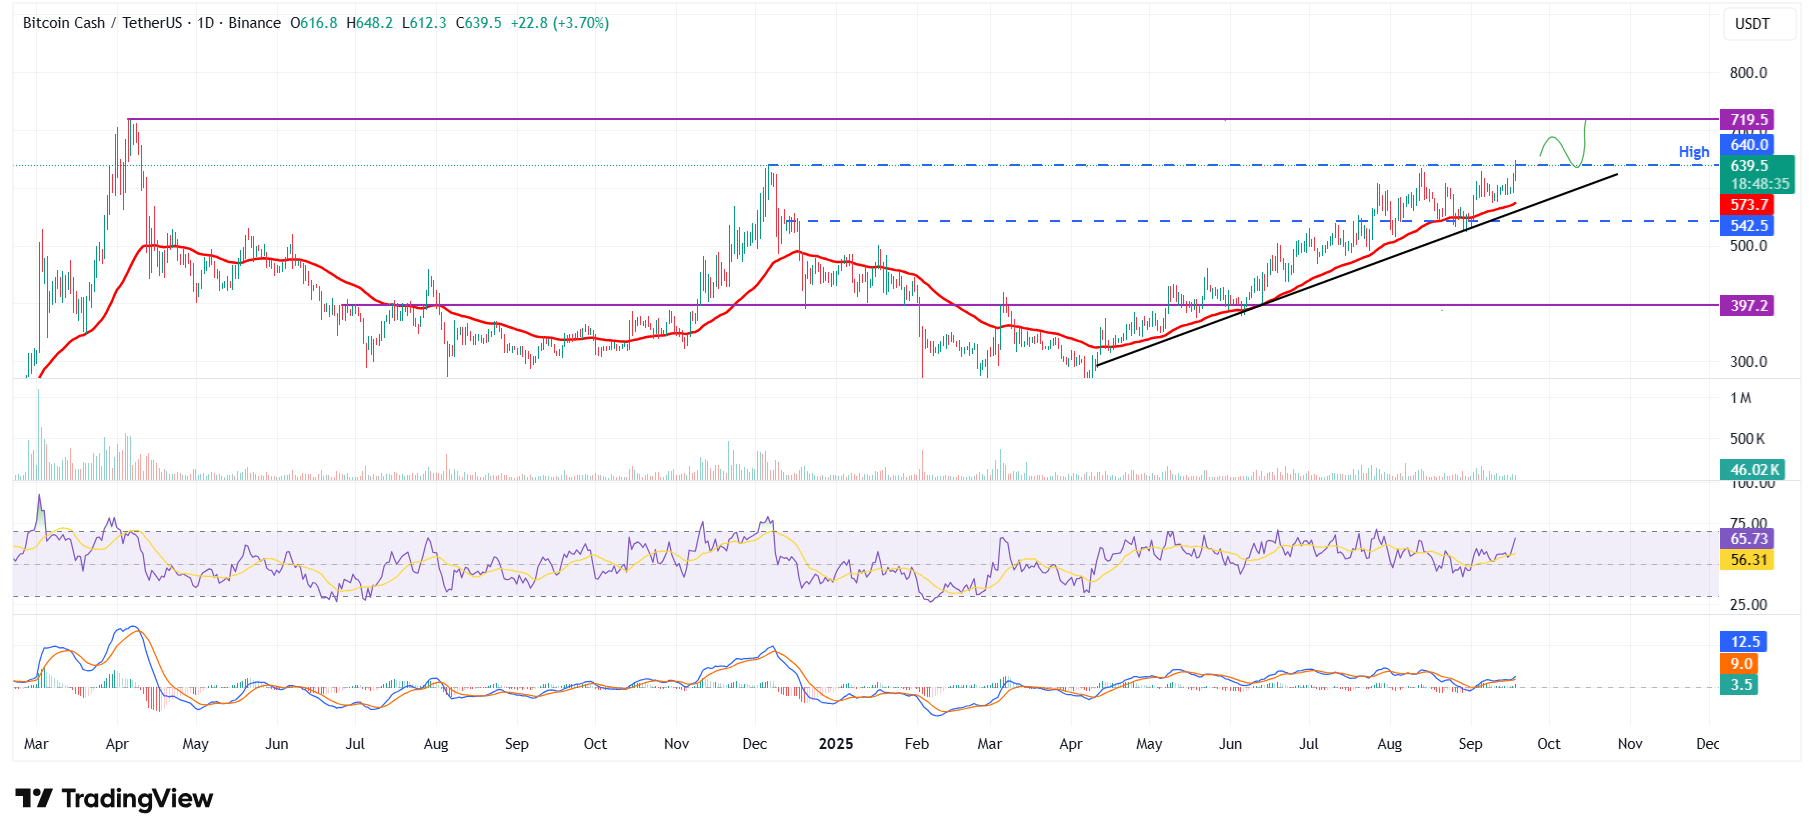
BCH/USDT daily chart
However, if BCH faces a correction, it could extend the decline toward its 50-day Exponential Moving Average (EMA) at $573.7.
บทความแนะนำ


