


Dow Jones Industrial Average borrows its rebound from the bond market
- DJIA trades near 53,000, up roughly 250 points, after a low beneath the 50-day EMA.
- Ship trackers logged five vessels through Hormuz on Monday, none of them tankers.
- September hike odds near 66%, up from roughly 40% a week ago.
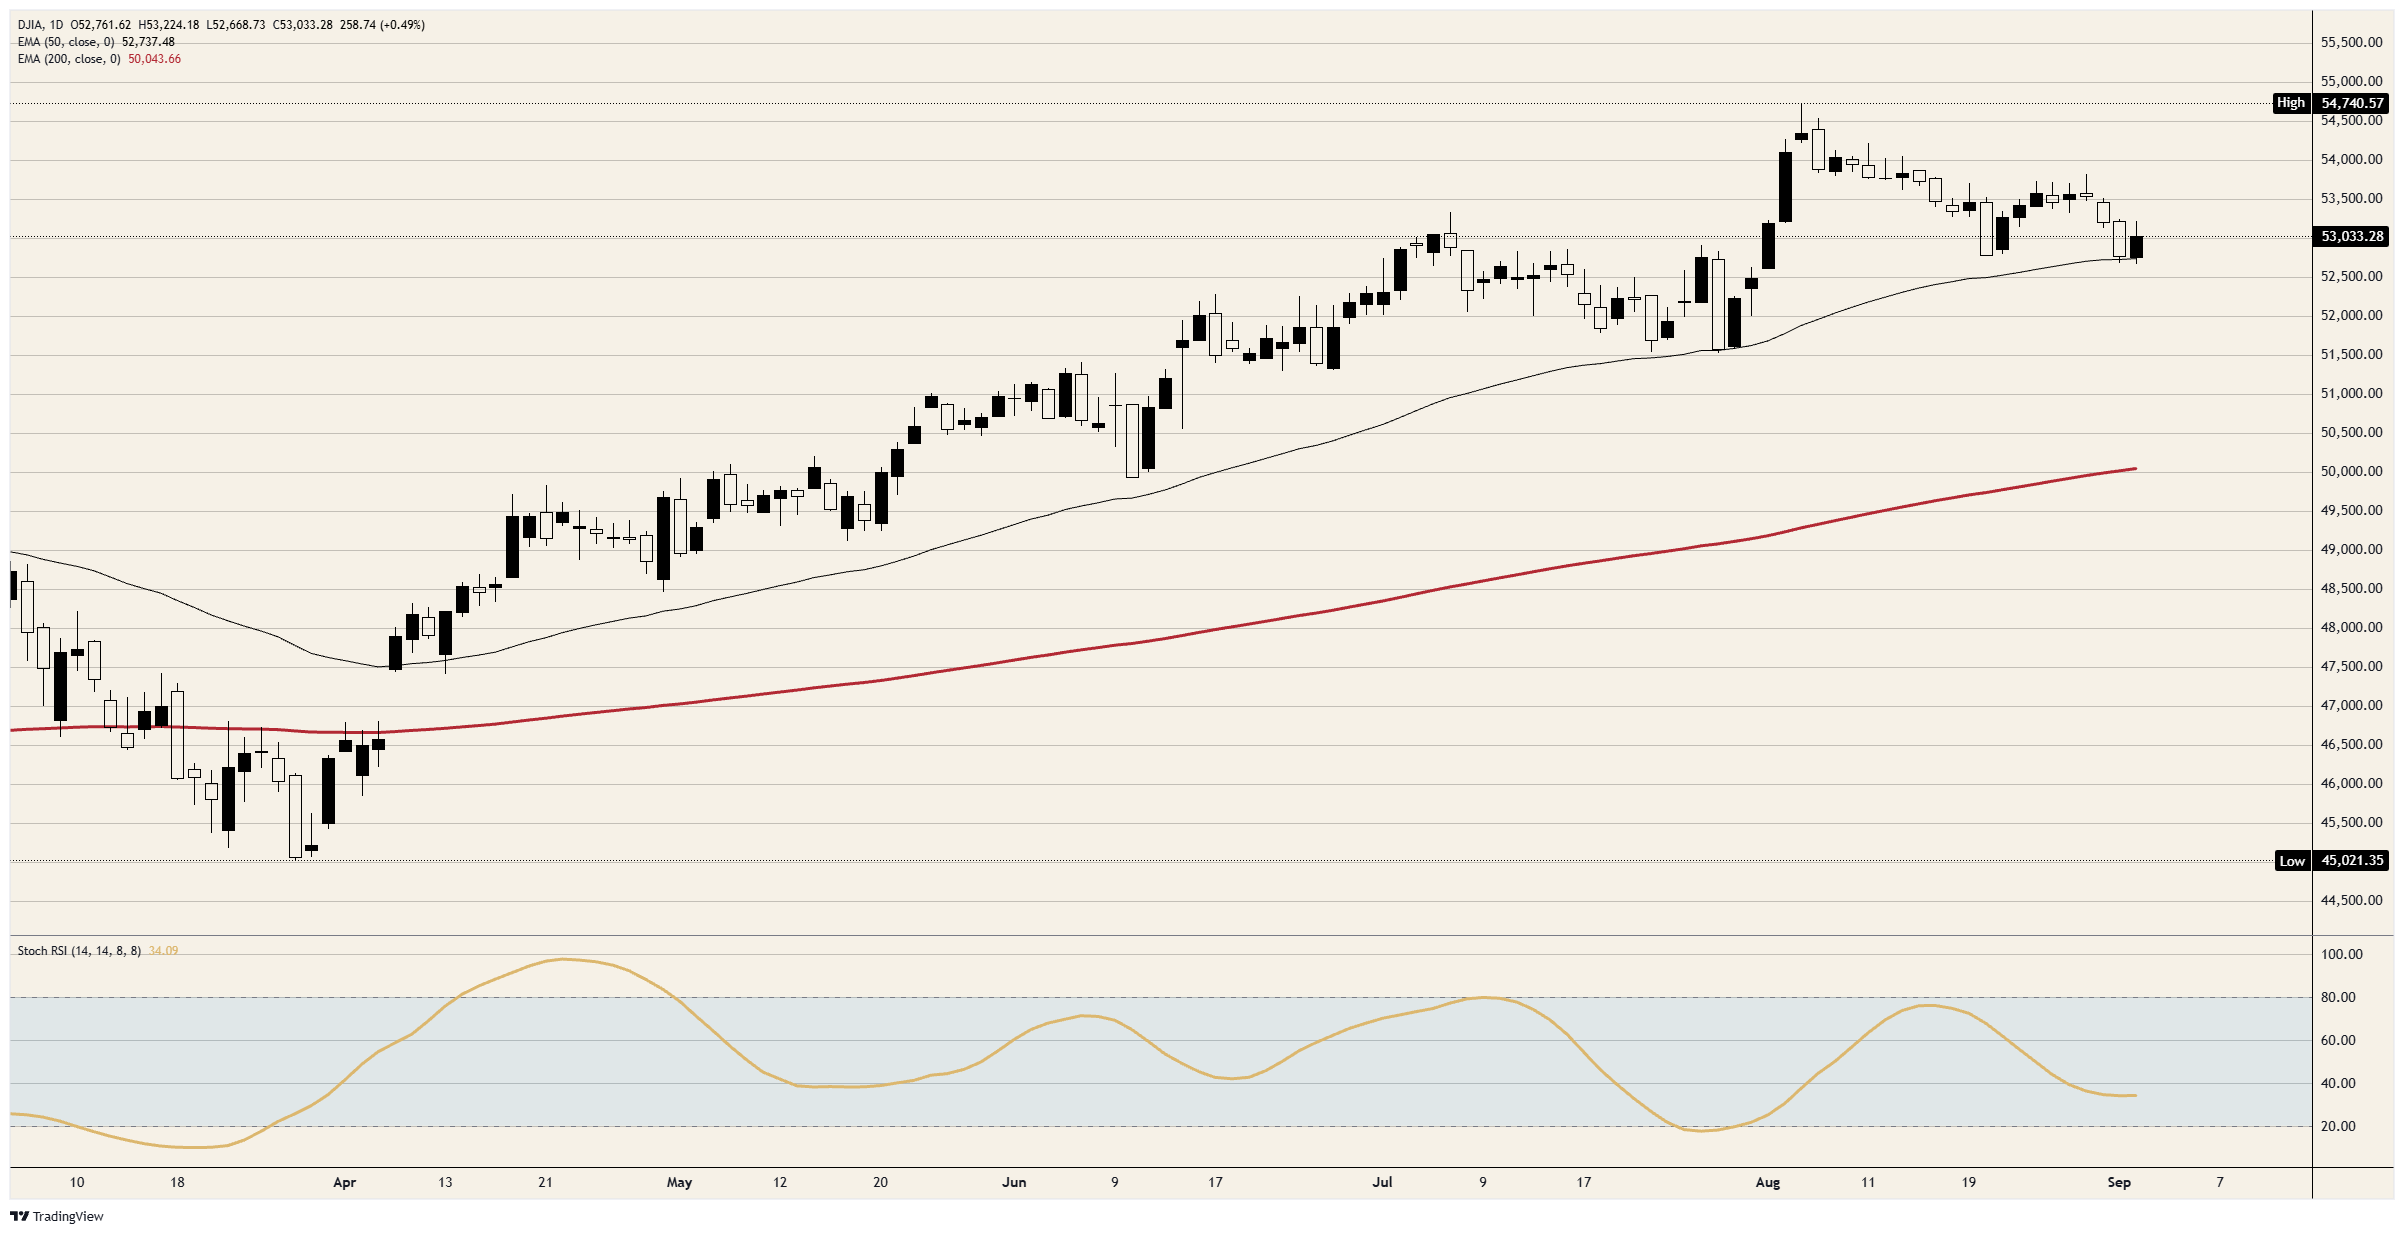
The Dow Jones Industrial Average trades near 53,000 and roughly 250 points higher, having opened just above 52,750, dipped to a session low beneath the rising 50-day Exponential Moving Average (EMA) near 52,700, and recovered the whole of that ground. The rebound attempt arrives after three consecutive lower sessions and is worth about half a percent. What it is not is an equity event, because nothing in the case for owning these thirty companies changed between Tuesday and this morning.
The bid was placed in the bond market
The benchmark 10-year Treasury note yield touched 4.818% during the session, a level last seen in November 2023. The 30-year sits above 5.28% and the 2-year near 4.40%, with British, German and French paper all cheaper on the day and Japanese 10-year debt parked at multi-decade highs. Equities turned at the moment the long end stopped climbing, which is the whole of the mechanism.
Officialdom spent the morning talking to that tape. The New York Federal Reserve president described the yield surge as the product of a strong economy rather than any dysfunction in the market, and declined to say whether further tightening is required. The commerce secretary offered the mirror image, arguing that faster growth and a shrinking deficit will pull rates lower over roughly six months. Neither moved the pricing, which now puts a September hike near 66% against roughly 40% a week ago.
The barrel count nobody can check
The bullish case circulating on desks is that Crude Oil is topping out, and that a barrel rolling over takes the inflation premium out of the long end. West Texas Intermediate (WTI) trades above $90.00 and Brent above $94.50, the latter some $20 above where it sat before the war began on February 28. American forces struck Islamic Revolutionary Guard Corps (IRGC) targets near Bandar Abbas and along Iran's southern coast on Tuesday, after two tankers were hit while transiting the Strait of Hormuz.
The number underwriting the topping-out thesis is a government estimate. The energy secretary said more than 17 million barrels moved through the strait on Monday, a record for the war, and that regional exports beat pre-war levels once the Saudi and Emirati bypass pipelines are counted against a pre-war throughput near 20 million barrels per day. Preliminary tracking data logged five commodity vessels that day against a ten-day average near 14, and not one of them was a liquid tanker. Dark transits are real and the same tracker has since revised its crude flow estimate up to roughly 8.6 million barrels per day, which is still about half the figure now doing the work.
The labour print that bought nothing
Private payrolls added 38K in August against a 47K consensus and 46K in July, the smallest monthly gain since January, with the hiring concentrated in health care and a scatter of sectors shedding staff outright. In an ordinary cycle a miss of that size arrives as an equity tailwind, on the reasoning that a cooling labour market pulls the central bank toward easing and lifts the multiple.
That transmission is broken here. The chair used last week's symposium keynote to say the summer inflation readings did not persuade him that the underlying trend has improved, and the committee is being priced for a hike into a labour market that is visibly softening. An index that rallies on the day it receives evidence of a slowing economy is not expressing a growth view. Nvidia (NVDA) and Johnson & Johnson (JNJ) supplied most of today's lift, and neither did so for a reason traceable to the payroll estimate.
The week's actual tests
The Beige Book lands at 18:00 GMT today and two policymakers speak Thursday, at 12:30 and 19:00 GMT. The Institute for Supply Management (ISM) services Purchasing Managers Index (PMI) arrives Thursday at 14:00 GMT, forecast at 54.3 against 54.1 prior, with the prices paid component last at 70.3 and the employment index last at 47.4. Those two subindices carry the policy content, because they are where an energy shock reaches the services economy first and where the labour cooling either confirms itself or does not.
August payrolls follow Friday at 12:30 GMT, forecast at 58K after a 23K contraction, with the unemployment rate held at 4.1%, average hourly earnings accelerating to 0.3% MoM from 0.1% and decelerating to 3% YoY from 3.2%. Composite PMI is due Thursday at 13:45 GMT unchanged at 56, and jobless claims the same morning at 205K against 203K. The decision lands September 16, and with the front end already carrying two thirds of a hike, the earnings line on Friday matters more to this index than the headline count does.
Levels to watch
Resistance: The session high just above 53,200 is the first obstacle, with the 53,500 handle above it, a shelf that has capped every attempt since it broke last week. Beyond that sit the band just above 53,800, then 54,000, and the record just short of 54,750, roughly 3% overhead.
Support: The 53,000 handle is the floor this session reclaimed and the level bulls need to defend into Friday. Beneath it the rising 50-day EMA near 52,700 marks today's low and the line the entire August advance was built on, with 52,500 the next shelf. The 200-day EMA near 50,000 is nowhere in play.
Bias: Bullish while 52,700 holds, with objectives at the 53,500 handle and then 53,800. The daily Stochastic Relative Strength Index (Stoch RSI) near 34 has flattened in the lower half of its range rather than pressing lower, which fits a low made and defended. A daily close beneath 52,700 hands the tape back to the sellers and opens 52,000.
Dow Jones daily chart
Dow Jones FAQs
The Dow Jones Industrial Average, one of the oldest stock market indices in the world, is compiled of the 30 most traded stocks in the US. The index is price-weighted rather than weighted by capitalization. It is calculated by summing the prices of the constituent stocks and dividing them by a factor, currently 0.152. The index was founded by Charles Dow, who also founded the Wall Street Journal. In later years it has been criticized for not being broadly representative enough because it only tracks 30 conglomerates, unlike broader indices such as the S&P 500.
Many different factors drive the Dow Jones Industrial Average (DJIA). The aggregate performance of the component companies revealed in quarterly company earnings reports is the main one. US and global macroeconomic data also contributes as it impacts on investor sentiment. The level of interest rates, set by the Federal Reserve (Fed), also influences the DJIA as it affects the cost of credit, on which many corporations are heavily reliant. Therefore, inflation can be a major driver as well as other metrics which impact the Fed decisions.
Dow Theory is a method for identifying the primary trend of the stock market developed by Charles Dow. A key step is to compare the direction of the Dow Jones Industrial Average (DJIA) and the Dow Jones Transportation Average (DJTA) and only follow trends where both are moving in the same direction. Volume is a confirmatory criteria. The theory uses elements of peak and trough analysis. Dow’s theory posits three trend phases: accumulation, when smart money starts buying or selling; public participation, when the wider public joins in; and distribution, when the smart money exits.
There are a number of ways to trade the DJIA. One is to use ETFs which allow investors to trade the DJIA as a single security, rather than having to buy shares in all 30 constituent companies. A leading example is the SPDR Dow Jones Industrial Average ETF (DIA). DJIA futures contracts enable traders to speculate on the future value of the index and Options provide the right, but not the obligation, to buy or sell the index at a predetermined price in the future. Mutual funds enable investors to buy a share of a diversified portfolio of DJIA stocks thus providing exposure to the overall index.
Artigos Recomendados


