
Sei Price Forecast: SEI slips despite volume surge as Xiaomi partnership boosts adoption outlook
- Sei price dips on Thursday after retesting its weekly resistance at $0.150 the previous day.
- SEI gains a major adoption boost as Xiaomi will pre-install its crypto wallet app on new smartphones globally (excluding China & US).
- Trading volume jumps to 209.92 million, the highest since October 11, signaling heightened market participation.
Sei (SEI) price trades in red, below $0.137 at the time of writing on Thursday, after retesting its key resistance level the previous day. Despite the pullback, on-chain data and market sentiment remain bullish, supported by surging trading activity and SEI’s major partnership with Xiaomi, which strengthens the project’s global adoption outlook.
Sei expands to Xiaomi’s global user base with pre-installed app
Sei announced a partnership with Xiaomi on Wednesday to roll out a crypto wallet and discovery app that will be pre-installed on all new Xiaomi smartphones sold outside mainland China and the US, with plans to introduce stablecoin payments across Xiaomi’s growing retail network.
“The initial rollout of the app will prioritize regions with established crypto adoption, including Europe, Latin America, Southeast Asia, and Africa, where Xiaomi holds a significant market share,” said Sei on its blog post.
This news is broadly bullish for SEI in the long term, as the partnership could boost real-world adoption and expand its global user base. Meanwhile, Sei’s native token, SEI, reflected initial positive sentiment, rallying 5% on Wednesday, but struggled to sustain momentum as the broader crypto market softened after the Federal Open Market Committee (FOMC) meeting.
In a widely expected move, the US Federal Reserve (Fed) lowered interest rates at the end of its two-day policy meeting but signaled a likely pause in January. Adding to the cautious tone, policymakers projected only a one-quarter-percentage-point cut in 2026, the same outlook as in September, which tempered market expectations and contributed to short-term pressure on risk assets. At the time of writing on Thursday, SEI is trading down 6% at $0.137.
Trading volume hits a 2-month high
Santiment data indicate that the SEI ecosystem’s trading volume (the aggregate trading volume generated by all exchange applications on the chain) reached $209.92 billion on Thursday, the highest level since October 11. This volume rise indicates a surge in traders’ interest and liquidity in SEI, boosting its bullish outlook.
 [07-1765425206149-1765425206150.55.32, 11 Dec, 2025].png)
Sei Price Forecast: SEI could rally if it closes above the falling wedge pattern
Sei’s price trades within a falling wedge pattern (formed by connecting multiple highs and lows since mid-October). SEI price rallied 5% on Wednesday and retested the weekly resistance level at $0.150. This weekly level roughly aligns with the 50-day Exponential Moving Average (EMA) at $0.162 and the upper trendline, making it a key resistance zone. At the time of writing on Thursday, SEI is down nearly 6% and trading below $0.137.
If SEI breaks above the $0.150 and closes above the 50-day EMA at $0.162, it could extend the rally toward the next daily resistance level at $0.217.
The Relative Strength Index (RSI) is at 45, below its neutral 50 level, indicating bearish momentum. However, the Moving Average Convergence Divergence (MACD) showed a bullish crossover at the end of November, which remains intact, supporting a bullish view.
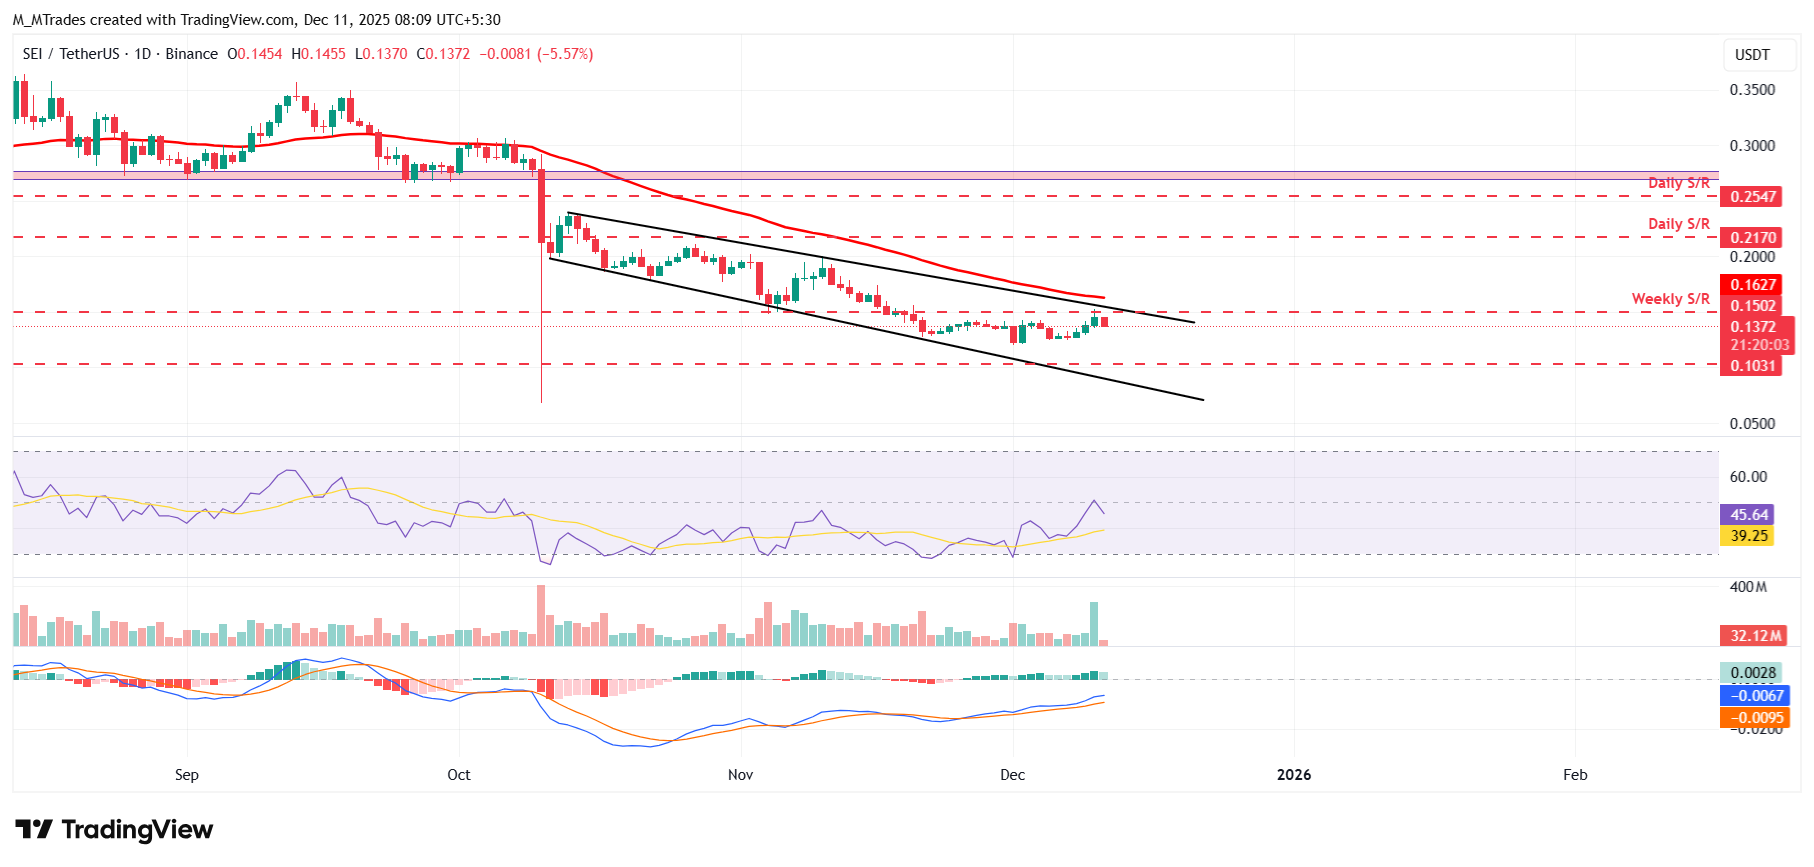
However, if SEI faces a correction, it could extend the decline toward the next weekly support at $0.103.
Artigos Recomendados


