

Silver Price Analysis: XAG/USD bears have the upper hand, 50-day SMA breakdown in play
- Silver remains depressed below the 50-day SMA for the second straight day on Monday.
- The technical setup favors bearish traders and supports prospects for additional losses.
- Weakness below the $31.00 mark should pave the way for a slide to the 100-day SMA.
Silver (XAG/USD) trades with a negative bias for the second straight day on Monday, albeit it lacks follow-through selling and manages to hold above the $31.00 mark through the Asian session. The white metal, meanwhile, remains close to over a three-week low touched last Wednesday and seems vulnerable to prolonging its recent corrective decline from a 12-year peak.
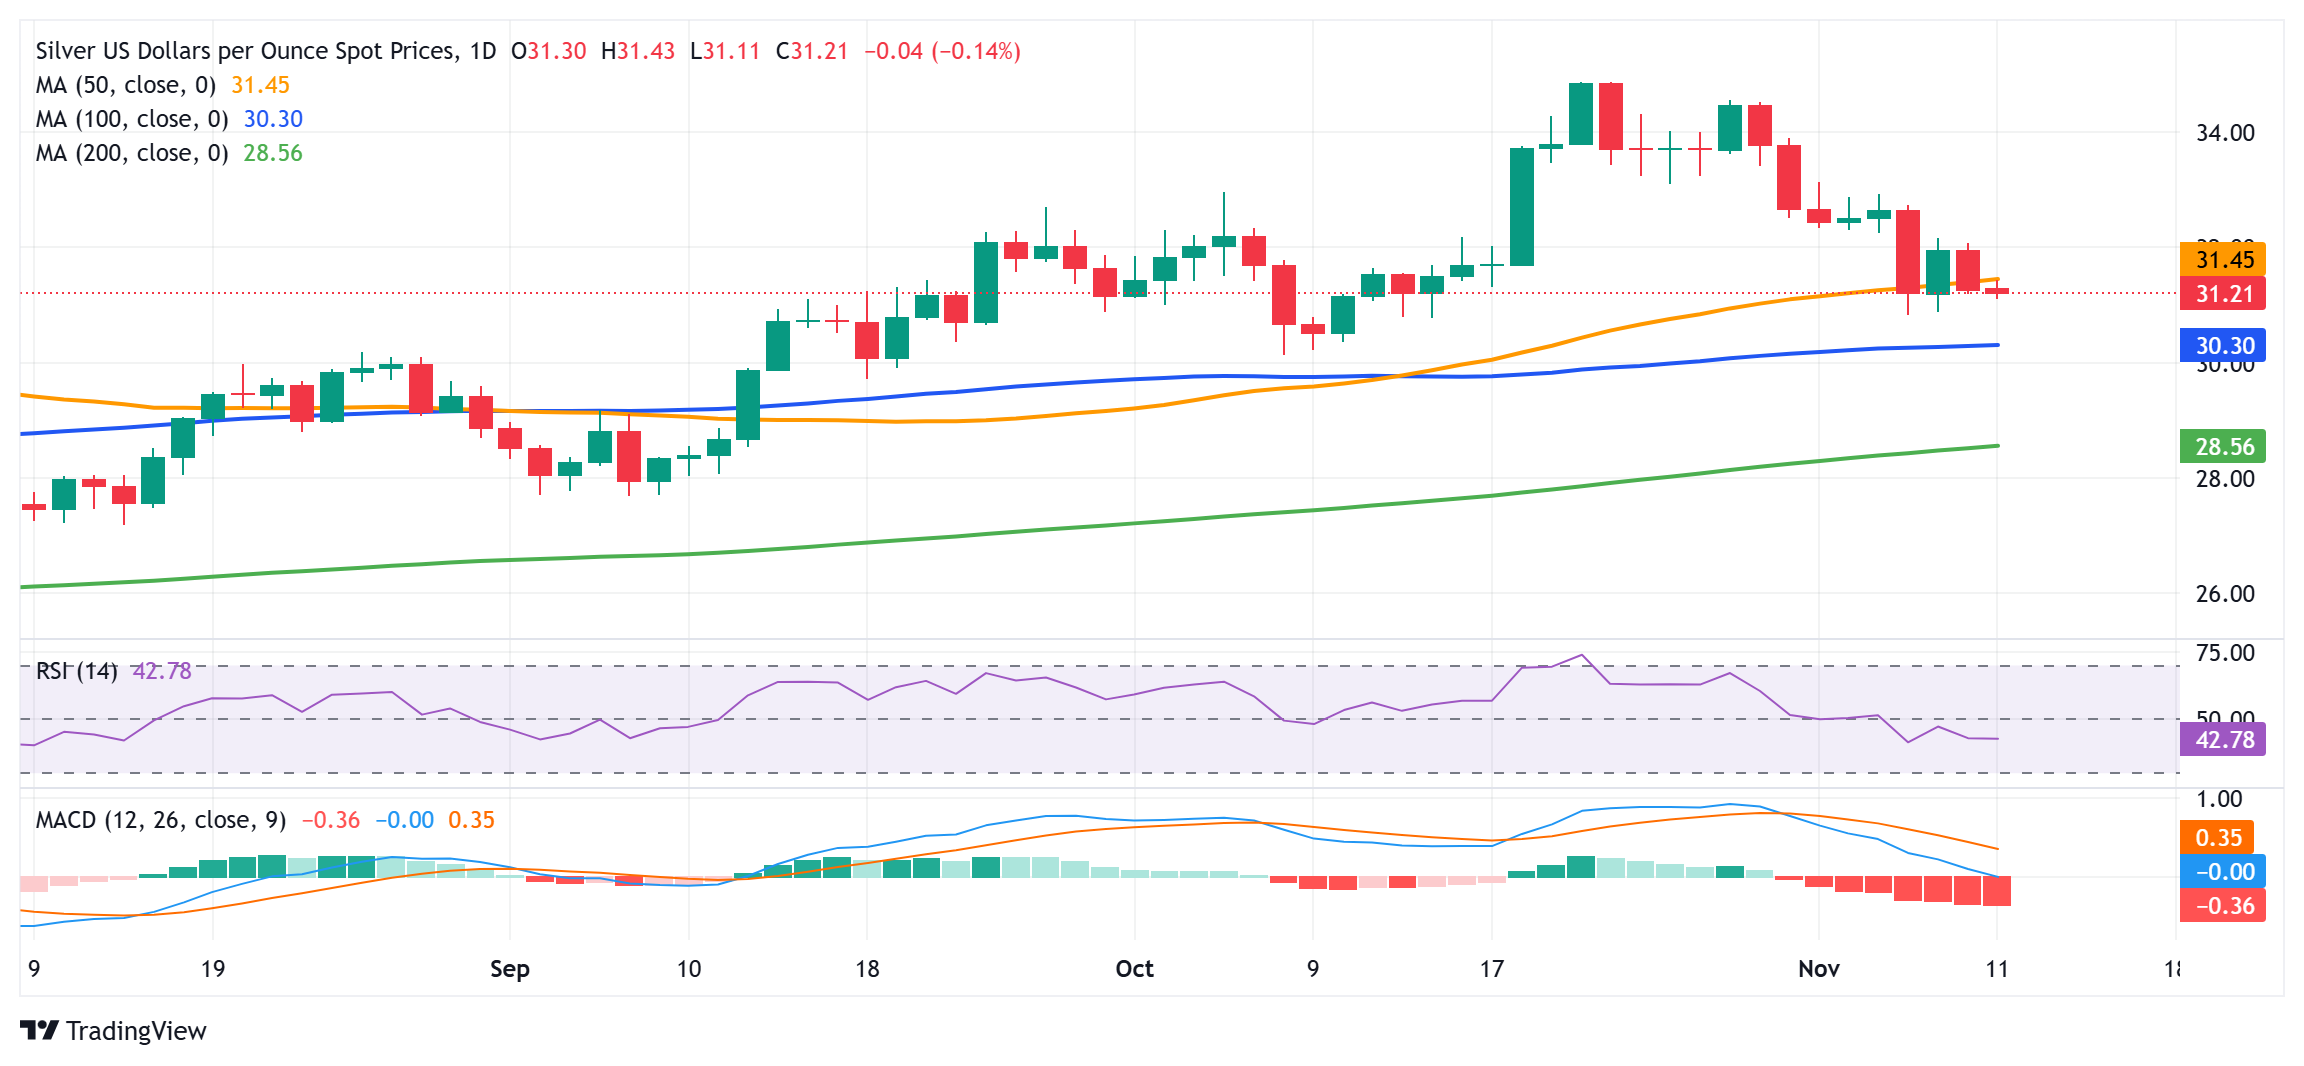
From a technical perspective, acceptance below the 50-day Simple Moving Average (SMA) validates the bearish outlook. Adding to this, oscillators on the daily chart have been gaining negative traction and suggest that the path of least resistance for the XAG/USD is to the downside. That said, it will still be prudent to wait for some follow-through selling below the $31.00 mark before positioning for a slide towards testing the 100-day SMA, currently pegged near the $30.35 region.
This is followed by the $30.00 psychological mark, below which the XAG/USD could accelerate the fall toward the next relevant support near the $29.50-$29.45 area. The downward trajectory could extend further towards the $29.00 mark en route to the very important 200-day SMA, currently around the $28.70-$28.65 region.
On the flip side, the $32.00 round figure now seems to have emerged as an immediate strong hurdle, above which the XAG/USD could climb to the $32.35-$32.40 supply zone. A sustained strength beyond might trigger a short-covering move and lift the white metal to the $33.00 mark. The positive momentum could extend further towards the next relevant barrier near the mid-$33.00s.
Silver daily chart
Silver FAQs
Silver is a precious metal highly traded among investors. It has been historically used as a store of value and a medium of exchange. Although less popular than Gold, traders may turn to Silver to diversify their investment portfolio, for its intrinsic value or as a potential hedge during high-inflation periods. Investors can buy physical Silver, in coins or in bars, or trade it through vehicles such as Exchange Traded Funds, which track its price on international markets.
Silver prices can move due to a wide range of factors. Geopolitical instability or fears of a deep recession can make Silver price escalate due to its safe-haven status, although to a lesser extent than Gold's. As a yieldless asset, Silver tends to rise with lower interest rates. Its moves also depend on how the US Dollar (USD) behaves as the asset is priced in dollars (XAG/USD). A strong Dollar tends to keep the price of Silver at bay, whereas a weaker Dollar is likely to propel prices up. Other factors such as investment demand, mining supply – Silver is much more abundant than Gold – and recycling rates can also affect prices.
Silver is widely used in industry, particularly in sectors such as electronics or solar energy, as it has one of the highest electric conductivity of all metals – more than Copper and Gold. A surge in demand can increase prices, while a decline tends to lower them. Dynamics in the US, Chinese and Indian economies can also contribute to price swings: for the US and particularly China, their big industrial sectors use Silver in various processes; in India, consumers’ demand for the precious metal for jewellery also plays a key role in setting prices.
Silver prices tend to follow Gold's moves. When Gold prices rise, Silver typically follows suit, as their status as safe-haven assets is similar. The Gold/Silver ratio, which shows the number of ounces of Silver needed to equal the value of one ounce of Gold, may help to determine the relative valuation between both metals. Some investors may consider a high ratio as an indicator that Silver is undervalued, or Gold is overvalued. On the contrary, a low ratio might suggest that Gold is undervalued relative to Silver.
Artigos Recomendados


