


Gold pulls back to $2,500 as USD recovers
- Gold is correcting back as the US Dollar recovers from year-to-date lows.
- Mixed US economic data is making the market cautious about whether the Fed will cut by 0.50% in September.
- The heavy long positioning in Gold is a further headwind for bulls trying to push the price higher.
Gold (XAU/USD) exchanges hands just above $2,500 on Wednesday after sliding lower due to a rebound in the US Dollar (USD). Given Gold is mainly priced in USD, any strength in the Greenback tends to weigh on its price. The US Dollar Index (DXY) is up over a third of a percent in the 100.90s on Wednesday, rebounding from the 100.51 year-to-date lows touched on the previous day.
US data was mixed on Tuesday, with the Conference Board’s gauge of Consumer Confidence in August rising to 103.3 and beating expectations of 100.7. The optimism coming from the US consumer provided further evidence against a hard-landing scenario for the US economy. Labor market indicators, however, “fell to their weakest levels so far in this cycle, which supported concerns about the recent slowdown in the labor market,” according to Jim Reid, a strategist at Deutsche Bank.
Gold pulls back as concerns over the US economy moderate
Gold is moving lower on Wednesday as data out over the last few days paints a mixed picture of the state of the US economy. The Richmond Fed Manufacturing Index came in at -19 in August from -17 previously, when an improvement to -14 had been forecast. US housing data was mixed, meanwhile, with house prices falling 0.1% MoM in June against expectations of a 0.2% rise, but the S&P/Case-Schiller House Price Index revealing a 6.5% rise year-over-year against the 6.0% estimated.
The data follows better-than-expected US Durable Goods Orders numbers on Monday, which showed a sharp 9.9% rise in July – the highest reading since May 2020, and helped reassure investors about the US economy.
Despite these releases, the market’s expectations for the trajectory of US interest rates appears little changed. The probability of the Fed making a mega 0.50% interest rate cut in September remains at mid-30%, according to the CME FedWatch Tool. This is around where it was after Federal Reserve (Fed) Chairman Jerome Powell made the clearest signal yet that cuts were in the pipeline at his speech in Jackson Hole. That said, 3-month US Treasury yields are rising on Wednesday whilst longer maturity bond yields are edging lower, which could suggest bond traders are not confident the Fed will go for a mega 0.50% cut. Such a move, if it were to transpire, would benefit Gold, which as a non-interest paying asset tends to see gains the more interest rates fall.
Traders now look to the Fed’s favored gauge of inflation, the Personal Consumption Expenditures (PCE) Price Index, out on Friday, for a clearer steer of where the Fed could be going on interest rates. Thursday’s second estimate of the US Gross Domestic Product (GDP) data for Q2 could impact expectations, whilst on Wednesday the slim docket provides only commentary from Atlanta Fed President Raphael Bostic. Nvidia (NVDA) earnings will be released after hours.
Extreme long positioning continues to be a problem for Gold bulls trying to hike up the price, according to Daniel Ghali, Senior Commodity Strategist at TD Securities.
“Our gauge of macro fund positioning in Gold is now at the highest levels recorded in the depths of the pandemic. This red flag marked the local highs set in Sep 2019, and previously in July 2016,” says Ghali.
“Downside risks are now more potent. The ship is crowded. In fact, it has scarcely been as crowded as it is today. Do you have a slot secured on the lifeboat?” adds the strategist.
Technical Analysis: Gold falls back after retesting the $2,530 highs
Gold (XAU/USD) is falling back down after retesting the $2,530 level. Overall, it remains inside a consolidation above its old range. Despite the recent pause, Gold remains in a short-term uptrend, which given “the trend is your friend” favors longs over shorts.
XAU/USD 4-hour Chart
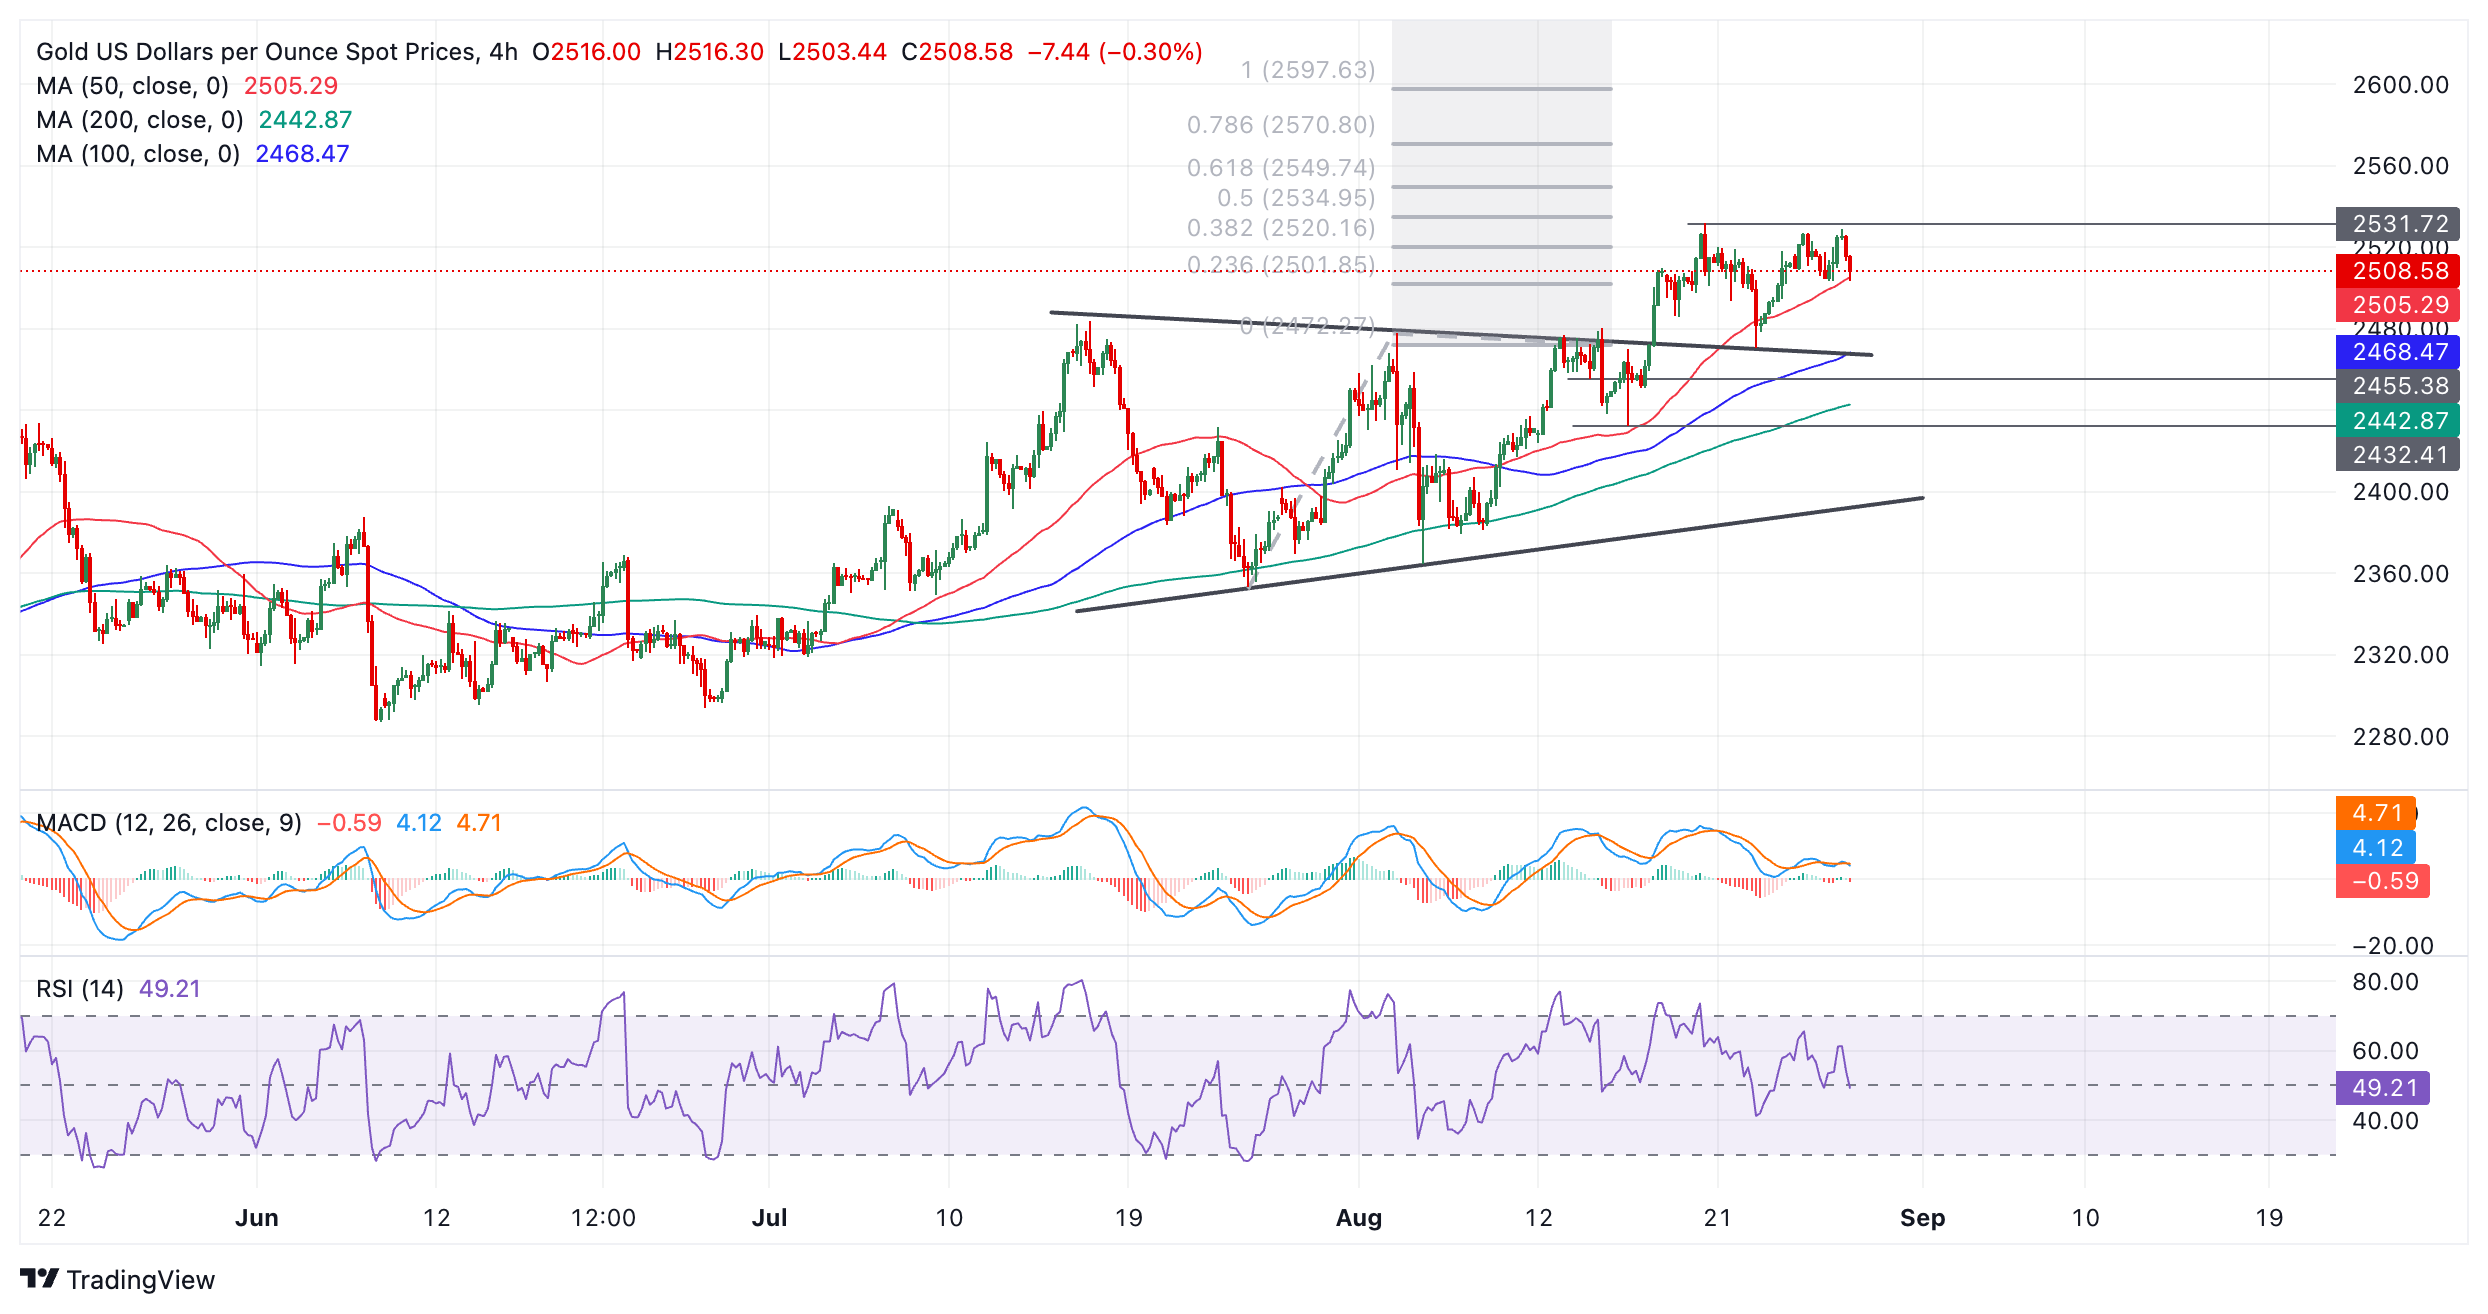
The breakout of the range (which resembles an incomplete triangle pattern), took place on August 14 and generated an upside target at roughly $2,550. This was calculated by taking the 0.618 Fibonacci ratio of the range’s height and extrapolating it higher. This target is the minimum expectation for a follow-through after a breakout based on principles of technical analysis.
A break above the $2,531 August 20 all-time high would provide confirmation of a continuation higher towards the $2,550 target.
Alternatively, a break back inside the range would negate the upside projected target. Such a move would be confirmed on a daily close below $2,470 (August 22 low). It would change the picture for Gold and bring the short-term uptrend into doubt.
Gold is in a broad uptrend on medium and long-term time frames, however, which further supports an overall bullish outlook for the precious metal.
Economic Indicator
Consumer Confidence
The Consumer Confidence index, released on a monthly basis by the Conference Board, is a survey gauging sentiment among consumers in the United States, reflecting prevailing business conditions and likely developments for the months ahead. The report details consumer attitudes, buying intentions, vacation plans and consumer expectations for inflation, labor market, stock prices and interest rates. The data shows a picture of whether or not consumers are willing to spend money, a key factor as consumer spending is a major driver of the US economy. Generally, a high reading is bullish for the US Dollar (USD), while a low reading is bearish. Note: Because of restrictions from the Conference Board, FXStreet Economic Calendar does not provide this indicator's figures.
Read more.Last release: Tue Aug 27, 2024 14:00
Frequency: Monthly
Actual: -
Consensus: -
Previous: -
Source: Conference Board
Artigos Recomendados


