

EUR/JPY Price Forecast: Seems poised to test 162.20-162.25 confluence hurdle
- EUR/JPY gains some follow-through traction and recovers further from a near one-month low.
- BoJ rate hike uncertainty and the risk-on mood undermine the JPY and support spot prices.
- The ECB’s dovish bias might hold back the Euro bulls from placing fresh bets and cap gains.
The EUR/JPY cross builds on the overnight recovery from the 160.00 psychological mark, or a nearly one-month low and attracts some follow-through buyers on Tuesday. Spot prices stick to positive bias through the first half of the European session and currently trade around the 161.75-161.80 region, up nearly 0.45% for the day.
Against the backdrop of the uncertainty surrounding the likely timing of the next rate hike by the Bank of Japan (BoJ), the risk-on mood undermines the safe-haven Japanese Yen (JPY) and lends support to the EUR/JPY cross. Apart from this, a modest US Dollar (USD) downtick benefits the shared currency and contributes to the intraday move up. That said, the European Central Bank's (ECB) dovish bias might cap the Euro and the currency pair.
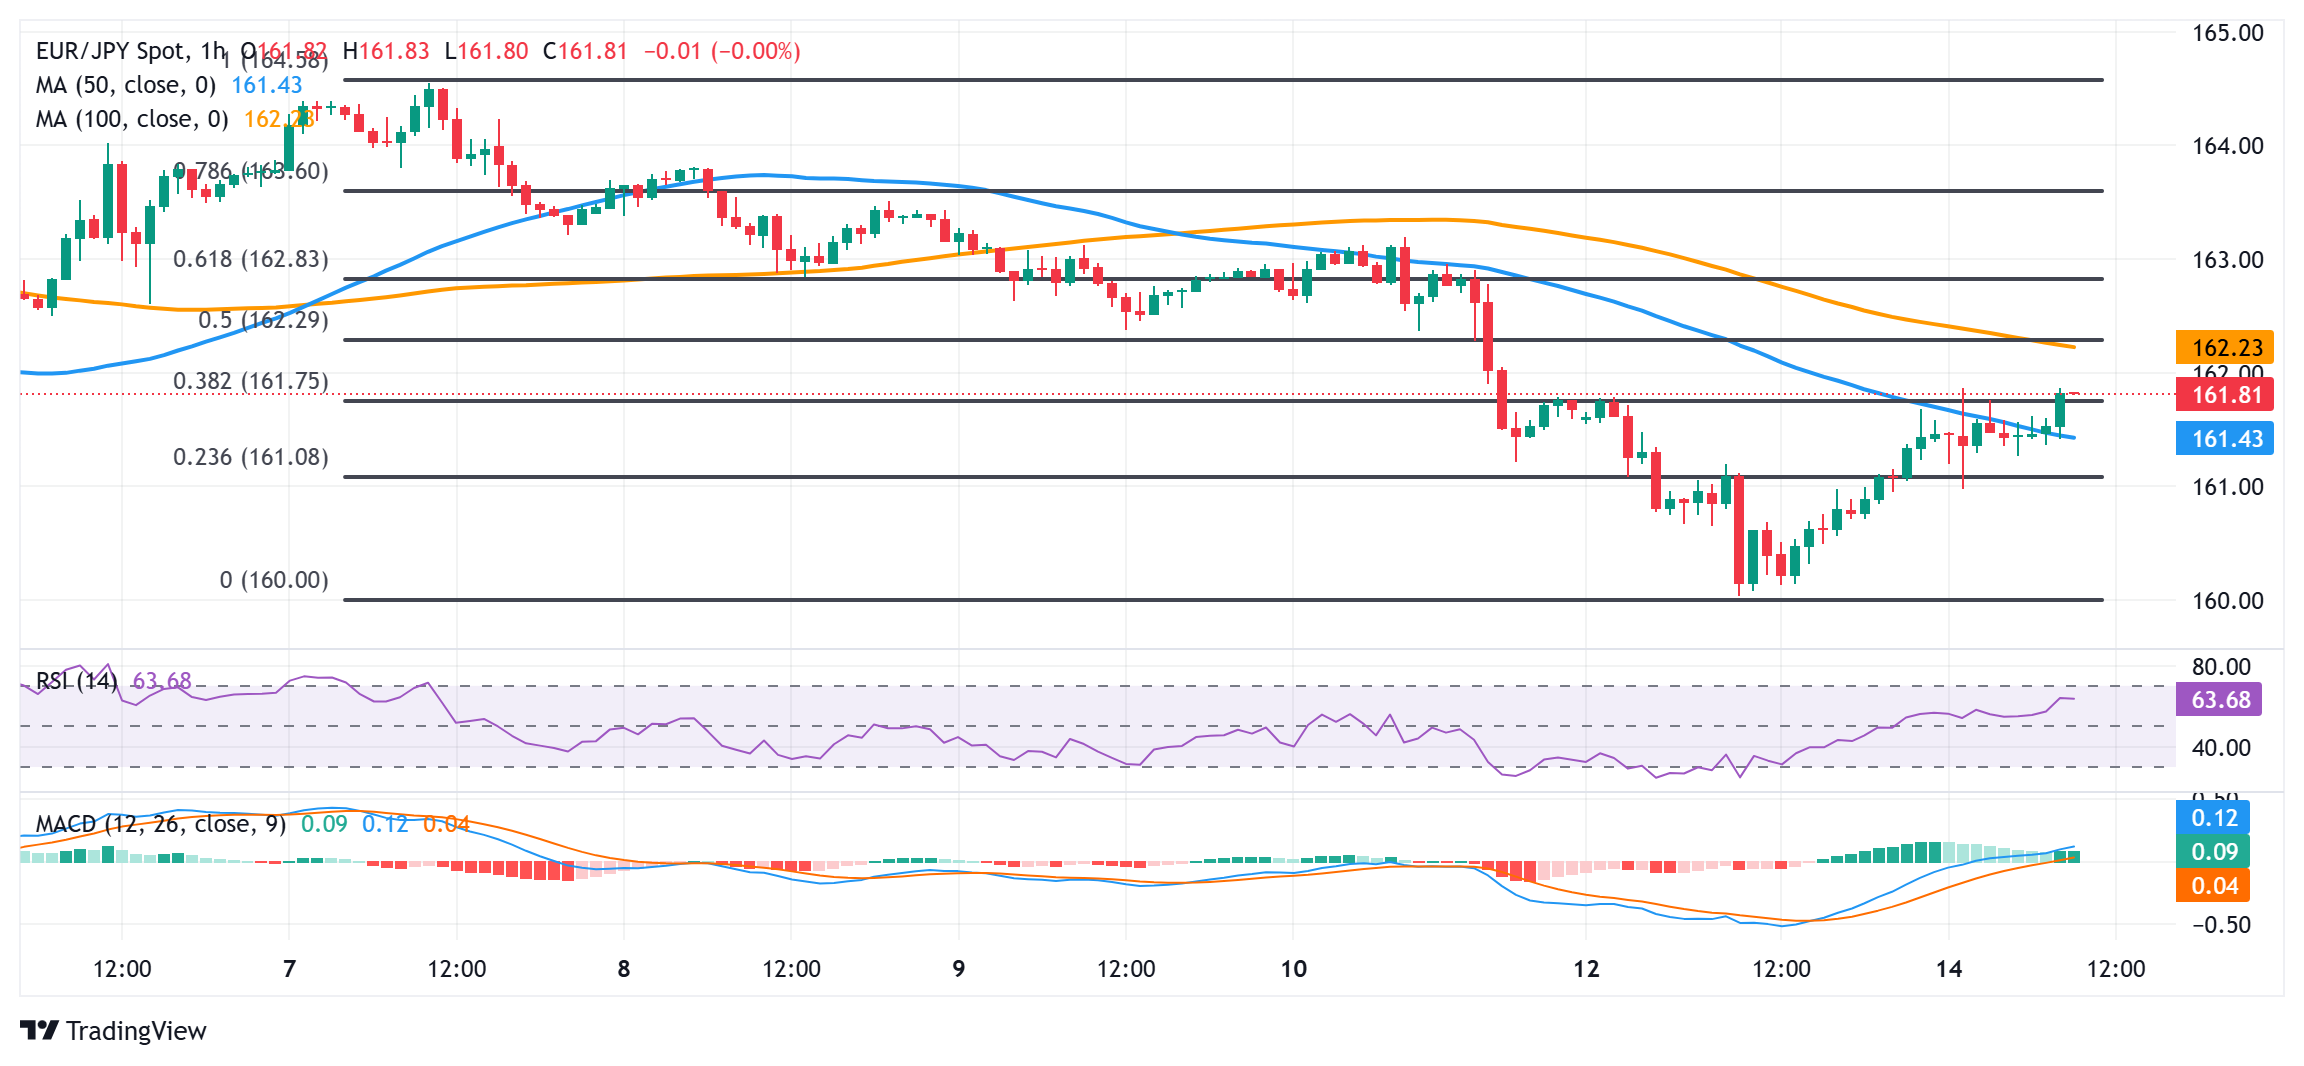
From a technical perspective, strength beyond the 50-hour Simple Moving Average (SMA) and the 38.2% Fibonacci retracement level of the downfall witnessed over the past week or so favors bullish traders. Moreover, positive oscillators on the 1-hour chart support prospects for additional intraday gains. Hence, a move beyond the 162.00 mark, towards testing the 100-hour SMA and the 50% Fibo. level confluence near the 162.25 area, looks like a distinct possibility.
On the flip side, weakness below the 161.50 area, or the 50-hour SMA, could be seen as a buying opportunity and remain limited near the 161.00 round-figure mark (23.6% Fibo. level). A convincing break below the latter could make the EUR/JPY cross vulnerable to accelerate the slide back towards the 160.00 mark, with some intermediate support near the 160.60-160.55 region. The downfall could extend further towards the 159.50 support zone.
EUR/JPY 1-hour chart
Japanese Yen FAQs
The Japanese Yen (JPY) is one of the world’s most traded currencies. Its value is broadly determined by the performance of the Japanese economy, but more specifically by the Bank of Japan’s policy, the differential between Japanese and US bond yields, or risk sentiment among traders, among other factors.
One of the Bank of Japan’s mandates is currency control, so its moves are key for the Yen. The BoJ has directly intervened in currency markets sometimes, generally to lower the value of the Yen, although it refrains from doing it often due to political concerns of its main trading partners. The BoJ ultra-loose monetary policy between 2013 and 2024 caused the Yen to depreciate against its main currency peers due to an increasing policy divergence between the Bank of Japan and other main central banks. More recently, the gradually unwinding of this ultra-loose policy has given some support to the Yen.
Over the last decade, the BoJ’s stance of sticking to ultra-loose monetary policy has led to a widening policy divergence with other central banks, particularly with the US Federal Reserve. This supported a widening of the differential between the 10-year US and Japanese bonds, which favored the US Dollar against the Japanese Yen. The BoJ decision in 2024 to gradually abandon the ultra-loose policy, coupled with interest-rate cuts in other major central banks, is narrowing this differential.
The Japanese Yen is often seen as a safe-haven investment. This means that in times of market stress, investors are more likely to put their money in the Japanese currency due to its supposed reliability and stability. Turbulent times are likely to strengthen the Yen’s value against other currencies seen as more risky to invest in.
Artigos Recomendados


