USD/JPY Price Analysis: Extends gains but remains below 156.00

Fonte Fxstreet
  • USD/JPY maintains uptrend, trading at 155.66 after hitting a daily low of 155.25.
  • Technical outlook suggests further gains with resistance at 156.05, 157.00, and YTD high at 160.32.
  • Key support levels include 155.18, 155.00, and May 16 low at 153.60 if price drops below 155.69.

The USD/JPY extended its gains late on Friday’s North American session, though it’s set to finish the week unchanged. The major trades at 155.66, up 0.18% after hitting a daily low of 155.25.

USD/JPY Price Analysis: Technical outlook

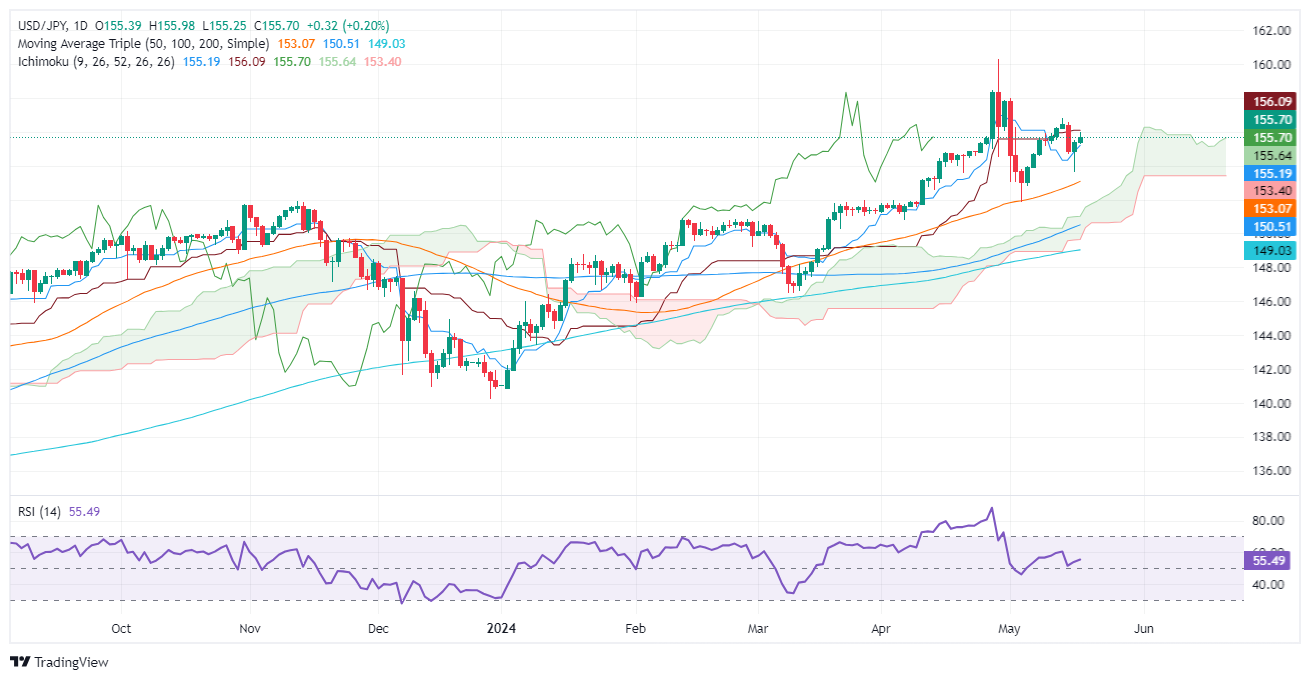
Despite the conditions to extend their gains, traders should be aware of the Japanese authority's intervention threats. That said, the USD/JPY uptrend remains intact as long as price action achieves two goals: persisting above the Ichimoku Cloud (Kumo) and staying above the uptrend trendline drawn from the January 2024 lows.

The Relative Strength Index (RSI) favors buyers, standing above the 50-midline with enough room to spare before reaching overbought territory.

Therefore, the path of least resistance is upwards. The first resistance would be the Kijun-Sen at 156.05. Once cleared, the next stop would be 157.00, followed by the April 26 high of 158.44, ahead of challenging the year-to-date (YTD) high at 160.32.

On the flip side, if USD/JPY drops below the Senkou Span A of 155.69, the pair could be headed towards retesting lower support levels. Bulls' first line of defense would be the Tenkan-Sen at 155.18, followed by 155.00. Once hurdled, the next stop would be the May 16 low of 153.60, followed by the Sekou Span B at 153.06.

USD/JPY Price Action – Daily Chart
USD/JPY

Overview
Today last price 155.69
Today Daily Change 0.30
Today Daily Change % 0.19
Today daily open 155.39
 
Trends
Daily SMA20 155.37
Daily SMA50 152.9
Daily SMA100 150.36
Daily SMA200 148.98
 
Levels
Previous Daily High 155.54
Previous Daily Low 153.6
Previous Weekly High 155.95
Previous Weekly Low 152.8
Previous Monthly High 160.32
Previous Monthly Low 150.81
Daily Fibonacci 38.2% 154.8
Daily Fibonacci 61.8% 154.34
Daily Pivot Point S1 154.15
Daily Pivot Point S2 152.91
Daily Pivot Point S3 152.21
Daily Pivot Point R1 156.08
Daily Pivot Point R2 156.78
Daily Pivot Point R3 158.02


Japanese Yen PRICE Today

The table below shows the percentage change of Japanese Yen (JPY) against listed major currencies today. Japanese Yen was the strongest against the Swiss Franc.

  USD EUR GBP JPY CAD AUD NZD CHF
USD   -0.02% -0.25% 0.19% -0.04% -0.24% -0.23% 0.30%
EUR 0.02%   -0.24% 0.22% -0.01% -0.20% -0.19% 0.30%
GBP 0.25% 0.24%   0.44% 0.22% 0.04% 0.03% 0.53%
JPY -0.19% -0.22% -0.44%   -0.26% -0.43% -0.45% 0.09%
CAD 0.04% 0.01% -0.22% 0.26%   -0.19% -0.18% 0.33%
AUD 0.24% 0.20% -0.04% 0.43% 0.19%   0.00% 0.51%
NZD 0.23% 0.19% -0.03% 0.45% 0.18% -0.01%   0.51%
CHF -0.30% -0.30% -0.53% -0.09% -0.33% -0.51% -0.51%  

The heat map shows percentage changes of major currencies against each other. The base currency is picked from the left column, while the quote currency is picked from the top row. For example, if you pick the Japanese Yen from the left column and move along the horizontal line to the US Dollar, the percentage change displayed in the box will represent JPY (base)/USD (quote).


Isenção de responsabilidade: Apenas para fins informativos. O desempenho passado não é indicativo de resultados futuros.
placeholder
Ações da Oi (OIBR3) disparam com suspensão de falência; Dasa (DASA3) também sobe 19% com balançoAs ações da Oi (OIBR3; OIBR4) voltaram a ser negociadas na tarde desta sexta-feira (14) e fecharam em forte alta, após a Justiça do Rio de Janeiro suspender o decreto de falência da companhia, que havia sido proferido na última segunda-feira (10).
Autor  Pedro Augusto Prazeres
11 Mês 17 Dia Seg
As ações da Oi (OIBR3; OIBR4) voltaram a ser negociadas na tarde desta sexta-feira (14) e fecharam em forte alta, após a Justiça do Rio de Janeiro suspender o decreto de falência da companhia, que havia sido proferido na última segunda-feira (10).
placeholder
Ethereum (ETH) cai 20% em novembro e testa US$ 3.000; indicador aponta 'zona de compra' históricaO Ether (ETH), token nativo da rede Ethereum, registrou uma queda de quase 20% ao longo do mês de novembro. O ativo saiu da casa dos US$ 3.900 para retestar o nível psicológico de US$ 3.000 no dia 17 de novembro.
Autor  Pedro Augusto Prazeres
Ontem 02: 08
O Ether (ETH), token nativo da rede Ethereum, registrou uma queda de quase 20% ao longo do mês de novembro. O ativo saiu da casa dos US$ 3.900 para retestar o nível psicológico de US$ 3.000 no dia 17 de novembro.
placeholder
A Semrush se une à Adobe para impulsionar a próxima geração de marketing generativo com IA.A Adobe adquire a Semrush por US$ 1,9 bilhão, integrando ferramentas de SEO e marketing com inteligência artificial para aumentar a visibilidade da marca em plataformas digitais e baseadas em IA.
Autor  Cryptopolitan
8 horas atrás
A Adobe adquire a Semrush por US$ 1,9 bilhão, integrando ferramentas de SEO e marketing com inteligência artificial para aumentar a visibilidade da marca em plataformas digitais e baseadas em IA.
placeholder
Bitcoin (BTC) cai com ata do Fed; "Medo Extremo" e capitulação podem sinalizar fundoO Bitcoin (BTC) aprofundou sua correção nesta quarta-feira (19), caindo para baixo do patamar de US$ 89.000 e atingindo sua mínima em sete meses. O movimento de aversão ao risco foi intensificado pela divulgação das atas da reunião do Federal Reserve (Fed) realizada em 28 e 29 de outubro.
Autor  Pedro Augusto Prazeres
7 horas atrás
O Bitcoin (BTC) aprofundou sua correção nesta quarta-feira (19), caindo para baixo do patamar de US$ 89.000 e atingindo sua mínima em sete meses. O movimento de aversão ao risco foi intensificado pela divulgação das atas da reunião do Federal Reserve (Fed) realizada em 28 e 29 de outubro.
placeholder
Ibovespa cai antes do feriado; dólar sobe a R$ 5,33 com cautela e queda do petróleoO Ibovespa encerrou esta quarta-feira (19) em queda de 0,73%, aos 155.380,66 pontos, registrando uma perda de mais de 1.100 pontos. O movimento marca a terceira baixa consecutiva do índice, uma sequência negativa que não era vista desde o início de outubro.
Autor  Pedro Augusto Prazeres
6 horas atrás
O Ibovespa encerrou esta quarta-feira (19) em queda de 0,73%, aos 155.380,66 pontos, registrando uma perda de mais de 1.100 pontos. O movimento marca a terceira baixa consecutiva do índice, uma sequência negativa que não era vista desde o início de outubro.
Produtos relacionados
goTop
quote