
GBP/USD slips as Dollar rebounds, traders await UK and US CPI data
- GBP/USD dives as DXY hits a three-day high amid light data flow during the US government shutdown.
- UK borrowing came in lower than expected, but Reeves hints at tax hikes and spending cuts.
- Traders brace for UK CPI; a soft print could revive bets on BoE rate cuts.
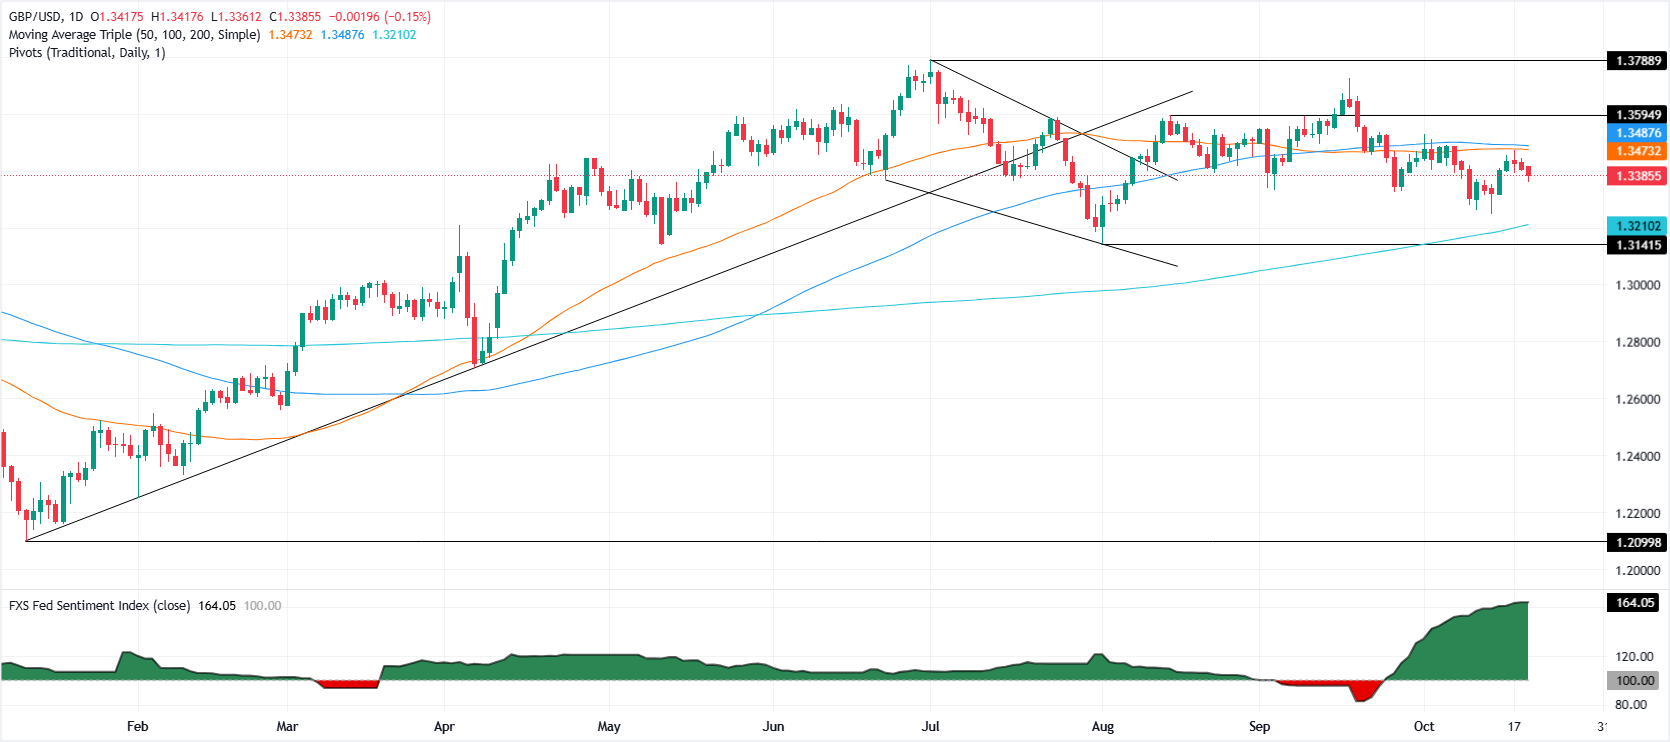
GBP/USD tumbles during the North American session, down over 0.17% as the Greenback stages a recovery, hitting a three day high according to the US Dollar Index (DXY). at the time of writing, the pair trades at 1.3384 after reaching a high of 1.3416.
Sterling weakens below 1.34 as fiscal tightening looms in Britain
A scarce economic docket triggered by the government shutdown in the US, keeps traders leaning on social media posts or comments by US President Donald Trump. In addition, the release of the latest Consumer Price Index (CPI) figures in the US on October 24th, keeps price action subdued.
Meanwhile, in the UK, Public Sector Net Borrowing in September, the government borrowed 20.2 billion Sterling, lower than the median forecast of 20.8 billion pound deficit expected by analysts.
The UK’s Chancellor Rachel Reevs hinted that she would raise taxes and cut spending, in order to remain in course to meet her fiscal targets.
Reeves has signaled that she will raise taxes and cut spending as she tries to stay on course to meet fiscal targets and avoid upsetting investors who have already pushed up British borrowing costs sharply. Last week, she made comments that she would like to have a bigger fiscal buffer to maneuver amidst global financial markets, adding that creating one in the November 26 budget would require some trade-offs.
In the meantime, traders are eyeing the release of UK inflation data on Wednesday. Estimates suggest that CPI will rise from 3.8% to 4% in September, but a miss on the marks, could open the door for the Bank of England to resume its easing cycle.
GBP/USD Price Chart – Daily
Pound Sterling Price This week
The table below shows the percentage change of British Pound (GBP) against listed major currencies this week. British Pound was the strongest against the Japanese Yen.
| USD | EUR | GBP | JPY | CAD | AUD | NZD | CHF | |
|---|---|---|---|---|---|---|---|---|
| USD | 0.47% | 0.36% | 0.83% | -0.02% | -0.12% | -0.16% | 0.41% | |
| EUR | -0.47% | -0.11% | 0.46% | -0.49% | -0.49% | -0.69% | -0.04% | |
| GBP | -0.36% | 0.11% | 0.30% | -0.38% | -0.38% | -0.58% | 0.05% | |
| JPY | -0.83% | -0.46% | -0.30% | -0.91% | -0.99% | -1.08% | -0.52% | |
| CAD | 0.02% | 0.49% | 0.38% | 0.91% | -0.06% | -0.21% | 0.43% | |
| AUD | 0.12% | 0.49% | 0.38% | 0.99% | 0.06% | -0.21% | 0.40% | |
| NZD | 0.16% | 0.69% | 0.58% | 1.08% | 0.21% | 0.21% | 0.64% | |
| CHF | -0.41% | 0.04% | -0.05% | 0.52% | -0.43% | -0.40% | -0.64% |
The heat map shows percentage changes of major currencies against each other. The base currency is picked from the left column, while the quote currency is picked from the top row. For example, if you pick the British Pound from the left column and move along the horizontal line to the US Dollar, the percentage change displayed in the box will represent GBP (base)/USD (quote).
Artigos Recomendados


