
Australian Dollar declines following employment data release
- Australian Dollar loses ground as domestic Employment Change prints 14.9K, missing expectations of 17K.
- Australia’s Unemployment Rate climbed to 4.5% in September, from 4.3% in August.
- The US Dollar loses ground as traders adopt caution due to ongoing US-China trade tensions.
The Australian Dollar (AUD) declines against the US Dollar (USD) on Thursday, retracing its recent gains from the previous session. The AUD/USD pair loses ground as the AUD struggles following the release of Australia’s employment data.
The Australian Bureau of Statistics (ABS) reported on Thursday that the Employment Change came in at 14.9K in September, against the market expectations of 17K. The previous reading was -11.8K (revised from -5.4K). Meanwhile, the Unemployment Rate rose to 4.5% from 4.3% in August (revised from 4.2%). The figure came in above the market consensus of 4.3%.
The AUD received support from the cautious remarks from the Reserve Bank of Australia (RBA) Assistant Governor Sarah Hunter, who said on Wednesday that recent data has been a little stronger than expected, adding that inflation is likely to be stronger than forecast in the third quarter (Q3). Hunter highlighted that uncertainty about the global outlook remains elevated and stated that the board will adjust policy as appropriate as new information comes to hand. Expected consumer momentum to soften a little in Q3, she added.
US Dollar declines as traders adopt caution due to US-China feud
- The US Dollar Index (DXY), which measures the value of the US Dollar against six major currencies, is extending its losses for the third successive session and trading around 98.50 at the time of writing. The US Dollar continues to weaken as traders adopt caution amid escalating United States (US)-China trade tensions, the world’s two largest economies.
- US President Donald Trump said on Wednesday that he saw the US as in a trade war with China, even as Treasury Secretary Scott Bessent proposed a longer pause on high tariffs on Chinese goods to resolve a conflict over critical minerals.
- The Greenback faced challenges after US Federal Reserve (Fed) Chair Jerome Powell stated on Tuesday that the central bank is on track to deliver another quarter-point interest-rate reduction later this month, even as a government shutdown significantly reduces its read on the economy. Powell highlighted the low pace of hiring and noted that it may weaken further.
- The CME FedWatch Tool indicates that markets are now pricing in nearly a 98% chance of a Fed rate cut in October and a 93% possibility of another reduction in December.
- China’s Consumer Price Index (CPI) declined 0.3% year-over-year (YoY) in September. The market consensus was for a 0.1% decline in the reported period, following a fall of 0.4% in August. Meanwhile, the monthly inflation rose to 0.1%, weaker than the expected 0.2%. China’s Producer Price Index (PPI) fell 2.3% YoY, following a 2.9% fall prior, as expected.
- China's Trade Balance arrived at CNY645.47 billion in September, narrowing from the previous figure of CNY732.7 billion. Exports rose 8.4% YoY in September vs. 4.8% in July. The country’s imports advanced 7.5% YoY in the same period vs. 1.7% recorded previously. In US Dollar (USD) terms, China’s Trade Surplus came at $90.45 billion, expanded less than expected $98.96 billion in September, and was down from the previous $102.33.
- The RBA Minutes of its September monetary policy meeting showed on Monday that board members agreed that policy was still a little restrictive but difficult to determine. The RBA Meeting Minutes also noted that economic risks persist, with consumption remaining weak amid softer job and wage growth. Monthly CPI data for housing and services suggest that Q3 inflation may exceed forecasts. The RBA board emphasized that future policy decisions will continue to be cautious and strongly driven by incoming data.
Australian Dollar hovers around 0.6500 as bearish bias prevails
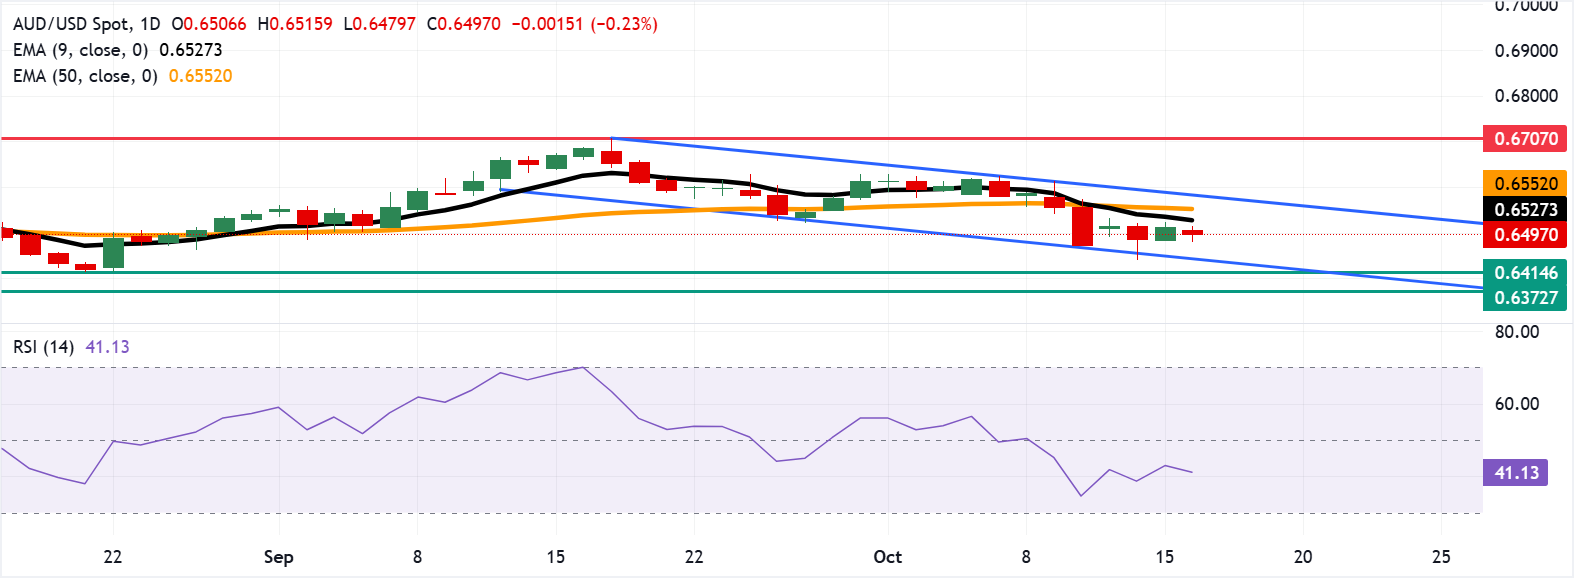
The AUD/USD pair is trading around 0.6500 on Thursday. Technical analysis on the daily chart suggests an ongoing bearish bias as the pair is remaining within a descending channel pattern. Additionally, the 14-day Relative Strength Index (RSI) is still positioned below the 50 level, strengthening the bearish bias.
On the downside, the AUD/USD pair may target the lower boundary of the descending channel around 0.6440. Further declines below the channel would reinforce the bearish bias and prompt the pair to test the four-month low of 0.6414, recorded on August 21, followed by the five-month low of 0.6372.
The AUD/USD pair may test the initial barrier at the nine-day Exponential Moving Average (EMA) of 0.6527, followed by the 50-day EMA at 0.6552. A break above these levels would improve the short- and medium-term price momentum and lead the pair to test the descending channel’s upper boundary around 0.6590. Further advances above the channel would cause the emergence of the bullish bias and support the pair to explore the region around the 12-month high of 0.6707, recorded on September 17.
AUD/USD: Daily Chart
Australian Dollar Price Today
The table below shows the percentage change of Australian Dollar (AUD) against listed major currencies today. Australian Dollar was the weakest against the Swiss Franc.
| USD | EUR | GBP | JPY | CAD | AUD | NZD | CHF | |
|---|---|---|---|---|---|---|---|---|
| USD | -0.17% | -0.19% | -0.24% | -0.08% | 0.17% | -0.30% | -0.27% | |
| EUR | 0.17% | -0.00% | -0.07% | 0.08% | 0.27% | -0.15% | -0.12% | |
| GBP | 0.19% | 0.00% | 0.00% | 0.10% | 0.25% | -0.15% | -0.09% | |
| JPY | 0.24% | 0.07% | 0.00% | 0.18% | 0.47% | -0.09% | -0.02% | |
| CAD | 0.08% | -0.08% | -0.10% | -0.18% | 0.27% | -0.23% | -0.20% | |
| AUD | -0.17% | -0.27% | -0.25% | -0.47% | -0.27% | -0.42% | -0.52% | |
| NZD | 0.30% | 0.15% | 0.15% | 0.09% | 0.23% | 0.42% | 0.05% | |
| CHF | 0.27% | 0.12% | 0.09% | 0.02% | 0.20% | 0.52% | -0.05% |
The heat map shows percentage changes of major currencies against each other. The base currency is picked from the left column, while the quote currency is picked from the top row. For example, if you pick the Australian Dollar from the left column and move along the horizontal line to the US Dollar, the percentage change displayed in the box will represent AUD (base)/USD (quote).
Economic Indicator
Employment Change s.a.
The Employment Change released by the Australian Bureau of Statistics is a measure of the change in the number of employed people in Australia. The statistic is adjusted to remove the influence of seasonal trends. Generally speaking, a rise in Employment Change has positive implications for consumer spending, stimulates economic growth, and is bullish for the Australian Dollar (AUD). A low reading, on the other hand, is seen as bearish.
Read more.Last release: Thu Oct 16, 2025 00:30
Frequency: Monthly
Actual: 14.9K
Consensus: 17K
Previous: -5.4K
Source: Australian Bureau of Statistics
Artigos Recomendados


