


Sui Price Forecast: Surging stablecoins market, DEXs volume and DeFi TVL drive SUI's bullish sentiment
- Sui struggles to hold onto gains as prices across the crypto market falter after Wednesday's rally.
- Sui's recovery can be attributed to significant improvements in the network's DeFi ecosystem.
- DEXs' volume on Sui soared 38.51% in the last week to $2.77 billion, with $806 million recorded in the last 24 hours.
Sui's price climbs to $2.97 at the time of writing on Thursday, defying a broader bearish sentiment in the cryptocurrency market. The layer-1 token looks to extend gains above the intraday high of $3.12, supported by growing interest in the network's decentralized finance (DeFi) ecosystem.
Sui's DEXs volume hits $2.77 billion, as DeFi TVL soars
Sui is emerging as a strong contender among layer-1 blockchains in the crypto industry. According to DefiLlama, the Total Value Locked (TVL), which represents the total sum of all coins held in smart contracts across all protocols on the chain, increased by 9.64% to $1.595 billion.
The protocol's stablecoin market capitalization increased 7.81% in the last seven days, reaching $865.2 million. USDC is the most dominant stablecoin, with a market share of 71.64%.
Trading volume on Sui's decentralized exchanges (DEXs) surged 38.51% in the last week to approximately $2.77 billion, portraying Sui as one of the strongest performers in the space. The DEXs' volume in the last 24 hours was $806.16 million, as highlighted in the chart below.
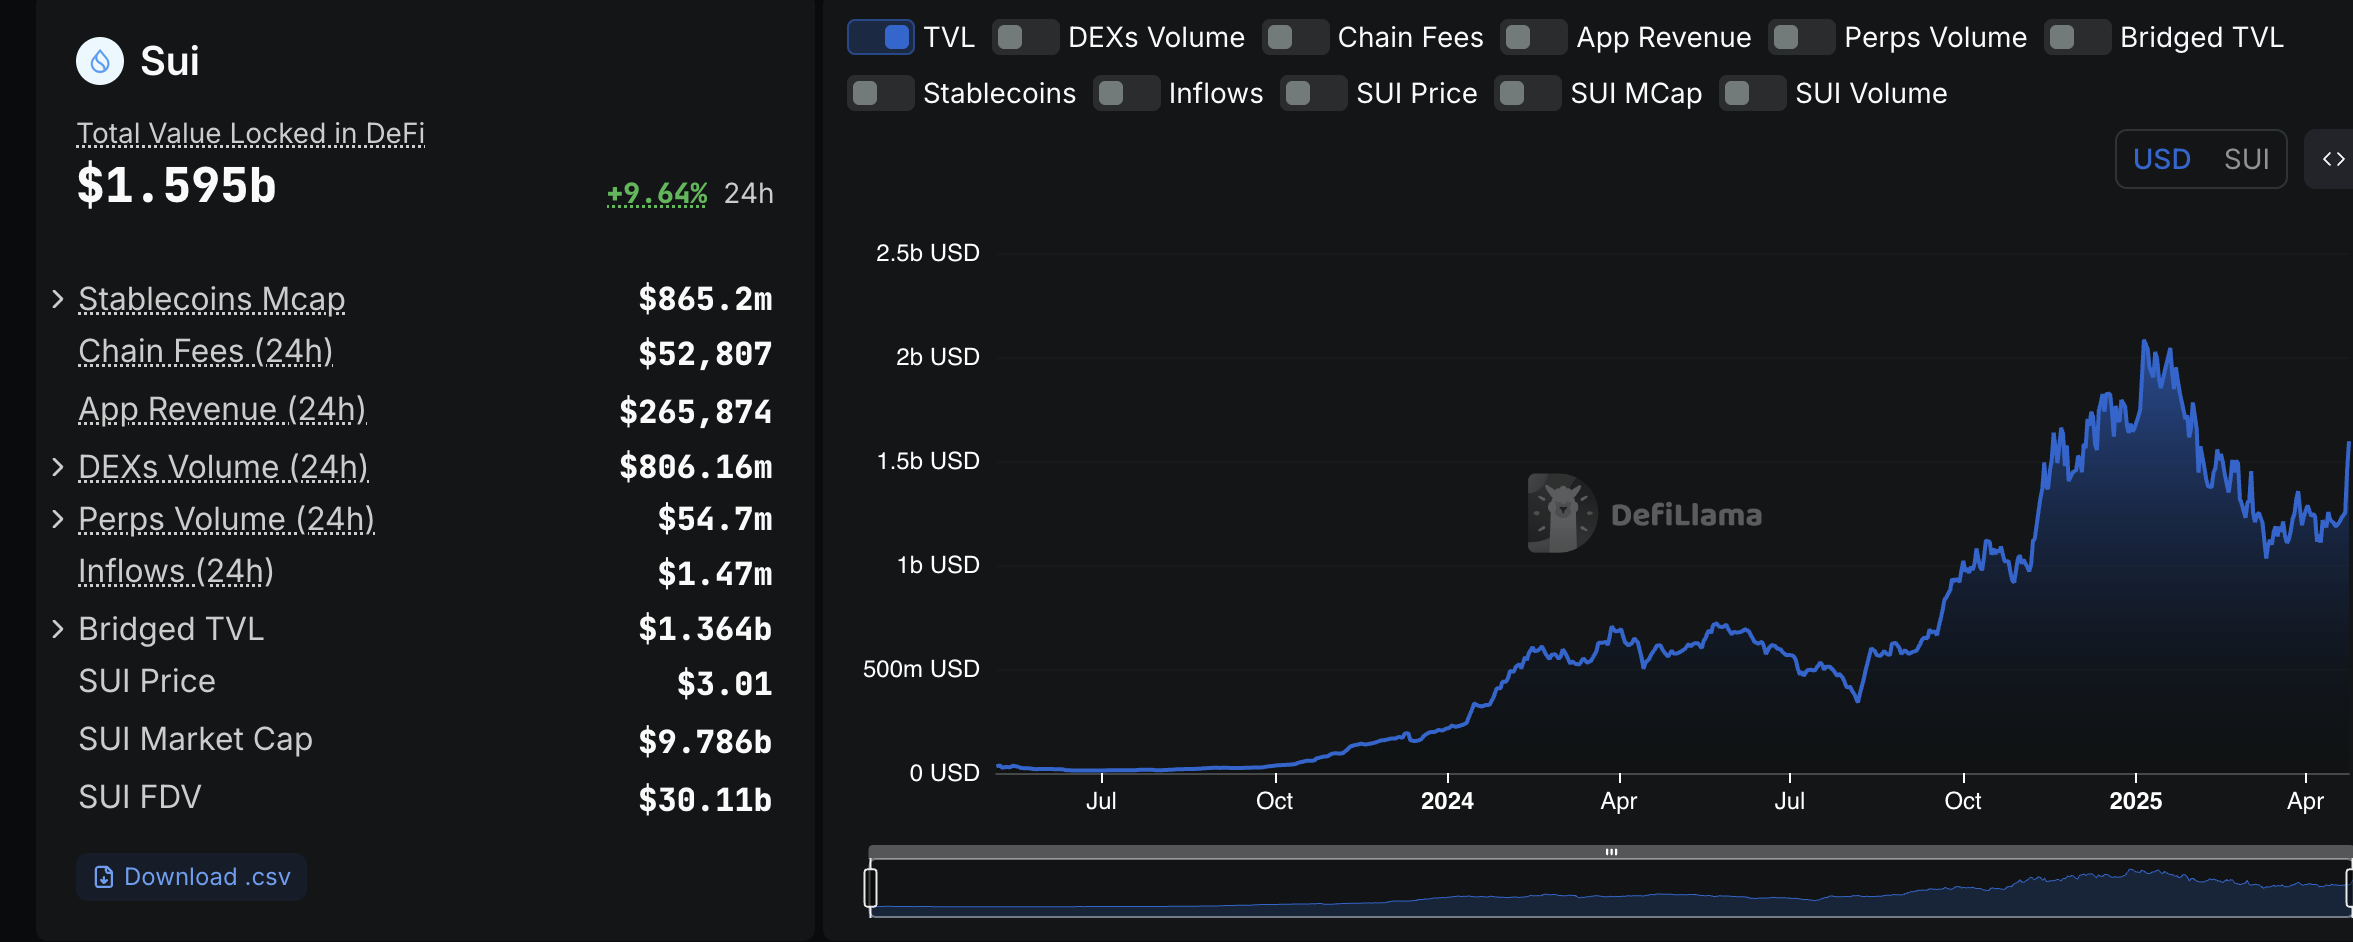
Sui DeFi data | Source: DefiLlama
Sui price seeks to reclaim support at $3
Sui's price hovers at $2.98, following a recent breakout above the descending trendline. The Relative Strength (RSI) near the overbought territory at 69.26 reinforces a growing bullish momentum.
A daily close above $3.00 would affirm the heavy presence of bulls in the market, potentially cultivating gains as they eye the next key resistance at $3.58, last tested in February.
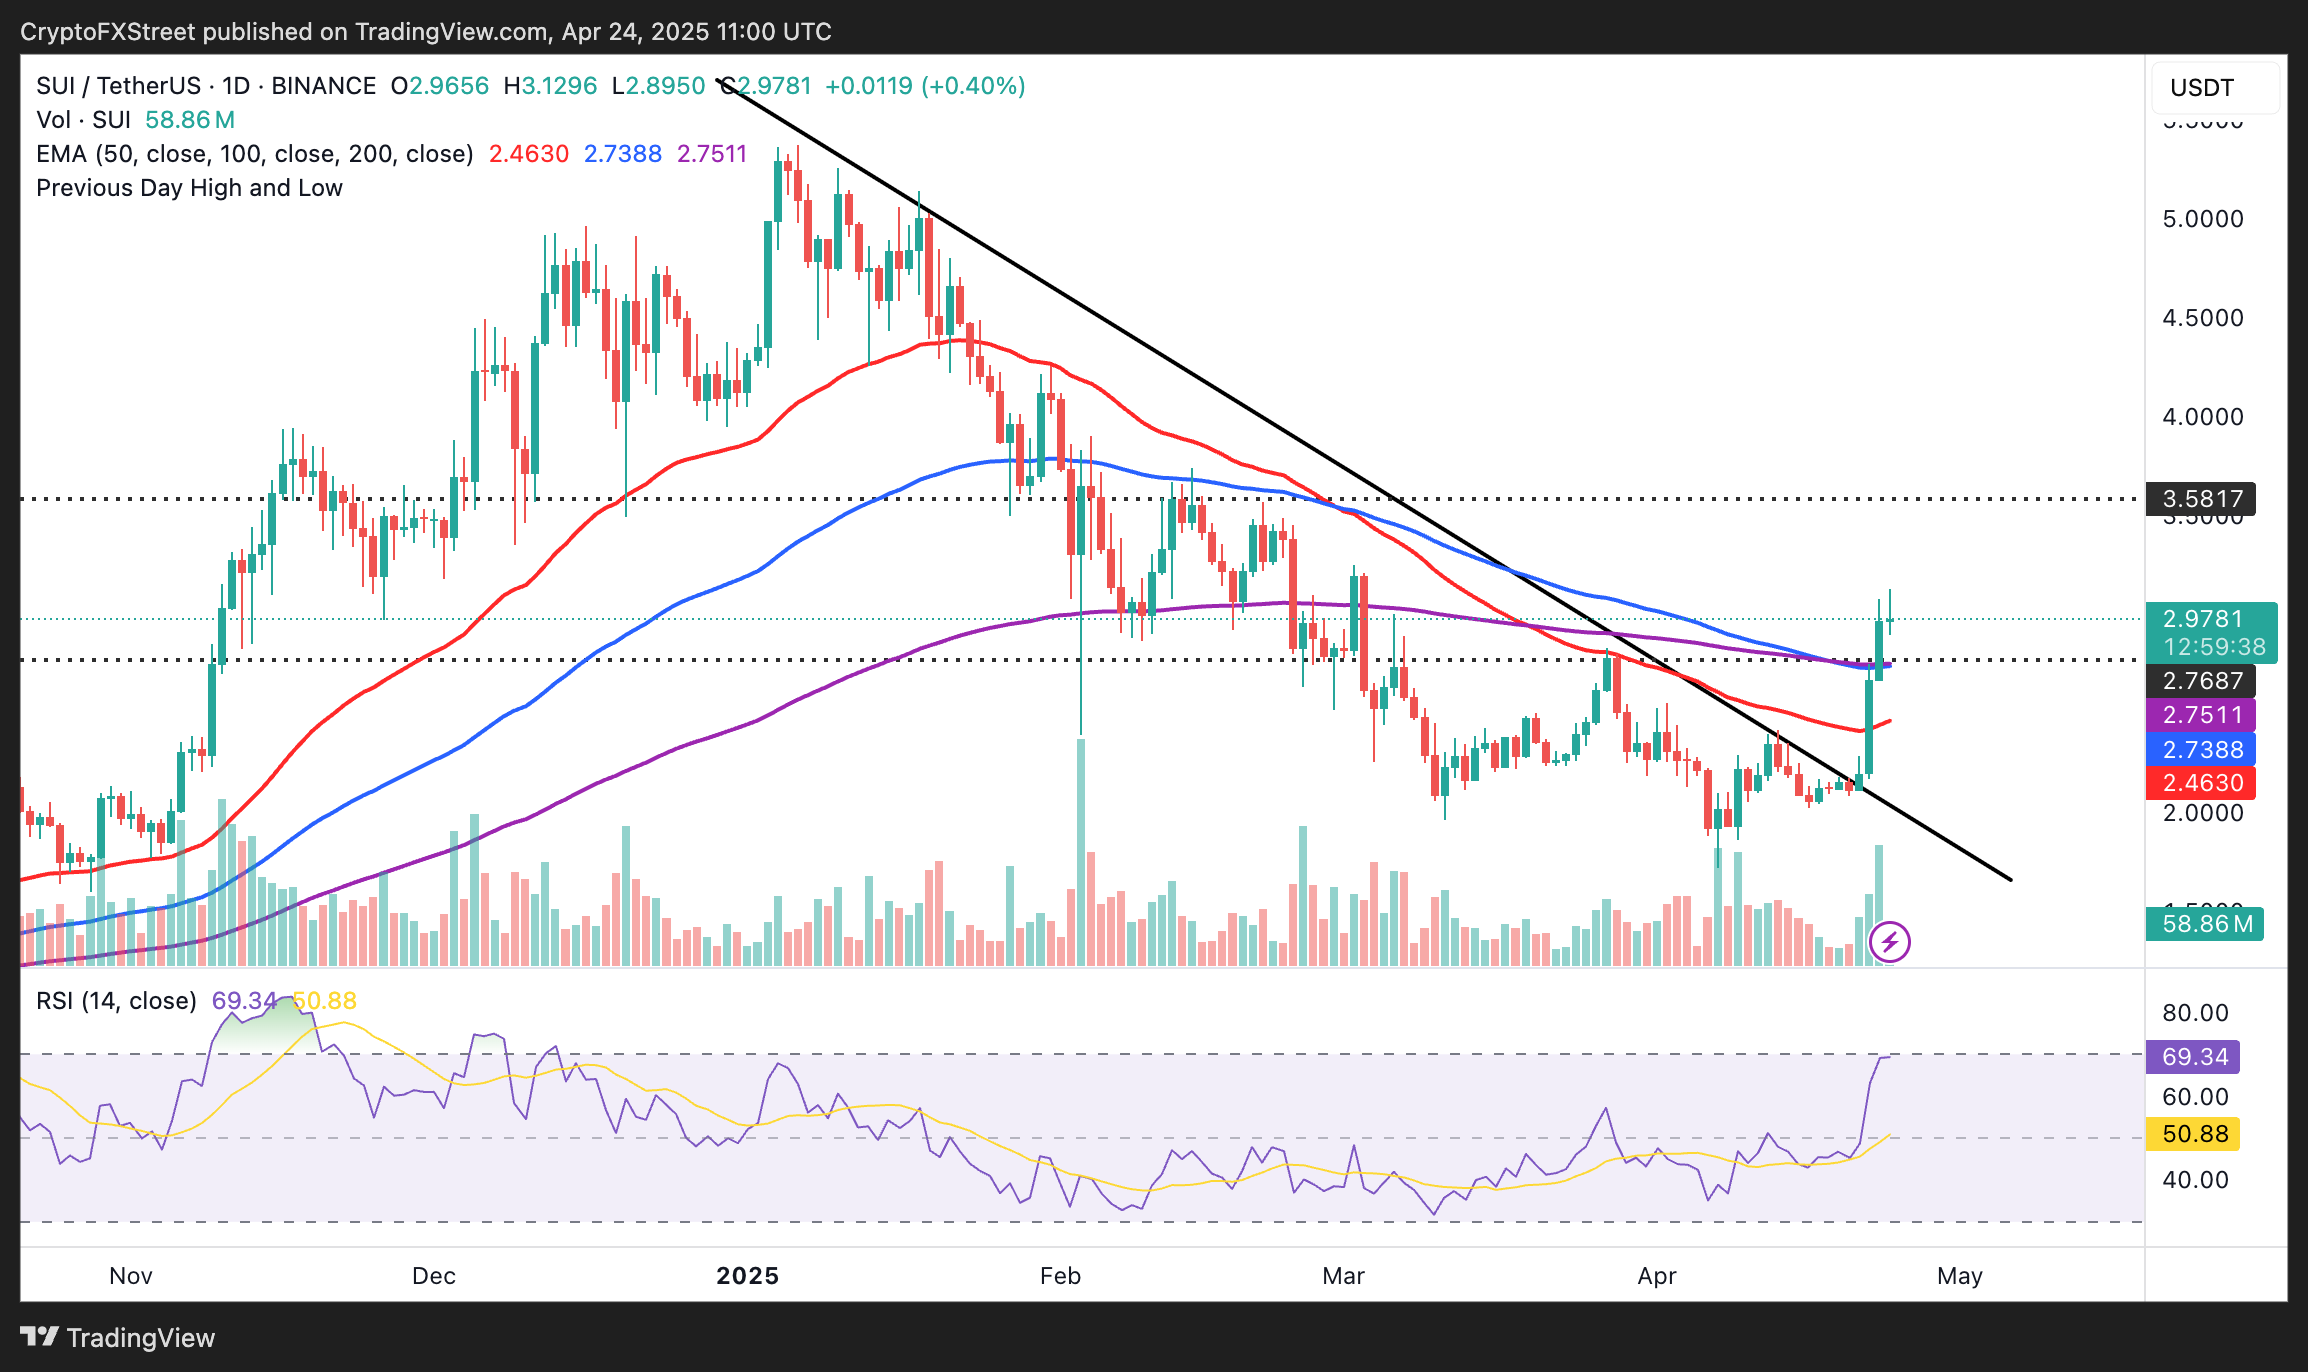
SUI/USDT daily chart
The RSI indicator's position near the overbought area could signal a potential reversal in upcoming sessions. Therefore, it would be prudent for traders to monitor the direction of the indicator, with downward movement interpreted as bearish for the price of Sui.
Near-term support is expected to lie around $2.75, a confluence formed by the 100-day Exponential Moving Average (EMA) and the 200-day EMA. Beyond this level, the next area of importance could be the 50-day EMA at $2.46.
Cryptocurrency metrics FAQs
The developer or creator of each cryptocurrency decides on the total number of tokens that can be minted or issued. Only a certain number of these assets can be minted by mining, staking or other mechanisms. This is defined by the algorithm of the underlying blockchain technology. On the other hand, circulating supply can also be decreased via actions such as burning tokens, or mistakenly sending assets to addresses of other incompatible blockchains.
Market capitalization is the result of multiplying the circulating supply of a certain asset by the asset’s current market value.
Trading volume refers to the total number of tokens for a specific asset that has been transacted or exchanged between buyers and sellers within set trading hours, for example, 24 hours. It is used to gauge market sentiment, this metric combines all volumes on centralized exchanges and decentralized exchanges. Increasing trading volume often denotes the demand for a certain asset as more people are buying and selling the cryptocurrency.
Funding rates are a concept designed to encourage traders to take positions and ensure perpetual contract prices match spot markets. It defines a mechanism by exchanges to ensure that future prices and index prices periodic payments regularly converge. When the funding rate is positive, the price of the perpetual contract is higher than the mark price. This means traders who are bullish and have opened long positions pay traders who are in short positions. On the other hand, a negative funding rate means perpetual prices are below the mark price, and hence traders with short positions pay traders who have opened long positions.
추천 기사


