

Dow Jones Industrial Average pares intraday gains as equity recovery falters ahead of tariffs
- The Dow Jones briefly rallied on Tuesday before falling back to the 38,000 level.
- Equities are struggling to regain their footing after getting obliterated by the Trump administration’s tariff announcements last week.
- “Reciprocal” tariffs, as well as additional tariffs on China, are due to take effect at midnight EST.
The Dow Jones Industrial Average (DJIA) fumbled an early recovery on Tuesday, briefly crossing above 39,000 before slumping back to the 38,000 handle as markets brace for tariff kick-off following the Trump administration’s “Liberation Day” tariff announcements last week. The Dow Jones is still trading in recovery territory following one of the worst three-day runs in US market history, however, topside momentum remains limited.
The Trump administration’s wide array of “reciprocal” tariffs are slated to come into effect at midnight EST on April 9, but apparently, this wasn’t fast enough for additional counter-retaliatory tariffs on China. According to White House Press Secretary Karoline Leavitt, the US’s steep 104% package of tariffs came into effect as of noon EST on Tuesday in response to China’s 34% counter-tariff in response to the US’s own 34% reciprocal tariffs announced last week. United States (US) President Donald Trump flew into a tailspin when China retaliated against his tariff package, immediately announcing an additional 50% tariff on top of all of the other import levies already set to be imposed on Chinese goods being imported into the US.
Tariff stress bolsters rate cut hopes
As tariff stress continues to weigh on markets, interest rate watchers are continuing to ramp up their bets of additional Federal Reserve (Fed) easing in 2025. According to the CME’s FedWatch Tool, rate traders are now pricing in 125-150 bps in rate cuts over the next 12 months, with 100 bps expected by the end of the year. Rate traders are also ramping up their bets of a quarter-point cut as early as May, with the majority of rate bets set on a first cut in July.
US economic data takes on new importance later this week, with US Consumer Price Index (CPI) inflation due on Thursday, followed by Producer Price Index (PPI) inflation and University of Michigan (UoM) Consumer Sentiment survey results slated for Friday. The latest round of inflation and sentiment data still won’t include any direct fallout from the Trump administration’s announced tariffs, however the most recent batch of economic data will serve as important “bellwether” readings before tariff impacts begin to bleed over directly into the economy.
Stock news
US stock markets are overall higher than they were on Monday, but bullish momentum is running out of gas quickly. The financial and tech sectors recovered some ground on Tuesday, but tariff-sensitive sectors like building materials and energy providers are still languishing on the bearish side.
Notable gainers on Tuesday include JPMorgan Chase & Co (JPM), which rose 3% to $221 per share, followed by Boeing (BA) and Nvidia (NVDA), which both rose around 2.7% to $143 and $100 per share, respectively. On the low side, Merck & Co (MRK) and Nike (NKE) both fell around 2.3%, with Merck & Co slipping below $80 per share and Nike falling to $54 per share.
Read more stock news: UnitedHealth Group stock shoots up on Medicare Advantage rate hike proposal
Dow Jones price forecast
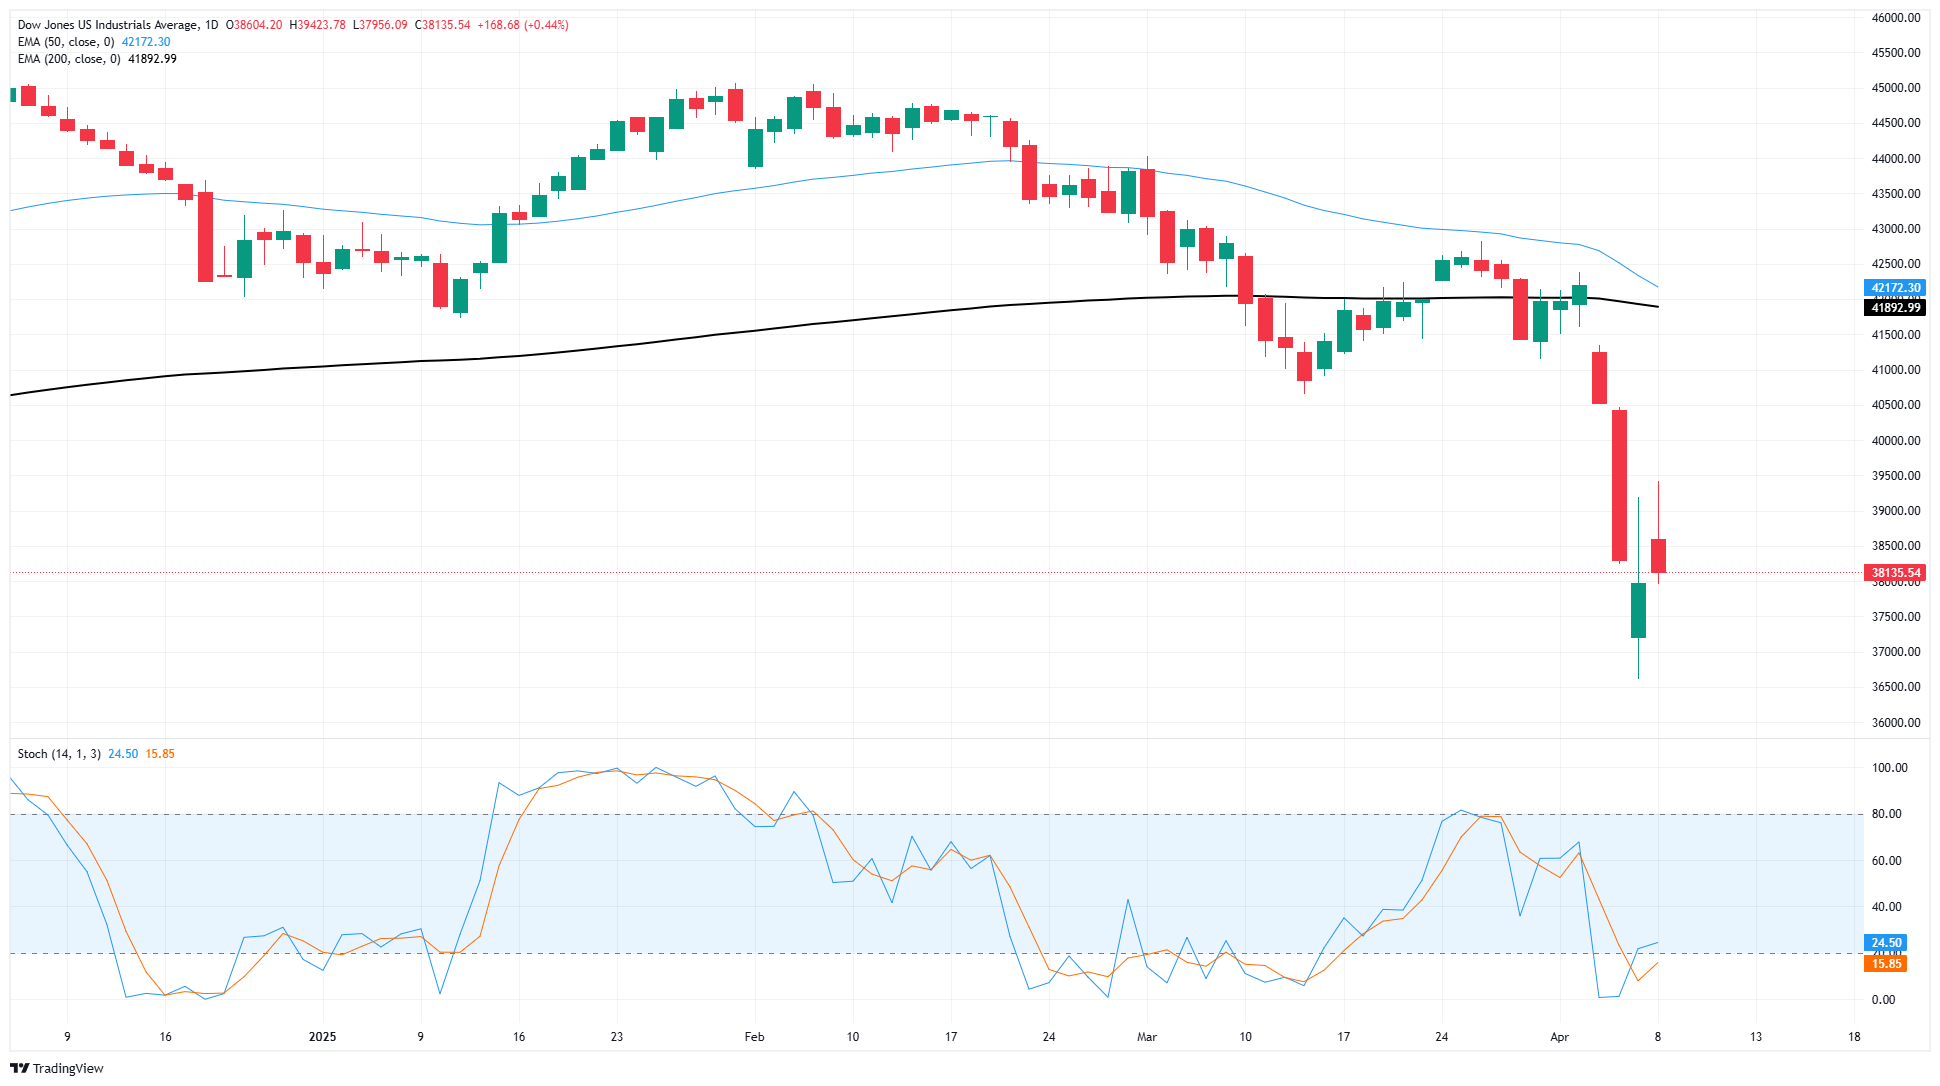
The Dow Jones Industrial Average appears to have found a technical floor from the 37,000 handle, but the major equity index isn’t out of the woods yet. DJIA bids are still trading steeply off of all-time highs just above 45,000, with the Dow Jones down over 15% from the peak.
A recovery play may be on the cards if upside momentum is able to keep the wheels on the road. However, stiff technical price ceilings are in play at the last swing low below 41,000 and the 200-day Exponential Moving Average (EMA) near 42,000.
Dow Jones daily chart
Dow Jones FAQs
The Dow Jones Industrial Average, one of the oldest stock market indices in the world, is compiled of the 30 most traded stocks in the US. The index is price-weighted rather than weighted by capitalization. It is calculated by summing the prices of the constituent stocks and dividing them by a factor, currently 0.152. The index was founded by Charles Dow, who also founded the Wall Street Journal. In later years it has been criticized for not being broadly representative enough because it only tracks 30 conglomerates, unlike broader indices such as the S&P 500.
Many different factors drive the Dow Jones Industrial Average (DJIA). The aggregate performance of the component companies revealed in quarterly company earnings reports is the main one. US and global macroeconomic data also contributes as it impacts on investor sentiment. The level of interest rates, set by the Federal Reserve (Fed), also influences the DJIA as it affects the cost of credit, on which many corporations are heavily reliant. Therefore, inflation can be a major driver as well as other metrics which impact the Fed decisions.
Dow Theory is a method for identifying the primary trend of the stock market developed by Charles Dow. A key step is to compare the direction of the Dow Jones Industrial Average (DJIA) and the Dow Jones Transportation Average (DJTA) and only follow trends where both are moving in the same direction. Volume is a confirmatory criteria. The theory uses elements of peak and trough analysis. Dow’s theory posits three trend phases: accumulation, when smart money starts buying or selling; public participation, when the wider public joins in; and distribution, when the smart money exits.
There are a number of ways to trade the DJIA. One is to use ETFs which allow investors to trade the DJIA as a single security, rather than having to buy shares in all 30 constituent companies. A leading example is the SPDR Dow Jones Industrial Average ETF (DIA). DJIA futures contracts enable traders to speculate on the future value of the index and Options provide the right, but not the obligation, to buy or sell the index at a predetermined price in the future. Mutual funds enable investors to buy a share of a diversified portfolio of DJIA stocks thus providing exposure to the overall index.
추천 기사


