


US Dollar edges lower at start of central bank’s week
- The US Dollar sees some safe-haven inflows during the Asian session on Monday.
- US President Trump threatened to slap 50% tariffs on Colombia imports in a deportation spat.
- The US Dollar Index (DXY) sinks below 108.00 and hits a key moving average.
The US Dollar Index (DXY), which tracks the performance of the US Dollar against six different major currencies, edges slightly lower and trades around 107.30 at the time of writing on Monday despite some earlier safe-have inflows during the Asian session. Markets got spooked after United States (US) President Donald Trump threatened to slap 50% tariffs on Colombian imports after the country refused to take in deported immigrants from the US during the weekend. Traders now reassess their earlier dovish stance on tariffs as it seems clear they will be used more heavily as a leverage tool.
On the economic data front, all eyes are on the US Federal Reserve (Fed) and the European Central Bank (ECB), which will announce their first monetary policy decisions this year on Wednesday and Thursday, respectively. While the ECB is set to deliver another 25 basis points (bps) rate cut, the Fed is expected to keep borrowing costs unchanged. For this Monday, the Chicago Fed National Activity Index for December is the main data point to focus on.
Daily digest market movers: All eyes on Wednesday
- At 13:30 GMT, the Chicago Fed National Activity Index for December is due. The previous reading was at -0.12, with no forecast available.
- At 15:00 GMT, New Home Sales data for December is due, with expectations for a jump in sales to 0.67 million units from 0.664 million in November.
- The US Treasury will have its work cut out for this Monday with two auction moments due:
- at 16:30 GMT, short-term 3-month and 6-month bills will be allocated.
- At 18:00 GMT, medium-term 2-year and 5-year notes are due for auction.
- Equities sink on Monday due to concerns over AI valuations and overestimated earnings in the tech sector. All European indices and US equity futures trade down over 1%.
- The CME FedWatch tool projects a 43.8% chance that interest rates will remain unchanged at current levels in the May meeting, suggesting a rate cut that month. Expectations are that the Federal Reserve (Fed) will remain data-dependent with uncertainties that could influence inflation during US President Donald Trump’s term.
- The US 10-year yield is trading around 4.526%, further away from its more-than-one-year high earlier this month at 4.807%.
US Dollar Index Technical Analysis: Turning ugly
The US Dollar Index (DXY) is overpassed in this Monday’s bid for a safe haven. Instead, investors are picking up more US bonds and the Japanese Yen (JPY). The latter is currently rallying over 1% against the US Dollar, weighting on the DXY as it accounts for 13.6% of weight. Expect volatile moves in the DXY by Wednesday during the Fed decision announcement.
There is a long road to recovery. First, the psychological level of 108.00 must be recovered. From there, 109.29 (July 14, 2022, high and rising trendline) is next to pare back last week’s losses. Further up, the next upside level to hit before advancing further remains at 110.79 (September 7, 2022, high).
On the downside, the convergence of the high of October 3, 2023, and the 55-day Simple Moving Average (SMA) around 107.56 should act as a double safety feature to support the DXY price. For now, that looks to be holding, though the Relative Strength Index (RSI) still has some room for the downside. Hence, rather look for 106.52 or even 105.89 as better levels for US Dollar bulls to engage and trigger a reversal.
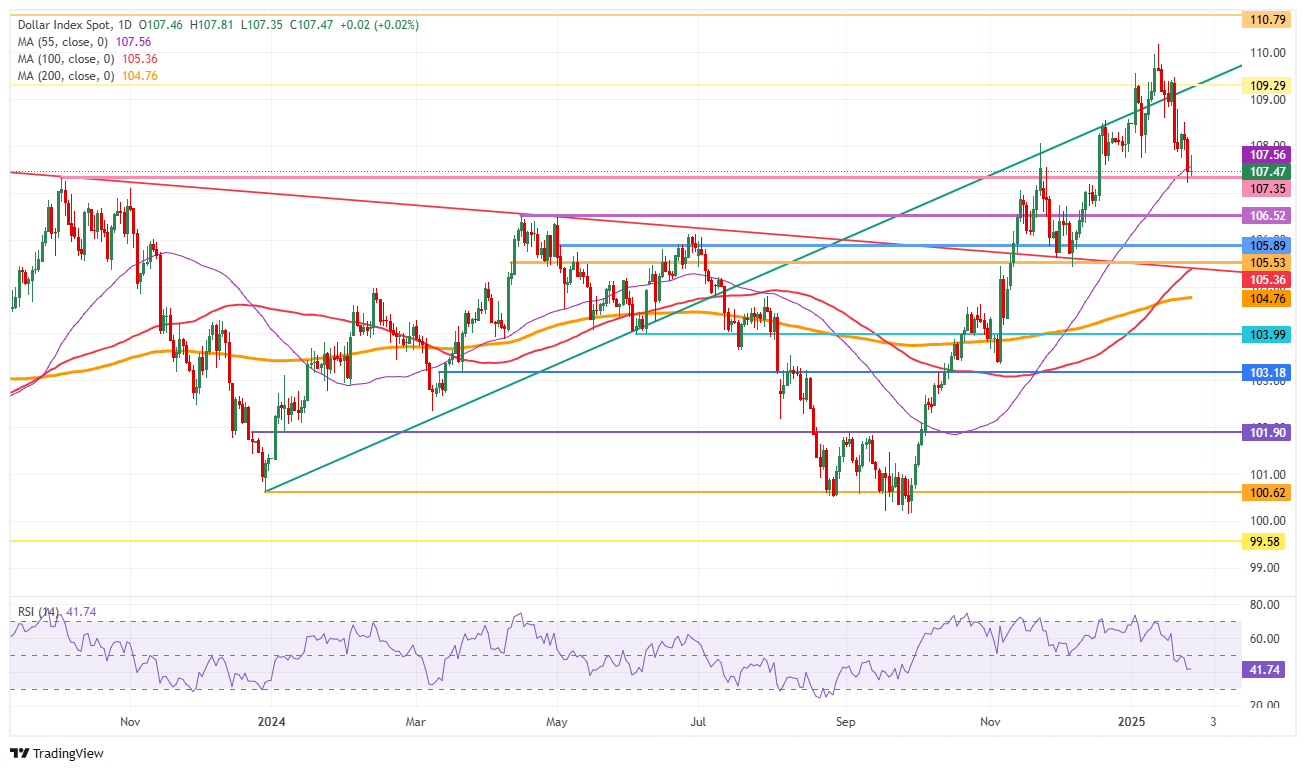
US Dollar Index: Daily Chart
US Dollar FAQs
The US Dollar (USD) is the official currency of the United States of America, and the ‘de facto’ currency of a significant number of other countries where it is found in circulation alongside local notes. It is the most heavily traded currency in the world, accounting for over 88% of all global foreign exchange turnover, or an average of $6.6 trillion in transactions per day, according to data from 2022. Following the second world war, the USD took over from the British Pound as the world’s reserve currency. For most of its history, the US Dollar was backed by Gold, until the Bretton Woods Agreement in 1971 when the Gold Standard went away.
The most important single factor impacting on the value of the US Dollar is monetary policy, which is shaped by the Federal Reserve (Fed). The Fed has two mandates: to achieve price stability (control inflation) and foster full employment. Its primary tool to achieve these two goals is by adjusting interest rates. When prices are rising too quickly and inflation is above the Fed’s 2% target, the Fed will raise rates, which helps the USD value. When inflation falls below 2% or the Unemployment Rate is too high, the Fed may lower interest rates, which weighs on the Greenback.
In extreme situations, the Federal Reserve can also print more Dollars and enact quantitative easing (QE). QE is the process by which the Fed substantially increases the flow of credit in a stuck financial system. It is a non-standard policy measure used when credit has dried up because banks will not lend to each other (out of the fear of counterparty default). It is a last resort when simply lowering interest rates is unlikely to achieve the necessary result. It was the Fed’s weapon of choice to combat the credit crunch that occurred during the Great Financial Crisis in 2008. It involves the Fed printing more Dollars and using them to buy US government bonds predominantly from financial institutions. QE usually leads to a weaker US Dollar.
Quantitative tightening (QT) is the reverse process whereby the Federal Reserve stops buying bonds from financial institutions and does not reinvest the principal from the bonds it holds maturing in new purchases. It is usually positive for the US Dollar.
추천 기사


