

Dow Jones Industrial Average claws back ground after US CPI print
- The Dow lurched 200 points higher in a midweek rebound.
- US CPI inflation held steady and accelerated on the backend, but met expectations.
- Equities continue to hold ground on the high end after the post-election rally.
The Dow Jones Industrial Average (DJIA) clawed back over 200 points at its peak on Wednesday, recovering ground after an early-week plunge from record highs. The post-election rally following presidential candidate and former President Donald Trump sent markets into dizzying new heights, but investors remain unwilling to let prices fall too far back despite the clear need for a breather.
US Consumer Price Index (CPI) inflation figures came in stickier than many had hoped, but still well within median market forecasts, helping to keep investor sentiment elevated. Headline CPI held steady at 0.2% MoM as expected, while annualized headline CPI inflation accelerated to 2.6% YoY from the previous 2.4%, as markets predicted. Core CPI inflation also met market expectations, holding at 0.3% MoM and 3.3% on an annualized basis.
Dow Jones news
Despite a notable lack of inflation easing in October’s CPI figures, investors remain confident during the midweek market session, with around two-thirds of the Dow Jones finding positive territory for the day. Boeing (BA) still found the red, declining around 2.5% and sliding below $142 per share as the battered airospace manufacturer begins issuing layoff notices as part of the company’s plans to layoff 17,000 workers, or an entire tenth of the airplane builder’s global workforce.
On the high side, Amazon surged to a fresh all-time high on Wednesday, breaching $215 dollars per share. The mega-conglomerate that covers everything from internet and cloud computing services to online retailing is surging after Amazon announced plans to begin their own production system for AI-focused computer chips in a bid to take a chunk out of Nvidia’s market share in the large data modeling space. Amazon has also announced plans to launch a discount e-commerce segment of their large-frame warehousing and online retailing segment, directly targeting the growing sector currently dominated by social media adspace scourge Temu.
Elsewhere on the Dow Jones equity board, Home Depot (HD) is marching its way back toward $410 per share in a post-glut rebound after shedding weight recently on the back of declining sales figures.
Dow Jones price forecast
The Dow Jones launched into a fresh round of bullish pressure last week, breaching into new record highs a stone’s throw away from 44,500. This week saw a brief pullback from record highs as lopsided bullish momentum began to spark concerns of overbought conditions. Despite the Dow Jones’ one-sided chart performance, bidders continue to pile into the space, keeping the battle constrained to chart paper near the 44,000 handle.
The Dow Jones is up nearly 20% bottom-to-top for the year, and has added an eye-watering 31.5% since the last time price action touched the 200-day Exponential Moving Average (EMA) near the 34,000 handle in November of 2023. Short interest is circling the waters, looking for a low-pressure fallback to the 50-day EMA near 42,330, but downside momentum remains elusive.
Dow Jones daily chart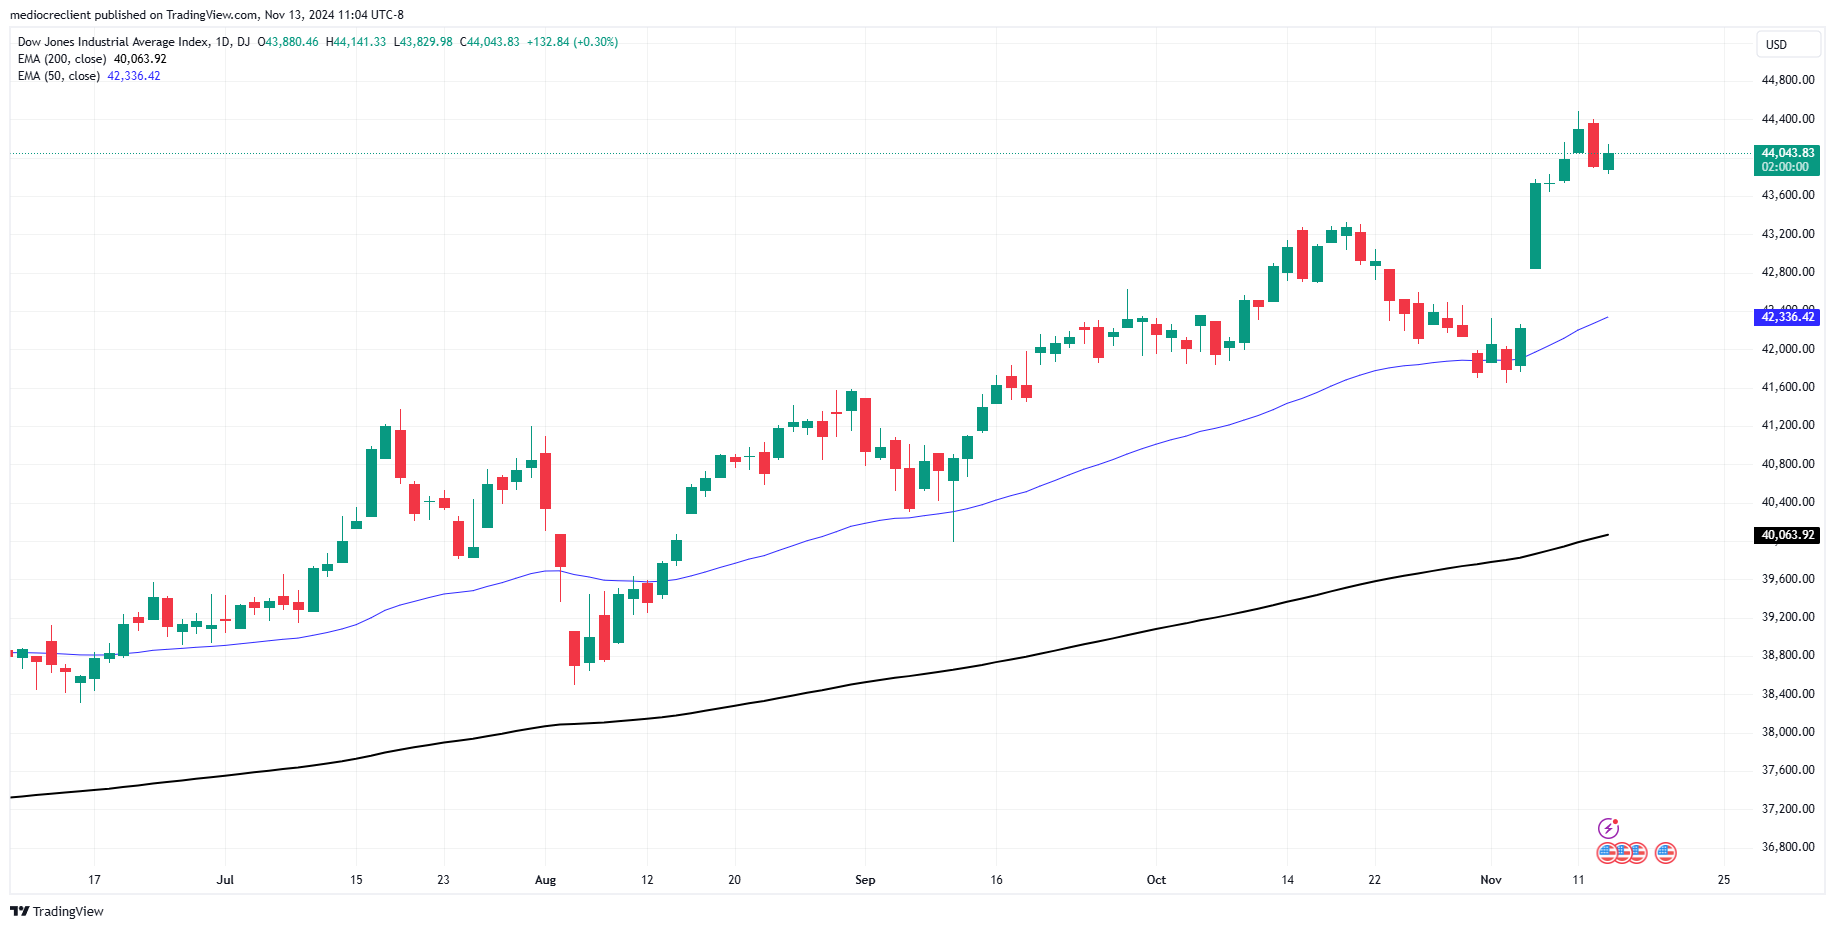
Dow Jones FAQs
The Dow Jones Industrial Average, one of the oldest stock market indices in the world, is compiled of the 30 most traded stocks in the US. The index is price-weighted rather than weighted by capitalization. It is calculated by summing the prices of the constituent stocks and dividing them by a factor, currently 0.152. The index was founded by Charles Dow, who also founded the Wall Street Journal. In later years it has been criticized for not being broadly representative enough because it only tracks 30 conglomerates, unlike broader indices such as the S&P 500.
Many different factors drive the Dow Jones Industrial Average (DJIA). The aggregate performance of the component companies revealed in quarterly company earnings reports is the main one. US and global macroeconomic data also contributes as it impacts on investor sentiment. The level of interest rates, set by the Federal Reserve (Fed), also influences the DJIA as it affects the cost of credit, on which many corporations are heavily reliant. Therefore, inflation can be a major driver as well as other metrics which impact the Fed decisions.
Dow Theory is a method for identifying the primary trend of the stock market developed by Charles Dow. A key step is to compare the direction of the Dow Jones Industrial Average (DJIA) and the Dow Jones Transportation Average (DJTA) and only follow trends where both are moving in the same direction. Volume is a confirmatory criteria. The theory uses elements of peak and trough analysis. Dow’s theory posits three trend phases: accumulation, when smart money starts buying or selling; public participation, when the wider public joins in; and distribution, when the smart money exits.
There are a number of ways to trade the DJIA. One is to use ETFs which allow investors to trade the DJIA as a single security, rather than having to buy shares in all 30 constituent companies. A leading example is the SPDR Dow Jones Industrial Average ETF (DIA). DJIA futures contracts enable traders to speculate on the future value of the index and Options provide the right, but not the obligation, to buy or sell the index at a predetermined price in the future. Mutual funds enable investors to buy a share of a diversified portfolio of DJIA stocks thus providing exposure to the overall index.
추천 기사


