

US Dollar rolls through markets, fueled by gains against Yen
- The US Dollar recovers for a second day in a row this week.
- The BoJ dropped mixed messages on its monetary policy.
- The US Dollar index pops above 103.00 and rallies higher on Wednesday.
The US Dollar (USD) recovers as all asset classes start to head back to more normal levels. Equities are behaving quite well and are stable, volatility is easing, and safe havens such as Japanese Yen (JPY) and Swiss Franc (CHF) are easing further against the Greenback. The Japanese Yen, sinking over 1.5% against the US Dollar, is the biggest contributor to the recovery of the US Dollar Index (DXY).
On the economic front, there is a very light day ahead, which should be beneficial for markets to continue the recovery path. In the interest rate space, the 10-year Note auction from the US treasury might draw the most attention, seeing it is a substantial benchmark rate. Late on Wednesday, the United States (US) Consumer Credit Change data for June will be released.
Daily digest market movers: Dollar gears up
- Traders must have raised their eyebrows in Asian hours when comments from Bank of Japan (BoJ) member Shinichi Uchida said that the BoJ would not raise rates if markets were unstable. This pushed the Yen down by 1% against the US Dollar in an initial reaction.
- At 11:00 GMT, the Mortgage Bankers Association has released its weekly Mortgage Application Index. The previous number was at -3.9%, with this week's number coming in positive at 6.9%
- At 17:00 GMT, the US Treasury will allocate a 10-year Note in the market. Previous interest was 4.276%, while the US 10-year note currently trades around 3.90%, a substantial discount.
- US Consumer Credit Change data for June is set to be released at 19:00 GMT, with expectations for a drop to $10 billion from $11.35 billion a month earlier.
- Equity markets are on a winning streak, with both the Japanese Nikkei and Topix indexes in the green. European equities are also doing great, on average up 1%, while the US futures are just shy of 1%.
- The CME Fedwatch Tool shows a 63.5% chance of a 50 basis points (bps) interest rate cut by the Federal Reserve (Fed) in September. Another 25 bps cut is expected in November by 55.5%, while a 17.5% chance for a 50 bps cut and 27.0% for no cut are being pencilled in for that meeting.
- The US 10-year benchmark rate trades at 3.93%, shooting higher for this week, as investors flee away from bonds and back into equities.
US Dollar Index Technical Analysis: The Greenback rolls on
The US Dollar Index (DXY) is continuing its recovery with some help from the Japanese Yen. TWhen looking at that specific currency cross (USD/JPY), it paints a clearly shows picture that the Yen has gained too much too quickly against the US Dollar. A full recline is not projected, though certainly more recovery could occur take place this week for the US Dollar, which would spill over into the DXY trading higher by Friday.
The three-tiered recovery is already in play, with the first resistance up at 103.18, a level held on Friday though snapped on Monday in the Asian hours, being tested on Wednesday. Once the DXY closes above that level, next up is 104.00, which was the support from June. If the DXY can make its way back above that level, the 200-day Simple Moving Average (SMA) at 104.22 is the next resistance level to look out for.
On the downside, the oversold Relative Strength Index (RSI) indicator in the daily chart should prevent the DXY from making more hefty losses. Support nearby is the March 8 low at 102.35. Once through there, pressure will start to build on 102.00 as a big psychological figure before testing 101.90, which was a pivotal level in December 2023 and January 2024.
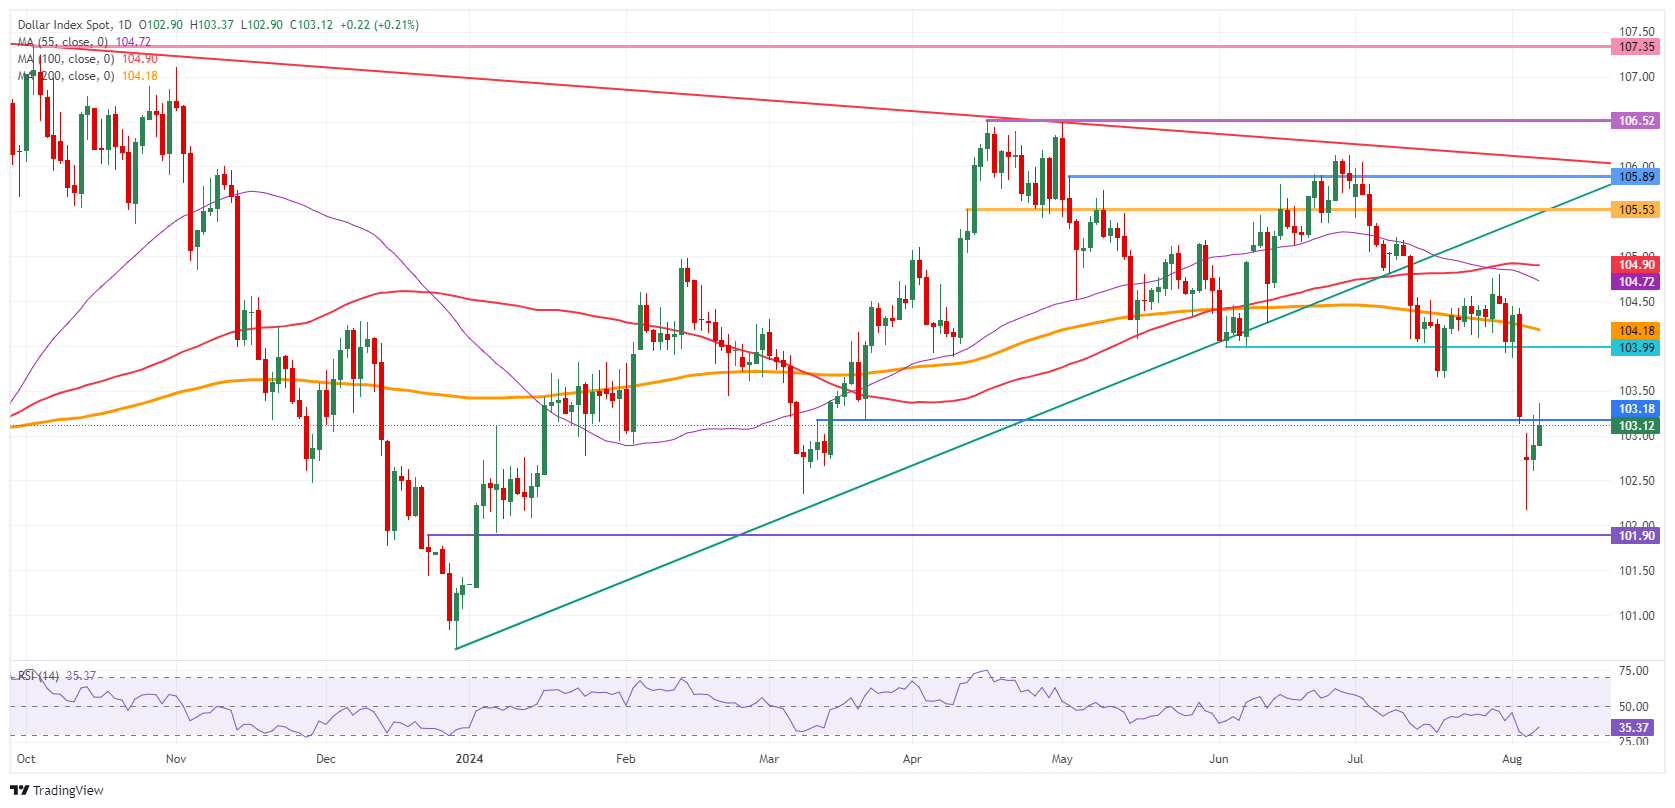
US Dollar Index: Daily Chart
US Dollar FAQs
The US Dollar (USD) is the official currency of the United States of America, and the ‘de facto’ currency of a significant number of other countries where it is found in circulation alongside local notes. It is the most heavily traded currency in the world, accounting for over 88% of all global foreign exchange turnover, or an average of $6.6 trillion in transactions per day, according to data from 2022. Following the second world war, the USD took over from the British Pound as the world’s reserve currency. For most of its history, the US Dollar was backed by Gold, until the Bretton Woods Agreement in 1971 when the Gold Standard went away.
The most important single factor impacting on the value of the US Dollar is monetary policy, which is shaped by the Federal Reserve (Fed). The Fed has two mandates: to achieve price stability (control inflation) and foster full employment. Its primary tool to achieve these two goals is by adjusting interest rates. When prices are rising too quickly and inflation is above the Fed’s 2% target, the Fed will raise rates, which helps the USD value. When inflation falls below 2% or the Unemployment Rate is too high, the Fed may lower interest rates, which weighs on the Greenback.
In extreme situations, the Federal Reserve can also print more Dollars and enact quantitative easing (QE). QE is the process by which the Fed substantially increases the flow of credit in a stuck financial system. It is a non-standard policy measure used when credit has dried up because banks will not lend to each other (out of the fear of counterparty default). It is a last resort when simply lowering interest rates is unlikely to achieve the necessary result. It was the Fed’s weapon of choice to combat the credit crunch that occurred during the Great Financial Crisis in 2008. It involves the Fed printing more Dollars and using them to buy US government bonds predominantly from financial institutions. QE usually leads to a weaker US Dollar.
Quantitative tightening (QT) is the reverse process whereby the Federal Reserve stops buying bonds from financial institutions and does not reinvest the principal from the bonds it holds maturing in new purchases. It is usually positive for the US Dollar.
추천 기사


