

Dow Jones Industrial Average recovers as January CPI cools, rate cut bets surge
- The Dow rebounded over 200 points on Friday as January inflation data came in cooler than expected, easing pressure after Thursday's AI-driven rout.
- Consumer Price Index rose 0.2% month-over-month and 2.4% year-over-year, both below consensus, lifting rate cut expectations sharply.
- CME FedWatch Tool now shows roughly 83% odds of a June rate cut, up from below 50% earlier in the week.
- Applied Materials surged on blowout earnings while Pinterest and DraftKings cratered on weak guidance.
The Dow Jones Industrial Average (DJIA) bounced back on Friday, climbing around 220 points to trade near 49,665 after opening at 49,366. The recovery followed Thursday's punishing 669-point selloff that was driven by fears of AI-led disruption across software, trucking, and real estate sectors. The S&P 500 edged higher, while the Nasdaq Composite traded mixed as investors digested a cooler-than-expected Consumer Price Index (CPI) report alongside a flood of after-hours earnings. Despite Friday's bounce, all three major indexes remain on pace for weekly losses, with the S&P 500 tracking its worst week since November.
January inflation report undercuts hawkish rate expectations
The Bureau of Labor Statistics (BLS) reported that the CPI rose 0.2% MoM in January, below the 0.3% consensus estimate. On a year-over-year basis, headline CPI came in at 2.4%, undershooting the 2.5% forecast and marking a meaningful deceleration from December's 2.7% reading. Core CPI, which strips out food and energy, printed in line at 0.3% month-over-month and 2.5% year-over-year. The softer-than-expected headline figures immediately reshuffled rate cut expectations. The CME FedWatch Tool showed the probability of a first Federal Reserve (Fed) rate cut in June surging to approximately 83%, up dramatically from below 50% just two days earlier, when the better-than-expected January Nonfarm Payrolls (NFP) report of 130K jobs had pushed traders toward a "higher for longer" stance. Money markets are now pricing in around 63 basis points of Fed rate reductions for 2026, equivalent to roughly a 50% chance of a third cut by December. The data carries extra weight as markets await the Fed's leadership transition, with incoming Chair Kevin Warsh expected to take the reins from Jerome Powell in May.
AI infrastructure demand lifts Applied Materials, Rivian soars on delivery outlook
Applied Materials (AMAT) surged roughly 12% after delivering a first-quarter earnings beat driven by accelerating semiconductor equipment demand tied to the AI buildout. The company reported adjusted earnings per share (EPS) of $2.38 on revenue of $7.01 billion, both well above the consensus estimates of $2.20 and $6.87 billion, respectively. The company guided for its semiconductor equipment business to expand over 20% this calendar year. Rivian Automotive (RIVN) rocketed more than 20% after posting narrower-than-expected losses and issuing 2026 delivery guidance of 62K to 67K vehicles, representing growth of 47% to 59% versus 2025. Roku (ROKU) gained around 10% on a fourth-quarter earnings beat and bullish 2026 guidance of $5.5 billion in revenue, well above the $5.34 billion consensus.
Pinterest and DraftKings tumble on soft guidance
On the losing side, Pinterest (PINS) plunged over 20% after posting disappointing fourth-quarter results and guiding first-quarter revenue of $951 million to $971 million, missing the $981 million consensus. Baird downgraded the stock to neutral, citing advertiser headwinds. DraftKings (DKNG) cratered roughly 17% after its 2026 revenue guidance of $6.5 billion to $6.9 billion came in far below the $7.31 billion Wall Street estimate, despite a fourth-quarter EPS beat. The earnings miss highlights the growing divergence between AI-linked hardware names, which continue to benefit from infrastructure spending, and consumer-facing platforms struggling with advertising softness and competitive pressures.
Dow Jones technicals
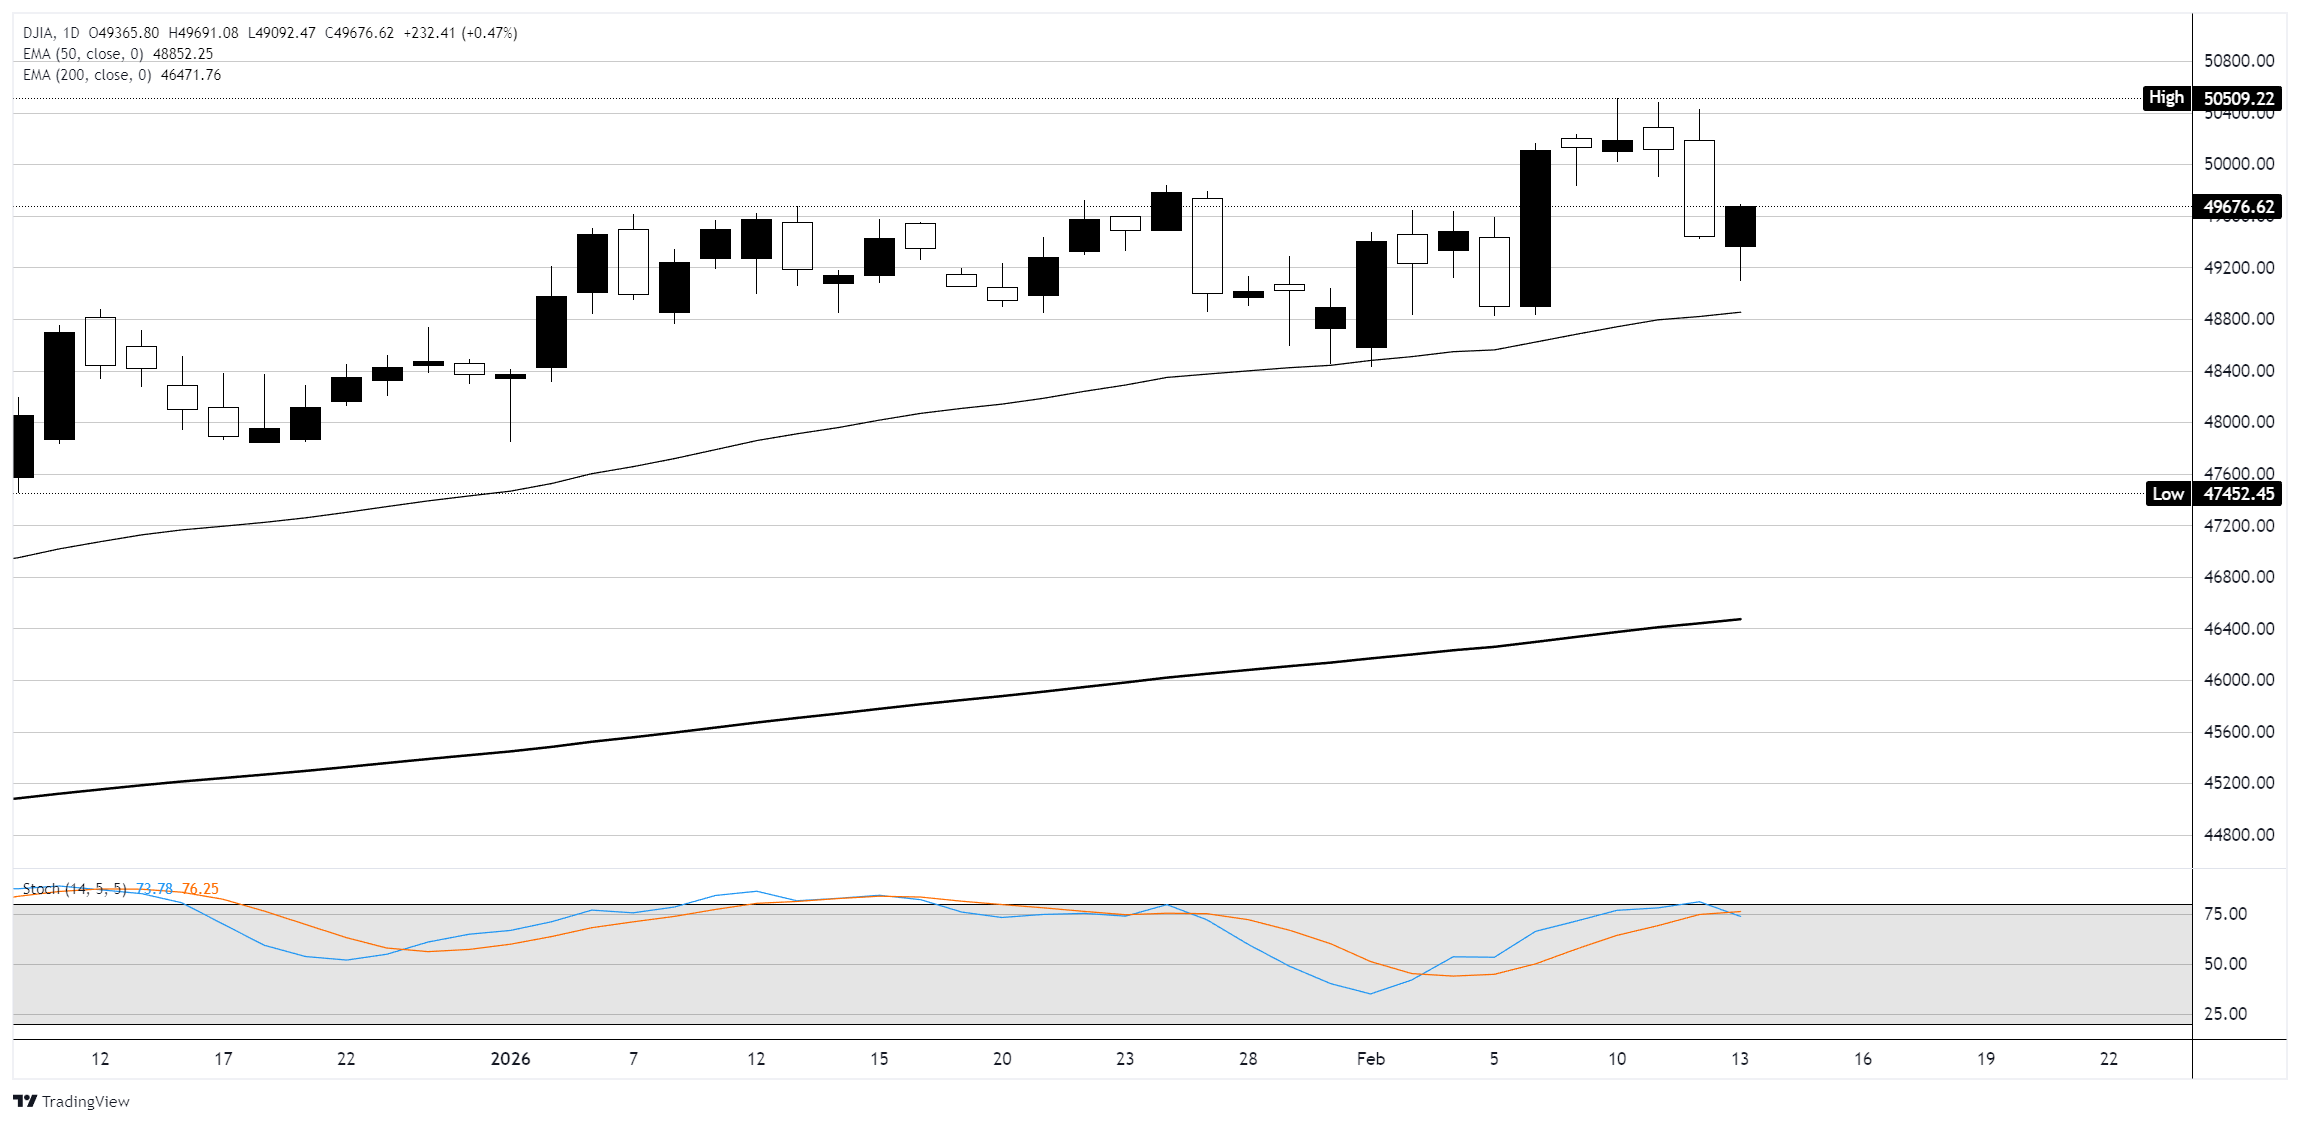
The DJIA opened Friday at 49,366 and pushed to an intraday high of 49,670, trading near the 49,665 level in the afternoon session. The index remains well above its 50-day EMA at 48,852 and its 200-day EMA at 46,472. The stochastic oscillator (14,5,5) is reading 73.67/76.23, approaching overbought territory near the 75 level. Overhead resistance sits at the recent swing high near 50,509, while Friday's intraday low of 49,092 marks immediate support. A sustained move above the 50,000 psychological level would signal bulls have regained control after this week's volatility, while a failure to hold the 49,000 handle would open the door toward the 48,800-48,900 zone.
Dow Jones daily chart
Dow Jones FAQs
The Dow Jones Industrial Average, one of the oldest stock market indices in the world, is compiled of the 30 most traded stocks in the US. The index is price-weighted rather than weighted by capitalization. It is calculated by summing the prices of the constituent stocks and dividing them by a factor, currently 0.152. The index was founded by Charles Dow, who also founded the Wall Street Journal. In later years it has been criticized for not being broadly representative enough because it only tracks 30 conglomerates, unlike broader indices such as the S&P 500.
Many different factors drive the Dow Jones Industrial Average (DJIA). The aggregate performance of the component companies revealed in quarterly company earnings reports is the main one. US and global macroeconomic data also contributes as it impacts on investor sentiment. The level of interest rates, set by the Federal Reserve (Fed), also influences the DJIA as it affects the cost of credit, on which many corporations are heavily reliant. Therefore, inflation can be a major driver as well as other metrics which impact the Fed decisions.
Dow Theory is a method for identifying the primary trend of the stock market developed by Charles Dow. A key step is to compare the direction of the Dow Jones Industrial Average (DJIA) and the Dow Jones Transportation Average (DJTA) and only follow trends where both are moving in the same direction. Volume is a confirmatory criteria. The theory uses elements of peak and trough analysis. Dow’s theory posits three trend phases: accumulation, when smart money starts buying or selling; public participation, when the wider public joins in; and distribution, when the smart money exits.
There are a number of ways to trade the DJIA. One is to use ETFs which allow investors to trade the DJIA as a single security, rather than having to buy shares in all 30 constituent companies. A leading example is the SPDR Dow Jones Industrial Average ETF (DIA). DJIA futures contracts enable traders to speculate on the future value of the index and Options provide the right, but not the obligation, to buy or sell the index at a predetermined price in the future. Mutual funds enable investors to buy a share of a diversified portfolio of DJIA stocks thus providing exposure to the overall index.
추천 기사


