


Crypto Today: Bitcoin, Ethereum, XRP trim gains amid declining ETF inflows and profit-taking
- Bitcoin encounters volatility and slips toward $116,000 as investors book profits from the rally to record highs.
- Ethereum bears take back control as ETH drops below $3,000 ahead of US CPI data.
- XRP faces a fresh sell-off following Monday's rally, slightly above $3.00, ahead of the ProShares XRP Futures ETF launch.
The cryptocurrency market is experiencing a sudden spike in volatility on Tuesday following a robust bullish wave the previous day. Bitcoin (BTC) is trading at $116,918, down over 2% in the day as investors book profits ahead of the release of the United States (US) Consumer Price Index (CPI) data for June.
Altcoins have also run into heightened volatility, led by Ethereum's (ETH) drop below the pivotal $3,000 level and Ripple's (XRP) pullback below Monday's highs of around $3.02.
Market overview: Bitcoin, Ethereum, XRP clawback gains ahead of US CPI data
Bitcoin's rally to new all-time highs of $123,218 marked a 16% increase since July 1. The uptrend, which was primarily driven by "a decisive technical breakout and a sharp pickup in institutional demand," according to QCP Capital, is taking a breather on Tuesday as investors shift focus to the release of US inflation data.
In May, the CPI rose 2.4% on an annual basis, up from 2.3% in April but below market expectations of 2.5%. The core CPI, which excludes the volatile prices of food and energy, increased 2.8% in May, matching a similar increase in April. On a monthly basis, both the CPI and the core CPI rose by 0.1%, falling below expert estimates of 0.2% and 0.3%, respectively.
Market participants expect June's CPI to rise at a yearly rate of 2.7%, with the core CPI expected to increase by 3%, reflecting the potential for higher inflation in the US.
Volatility is expected to characterize trading on Tuesday ahead of the inflation data release, with favorable outcomes likely to increase institutional appetite for riskier assets, such as Bitcoin, Ethereum, and XRP.
Data spotlight: Bitcoin spot ETF inflows shrink
Prior to the Bitcoin price hitting new record highs, the US spot ETF experienced two consecutive days of inflows surpassing $1 billion. SoSoValue data highlights approximately $1.18 billion in net inflow on Thursday, with $1.03 billion streaming in on Friday.
Institutional appetite for Bitcoin as an alternative hedge asset against macroeconomic uncertainty, particularly surrounding tariffs in the US, catalyzed the rally to new record highs.
However, with June's CPI data expected to rise, investors are taking precautions, considering the significant drop in spot ETF inflow volume to around $297 million, as recorded on Monday.
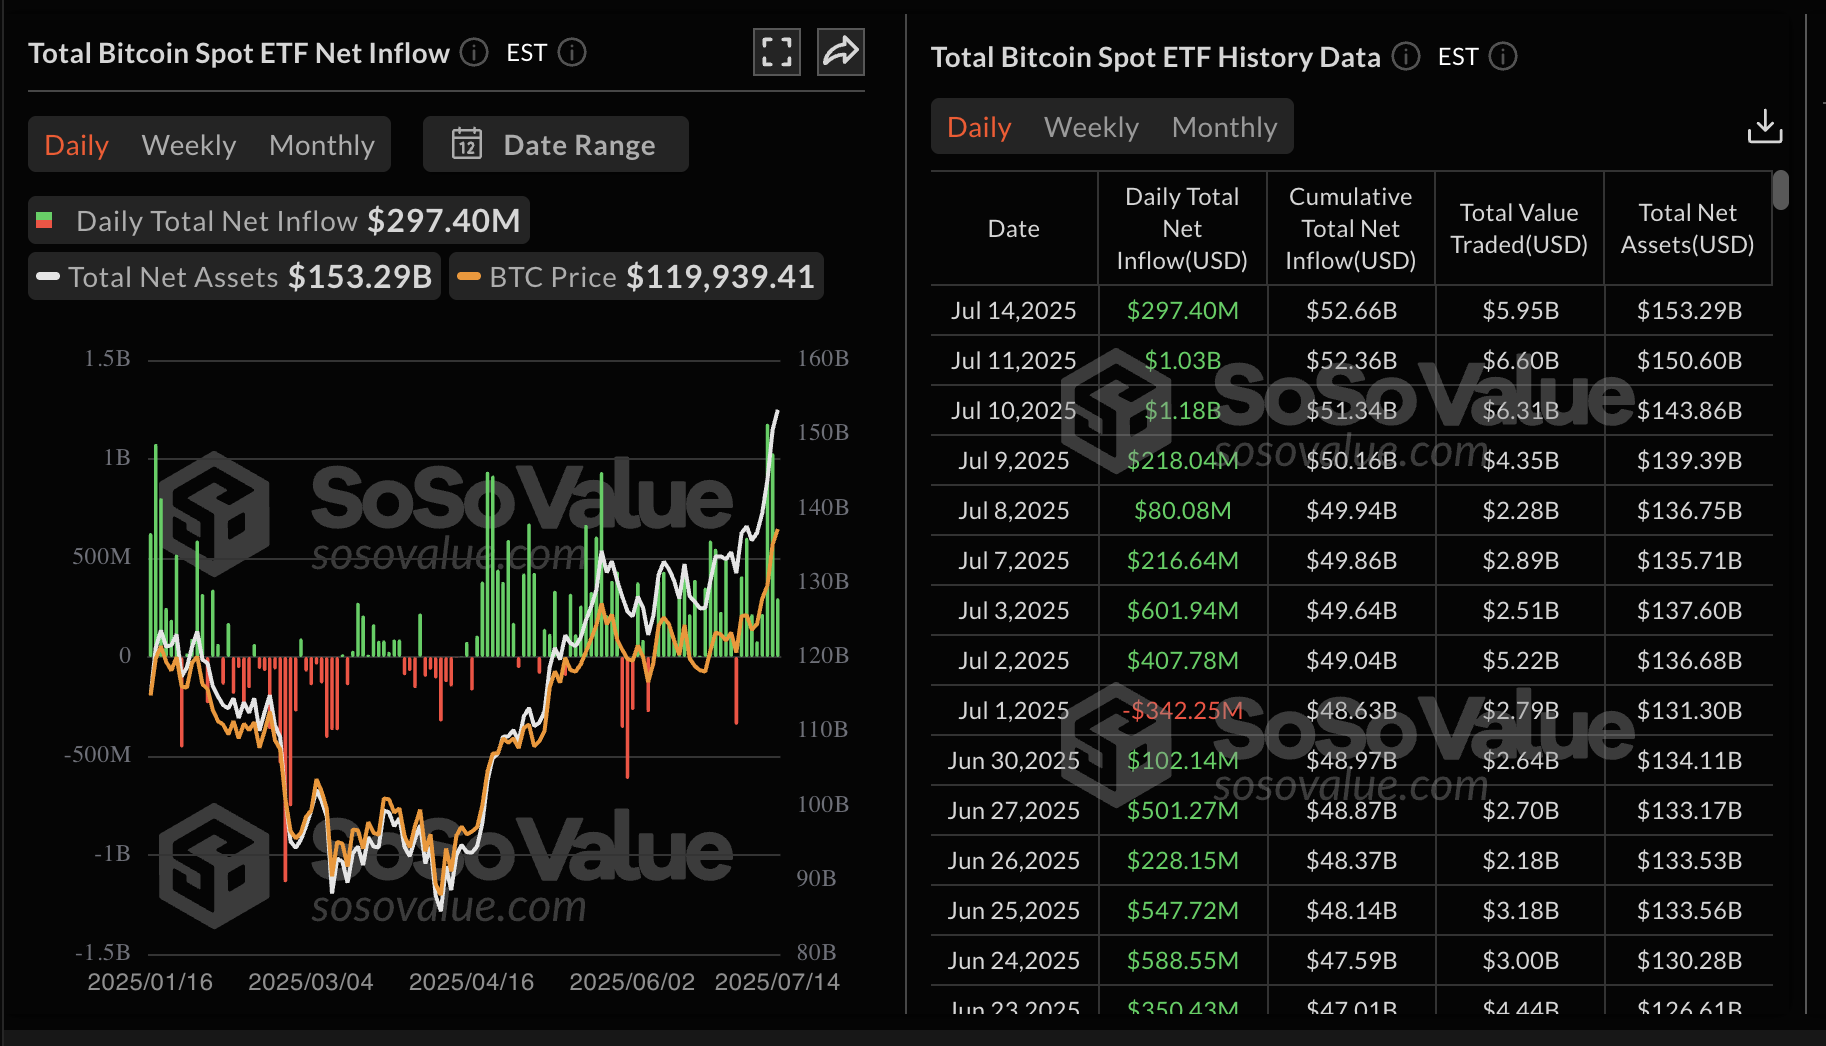
Bitcoin spot ETF data | Source: SoSoValue
The Ethereum spot ETFs' uptrend held steady on Monday, with inflows increasing to $259 million from approximately $205 million on Friday. This marked the seventh consecutive day of inflows, underscoring institutional risk-on sentiment.
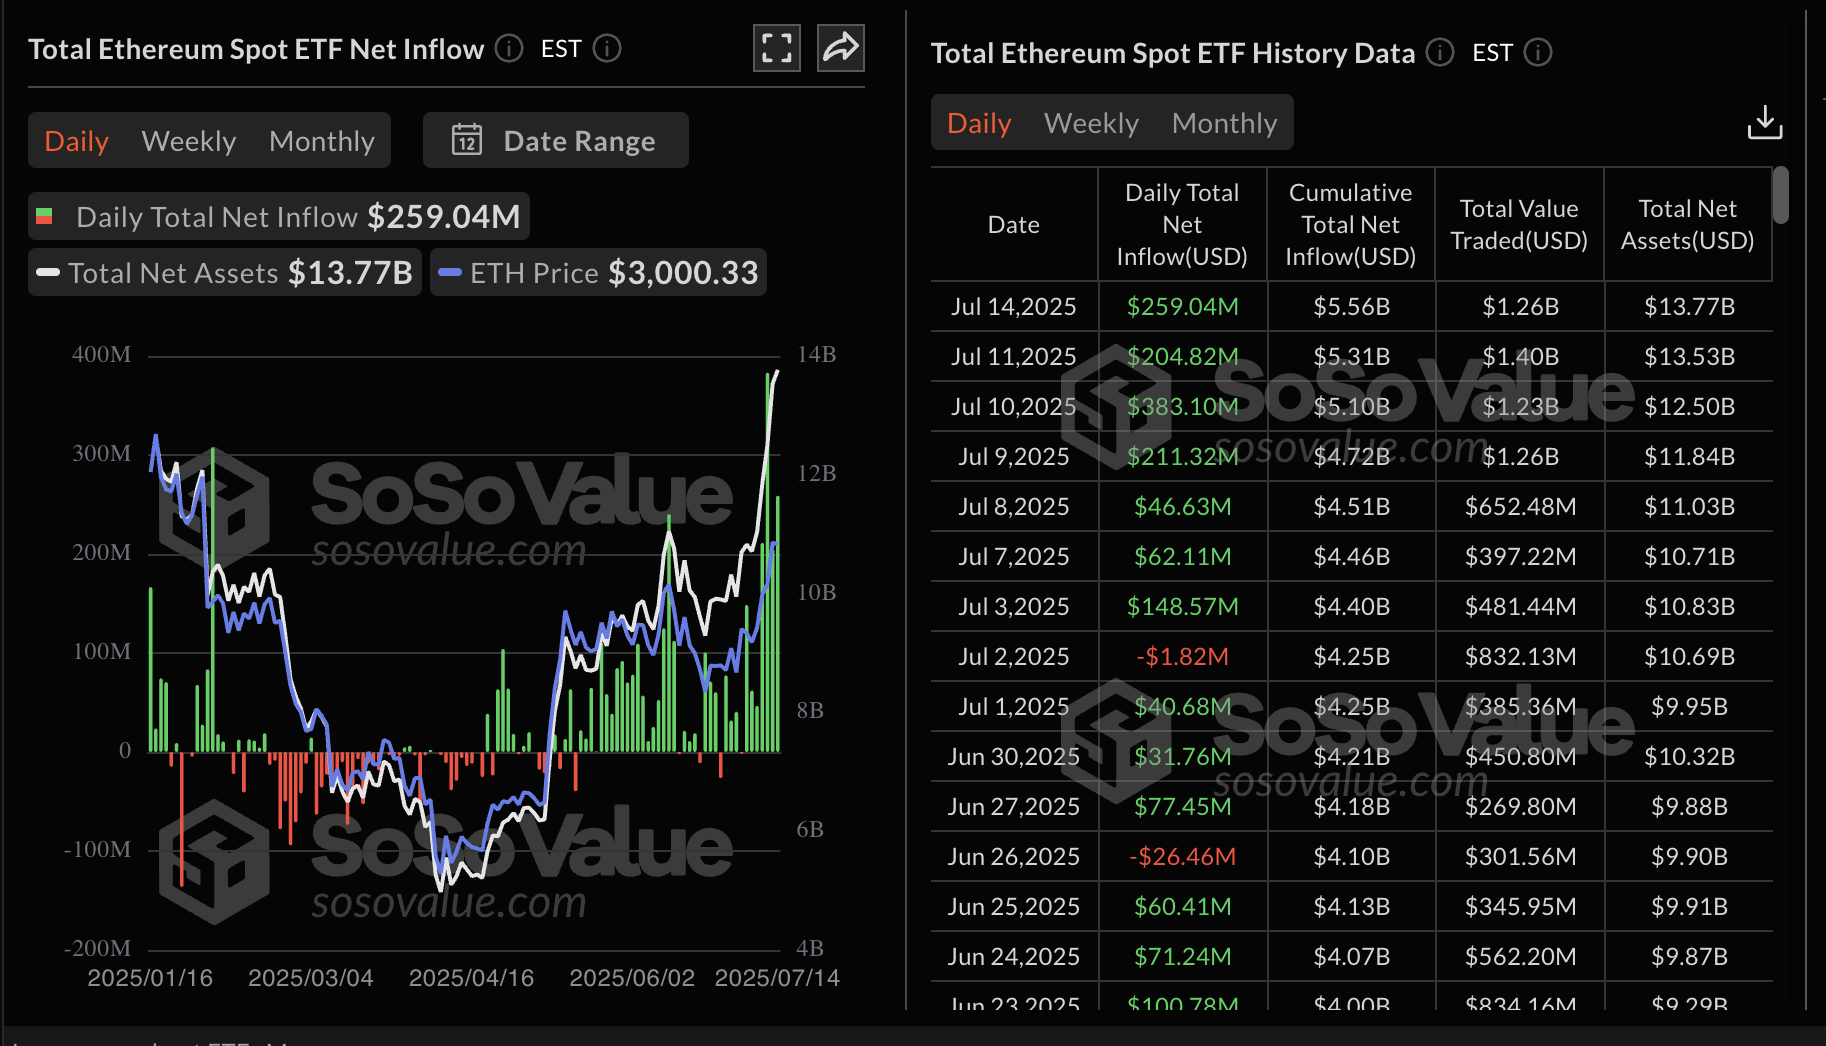
Ethereum spot ETF data | Source: SoSoValue
Chart of the day: Can Bitcoin resume the uptrend?
The Bitcoin price trades 5% below its all-time high, reflecting increased volatility and profit-taking activity. The Relative Strength Index (RSI) reversal from overbought territory into the neutral area on the daily chart indicates fading bullish momentum, which could encourage traders to reduce their exposure.
If the decline persists, tentative support could emerge from a buyer congestion zone between $115,000 and $116,000, as tested on Friday.
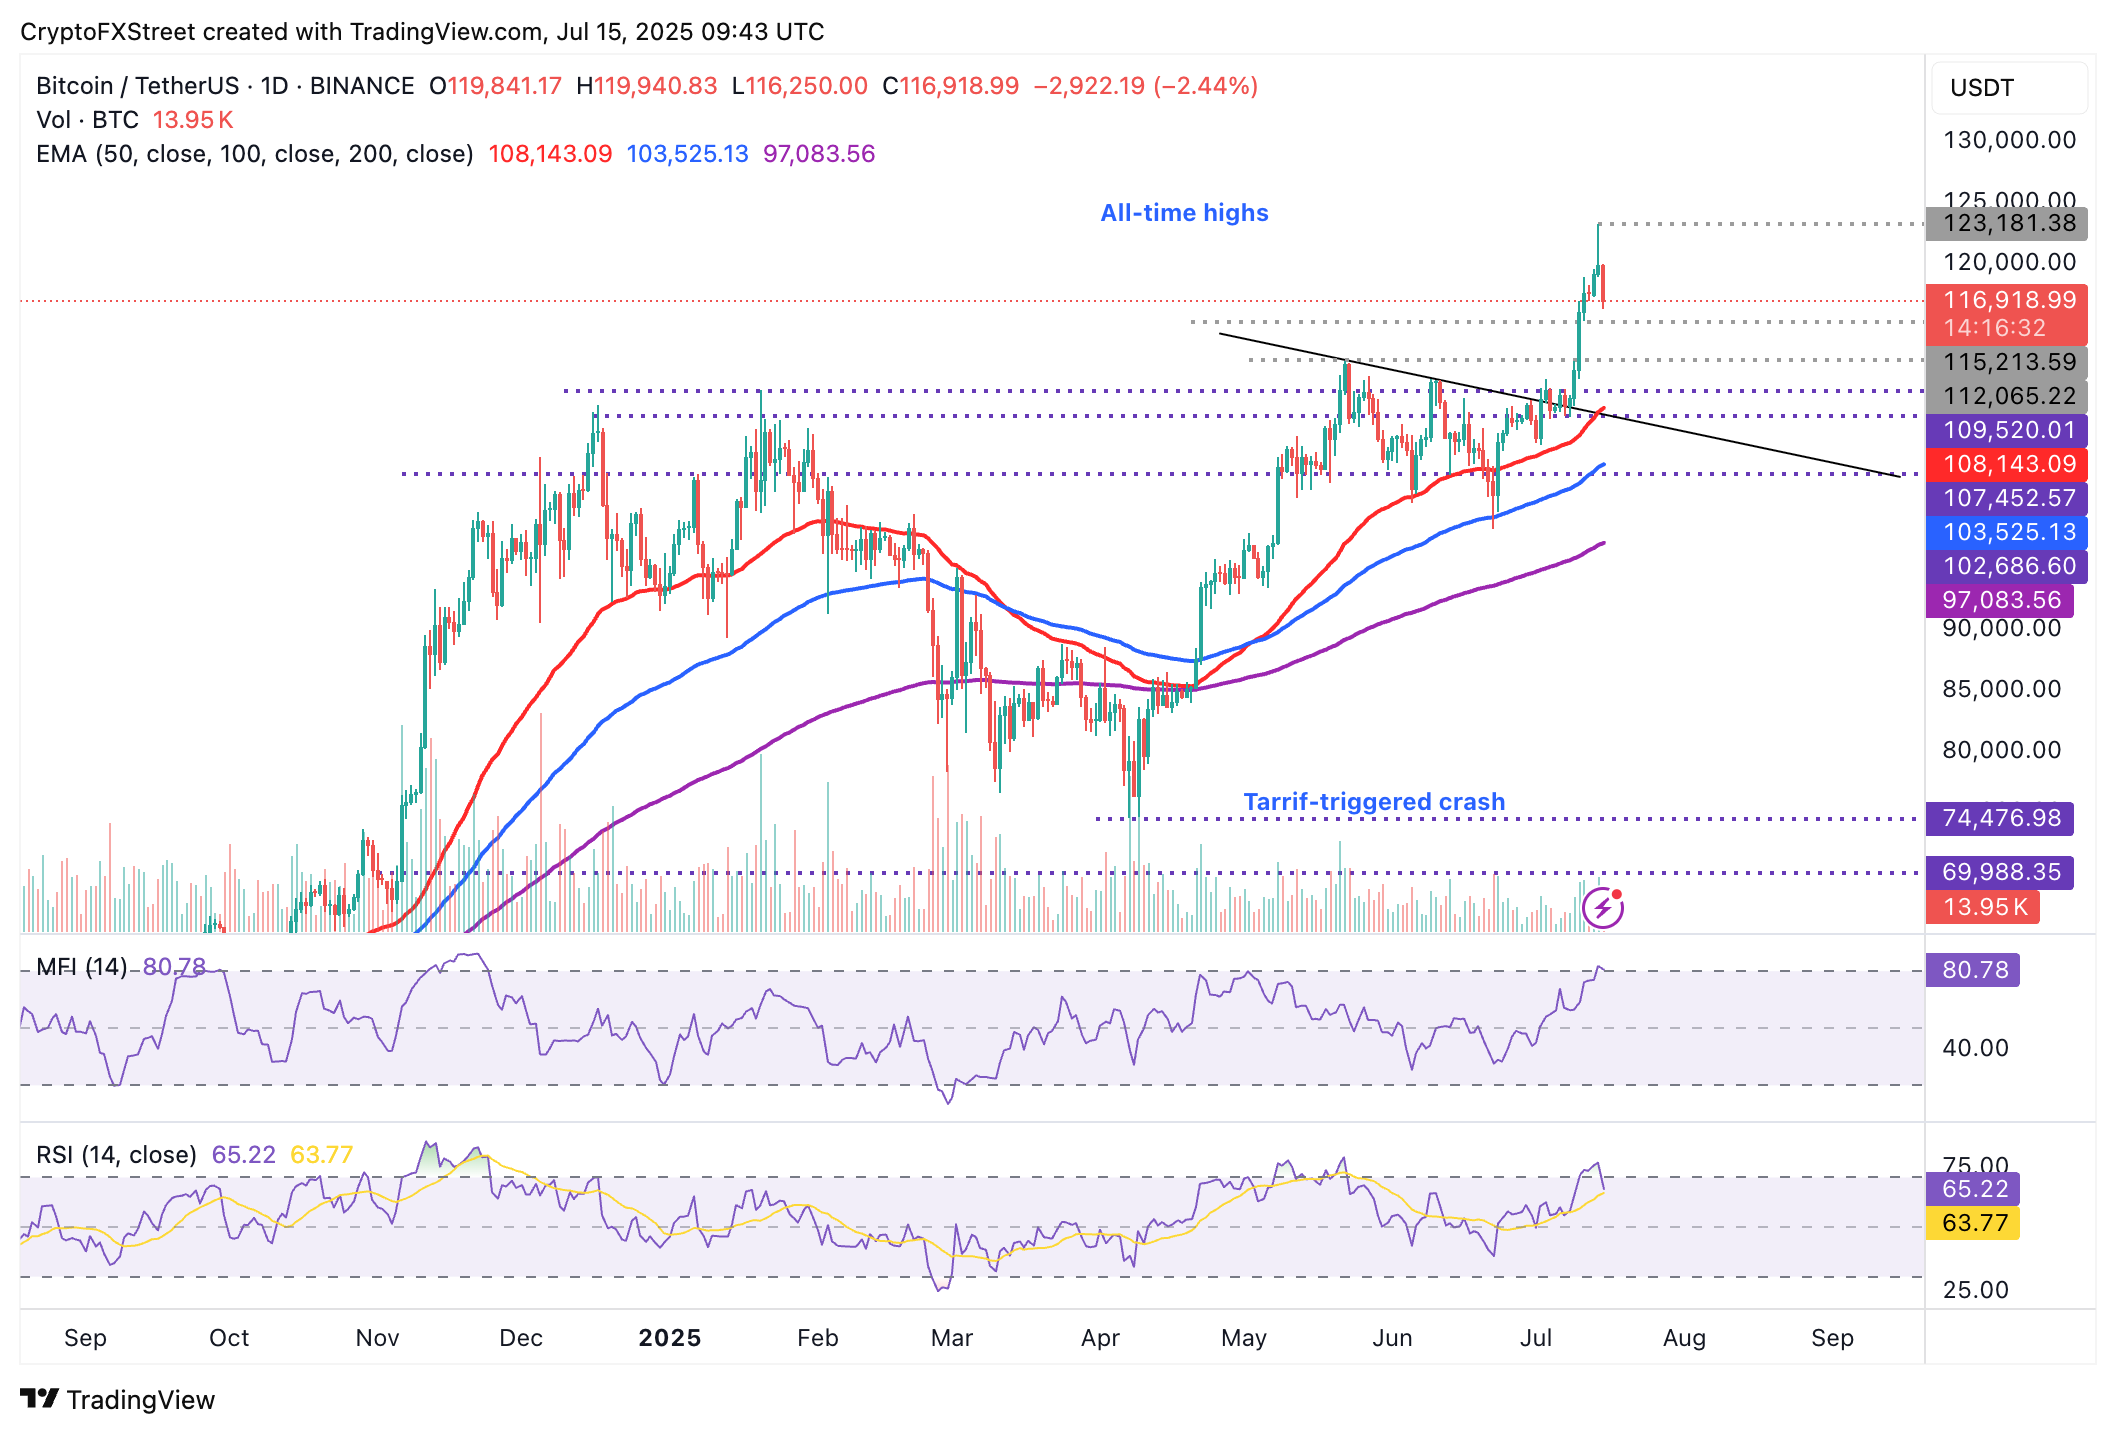
BTC/USDT daily chart
Still, the uptrend could resume if traders hold steady, as reflected by the Money Flow Index (MFI) moving flat-out at around 80. This tool tracks the amount of money entering or leaving BTC. If it resumes the uptrend, higher demand for BTC could boost the tailwind, thereby pushing the price above $120,000.
Altcoins update: Ethereum, XRP uptrend at risk
Ethereum price is currently trading at $2,976, following a rejection from around $3,084. Despite the pullback, bulls showcase resilience, with the RSI holding near overbought territory and the MFI indicator moving horizontally at 78.
If the correction persists due to US CPI data-related volatility, traders could look toward levels at $2,880 and $2,664, which were tested in June and early July, respectively, for short-term support.
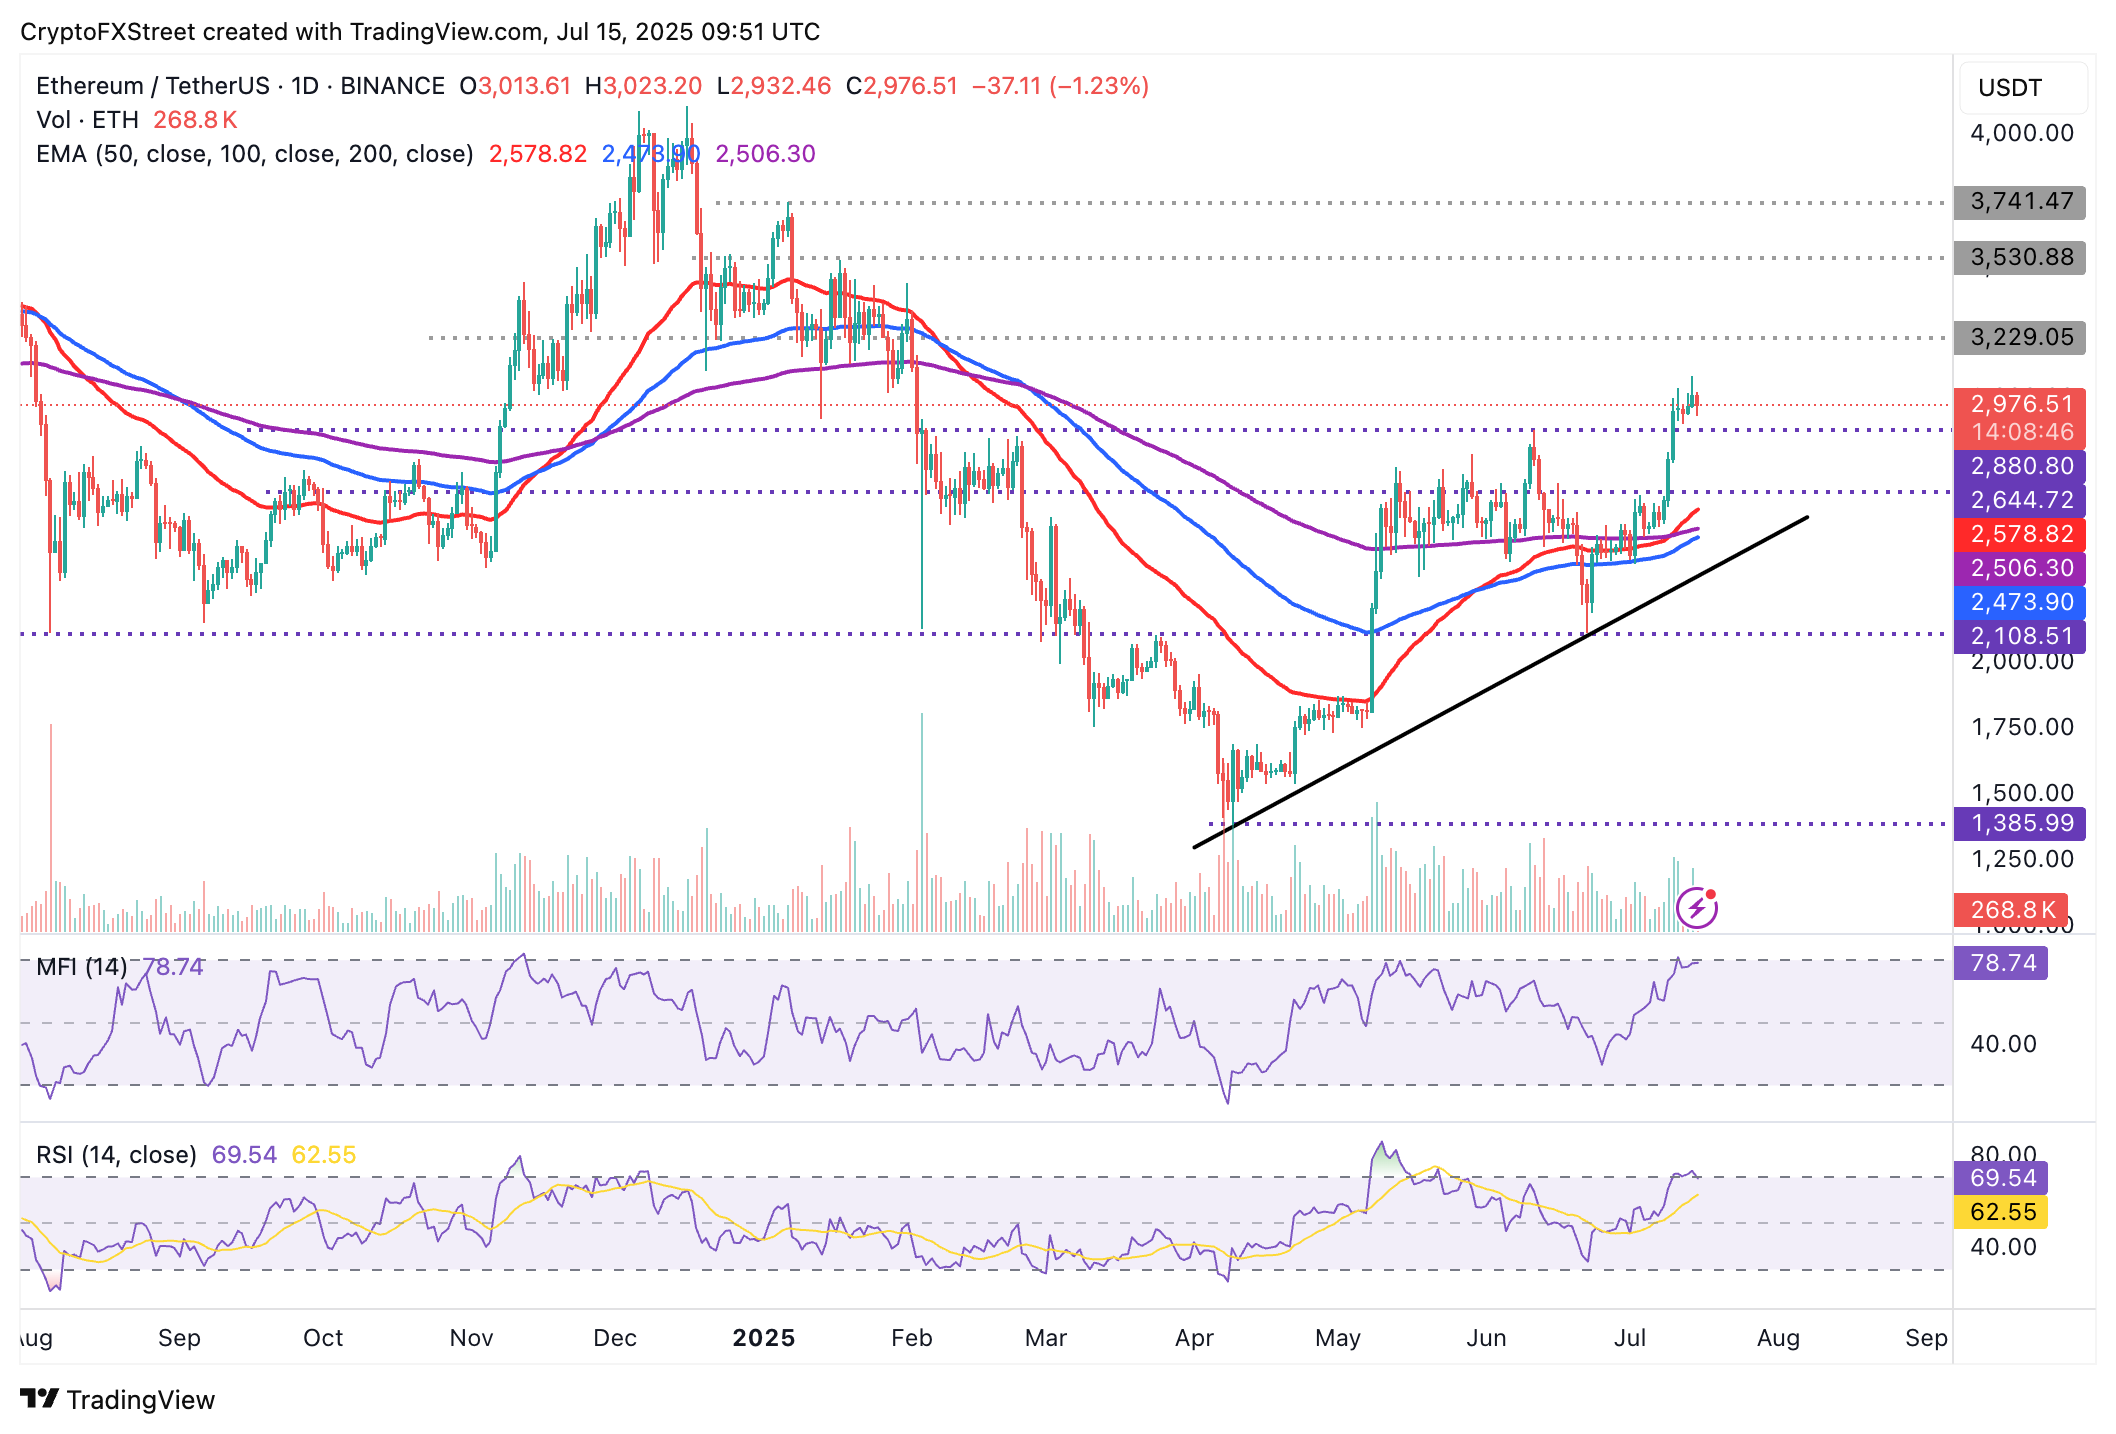
ETH/USDT daily chart
As for XRP, the path of least resistance is shifting downward, accentuated by the RSI falling to 77 from Monday's peak of 83. Traders should monitor the RSI for an extended drop into the neutral region, which could accelerate the down leg toward $2.65, a resistance level that has become support, and the 50-day Exponential Moving Average (EMA) at $2.34.
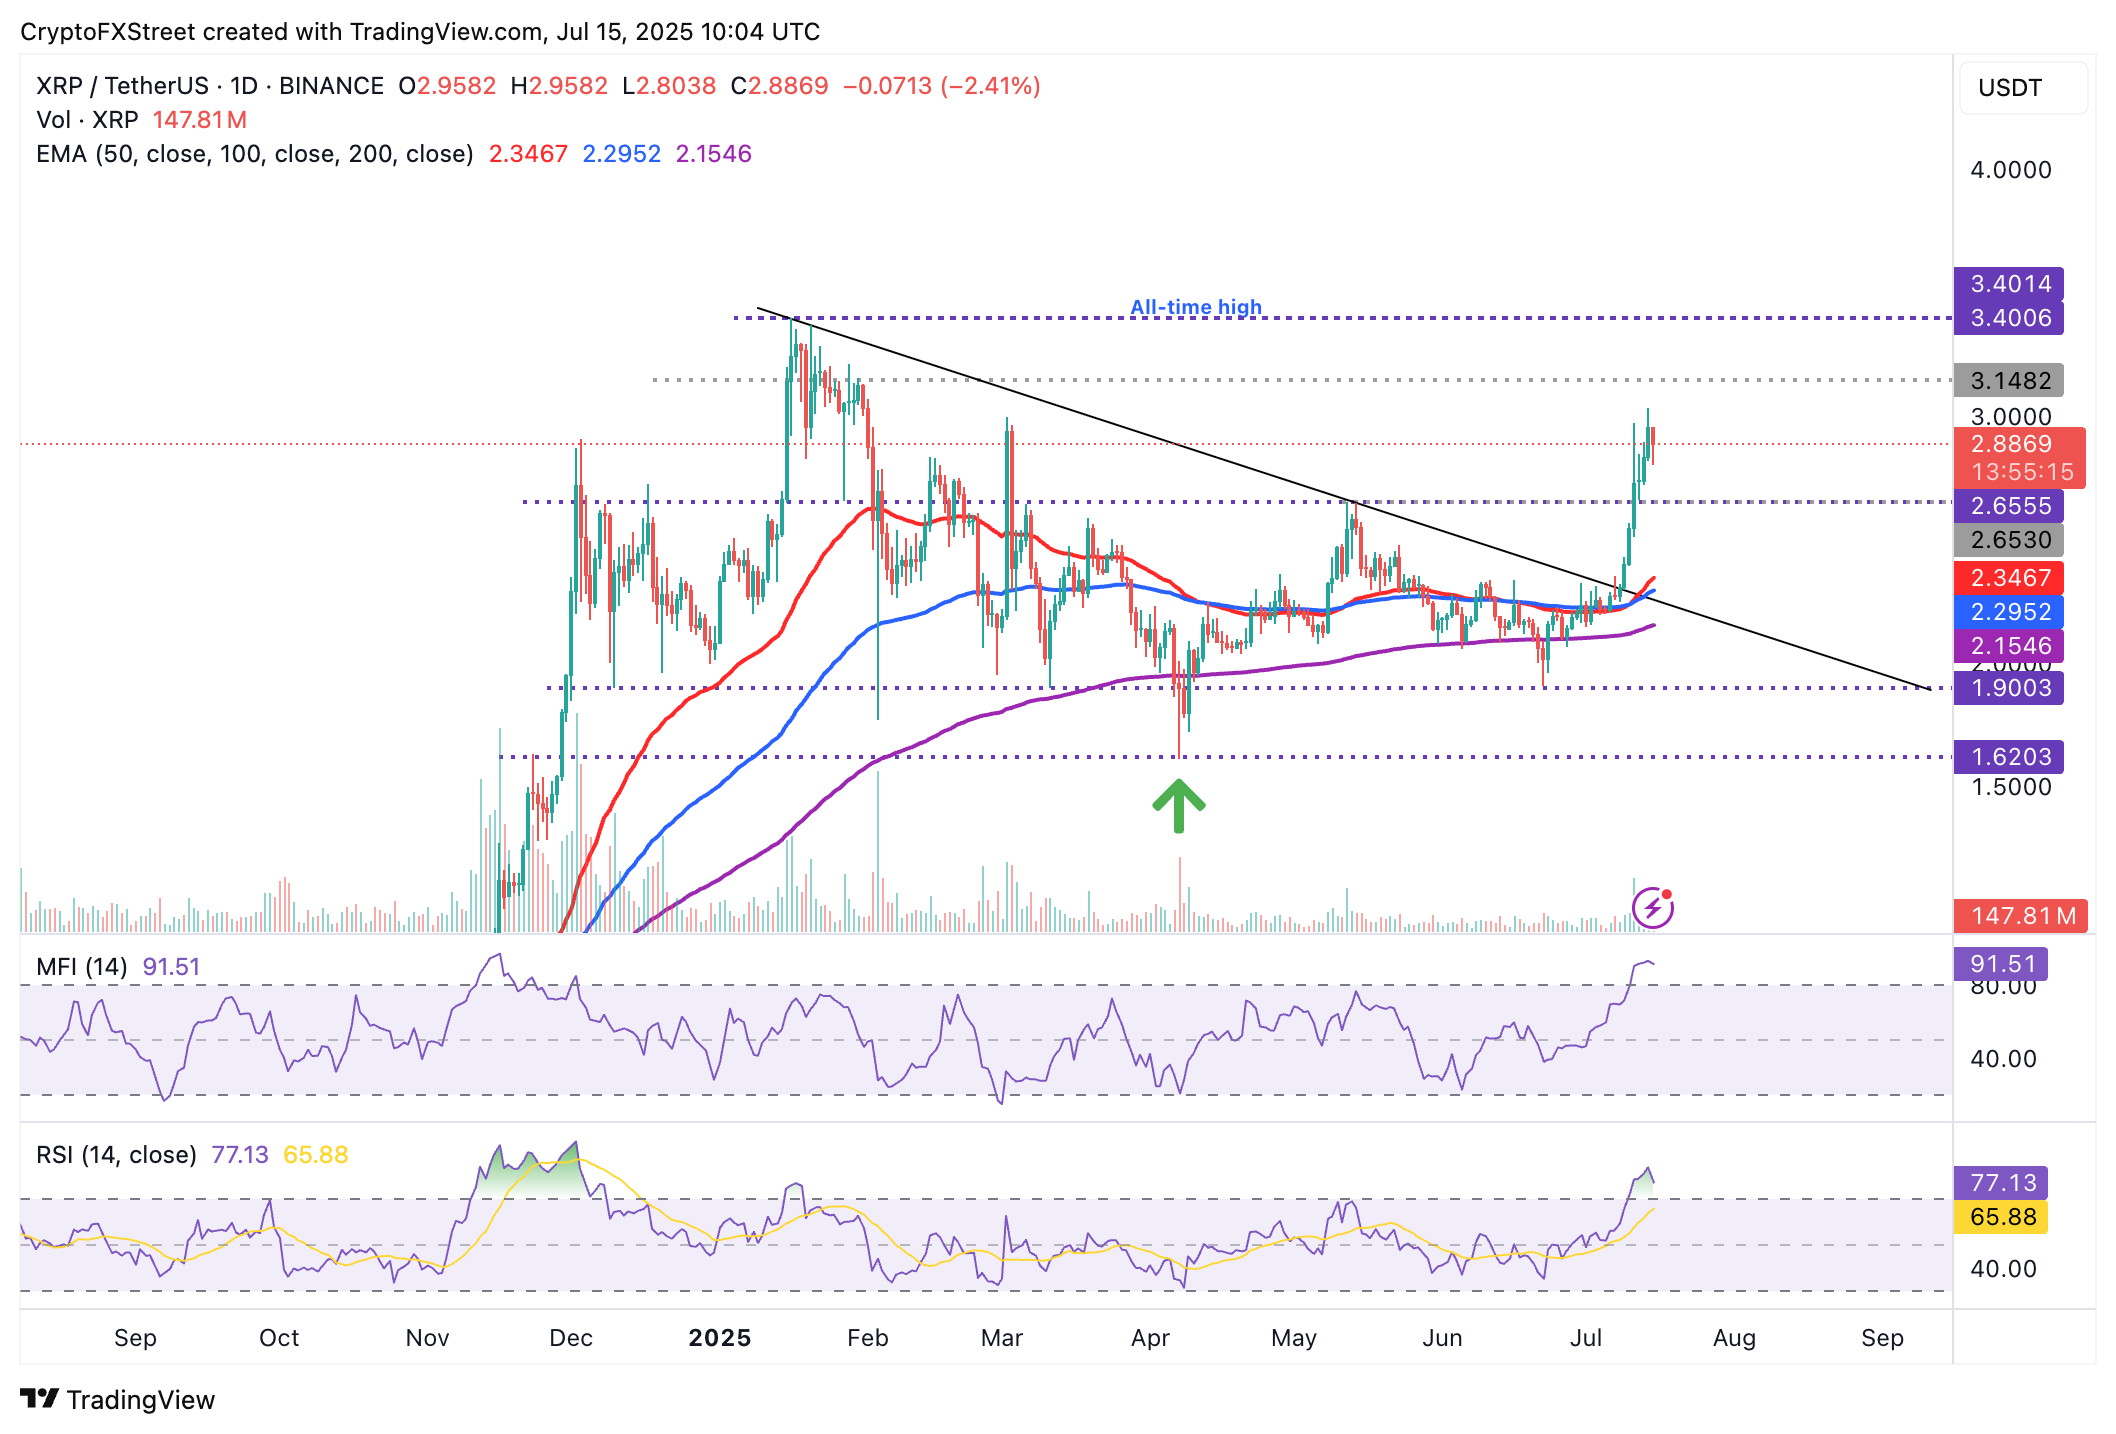
XRP/USDT daily chart
The approval of the ProShares Ultra XRP ETF, a futures product with 2x leveraged exposure to XRP price action, by NYSE Arca could boost interest in the cross-border token. The XRP futures ETF is expected to trade on NYSE Arca under the ticker UXRP.
ProShares plans to launch two additional products: The Short XRP ETF (XRPS) and the UltraShort XRP ETF (RIPS), according to a filing with the Securities and Exchange Commission (SEC) on Monday.
The adoption of XRP and related financial products in the broader cryptocurrency market, along with these products, could boost interest in the token and catalyze the next breakout above $3.00 while targeting record highs.
Cryptocurrency metrics FAQs
The developer or creator of each cryptocurrency decides on the total number of tokens that can be minted or issued. Only a certain number of these assets can be minted by mining, staking or other mechanisms. This is defined by the algorithm of the underlying blockchain technology. On the other hand, circulating supply can also be decreased via actions such as burning tokens, or mistakenly sending assets to addresses of other incompatible blockchains.
Market capitalization is the result of multiplying the circulating supply of a certain asset by the asset’s current market value.
Trading volume refers to the total number of tokens for a specific asset that has been transacted or exchanged between buyers and sellers within set trading hours, for example, 24 hours. It is used to gauge market sentiment, this metric combines all volumes on centralized exchanges and decentralized exchanges. Increasing trading volume often denotes the demand for a certain asset as more people are buying and selling the cryptocurrency.
Funding rates are a concept designed to encourage traders to take positions and ensure perpetual contract prices match spot markets. It defines a mechanism by exchanges to ensure that future prices and index prices periodic payments regularly converge. When the funding rate is positive, the price of the perpetual contract is higher than the mark price. This means traders who are bullish and have opened long positions pay traders who are in short positions. On the other hand, a negative funding rate means perpetual prices are below the mark price, and hence traders with short positions pay traders who have opened long positions.
추천 기사


