


Crypto Today: Bitcoin aims for $110,000 as Ethereum, XRP derivatives show signs of life again
- Bitcoin consolidates gains above $106,000, backed by steady BTC treasuries inflows.
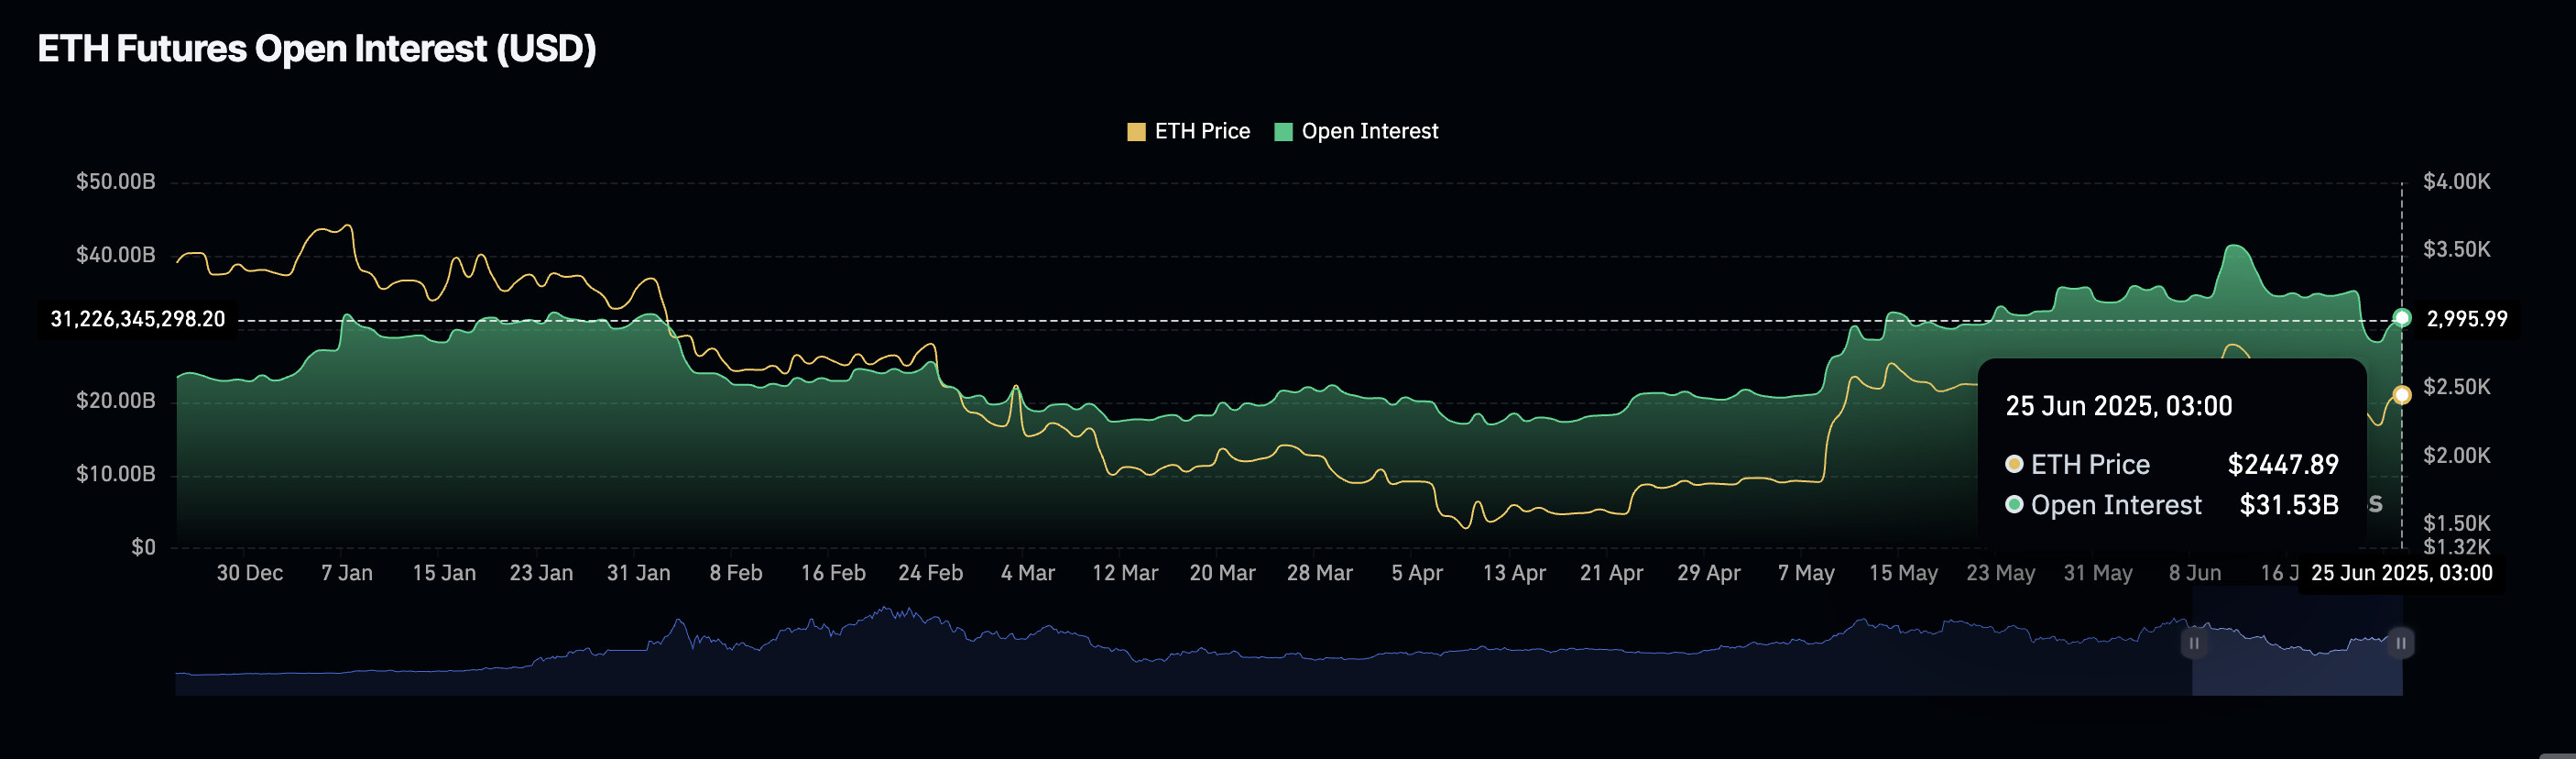
- Ethereum attempts a breakout but stalls below the 200-day EMA at $2,470 even as ETH futures Open Interest rebounds.
- XRP struggles to sustain its uptrend, pausing under the 50-day EMA at $2.17, as futures contracts' Open Interest stabilizes around $3.76 billion.
Cryptocurrencies show signs of extending gains on Wednesday, following a sharp recovery from the weekend sell-off, which saw Bitcoin (BTC) slip below the $100,000 mark. The ceasefire between Israel and Iran continues to bolster sentiment in the market, as reflected by BTC's steady rise, which now trades at around $106,839 at the time of writing.
Leading altcoins, including Ethereum (ETH) and Ripple (XRP), are consolidating gains, supported by a spike in investor interest as indicated by the uptick in the derivatives market's Open Interest (OI).
Data spotlight: Bitcoin treasuries weekly inflows near $200 million
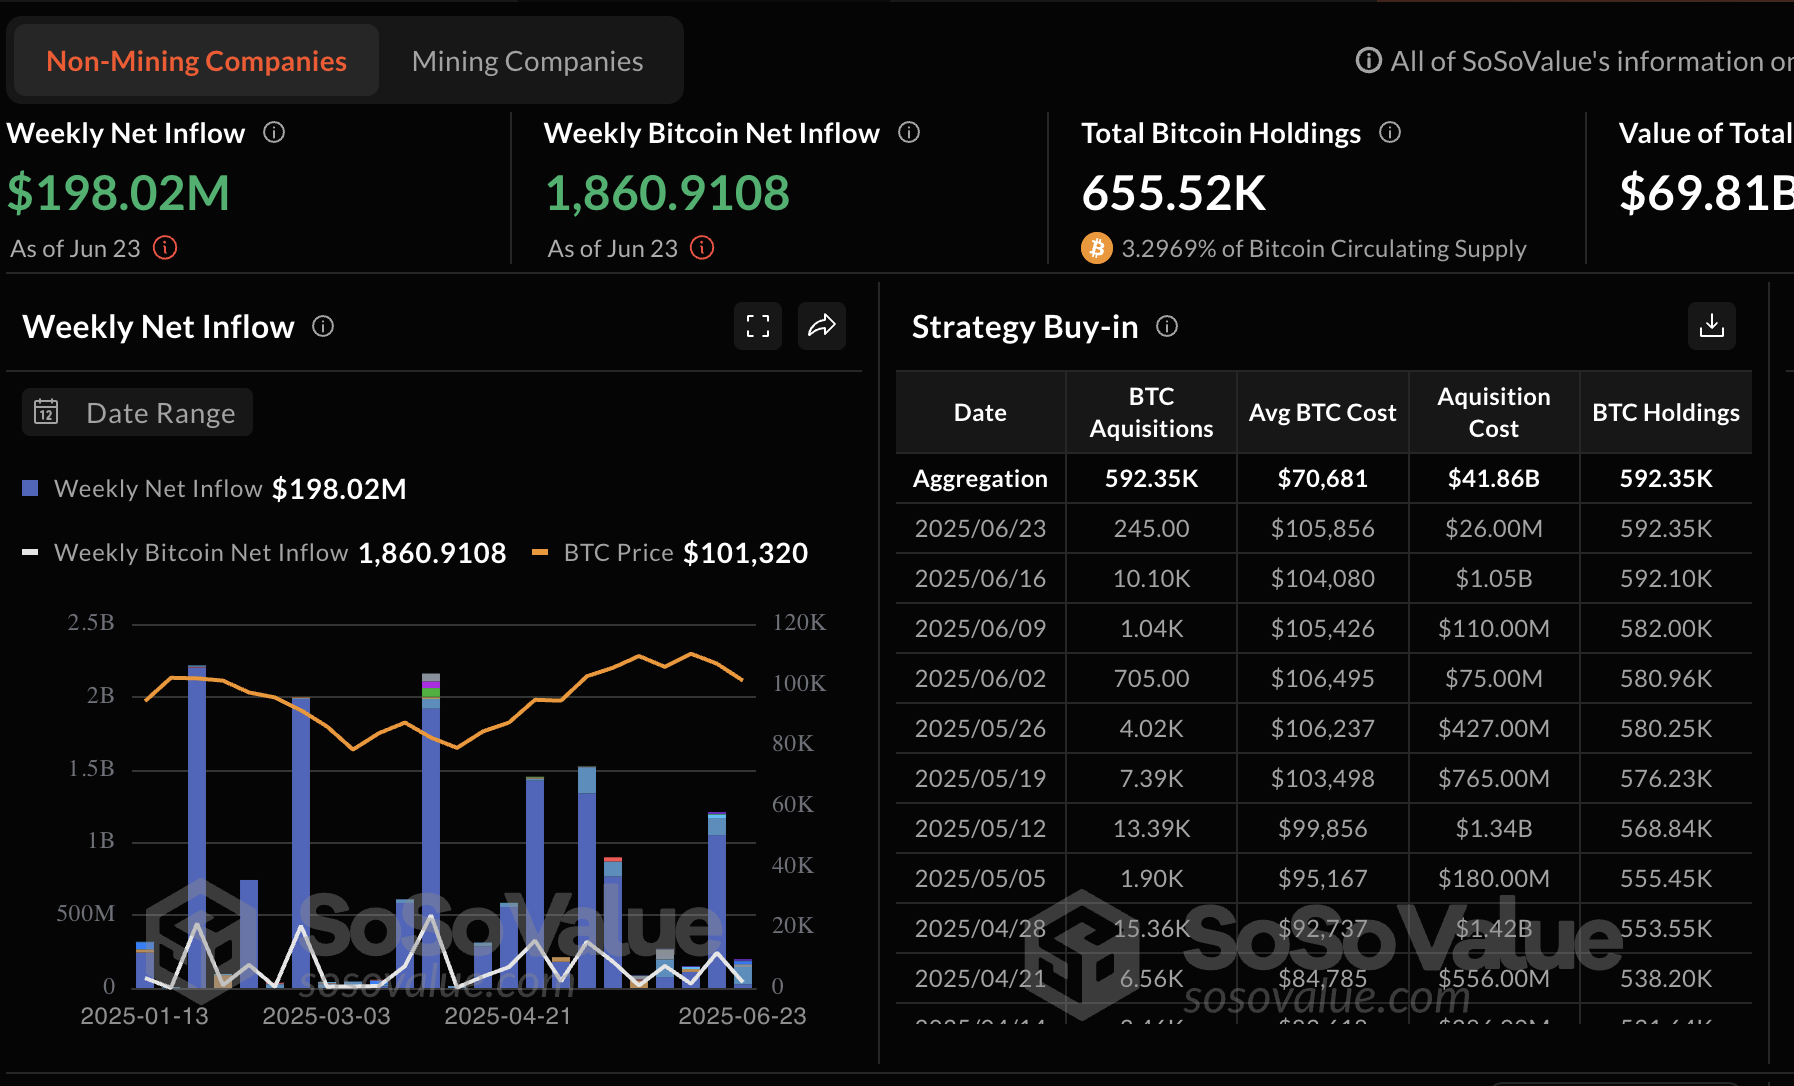
Institutional interest in Bitcoin has not faltered despite Middle East tensions, highlighting the role played by BTC as a hedge against uncertainty. According to SoSoValue, weekly net inflow into BTC treasury funds reached $198 million as of Monday, bringing the cumulative holdings to approximately $70 billion spread across 21 companies.
Strategy remains the largest corporate holder of Bitcoin, with 592,345 BTC valued at around $63 billion. Elon Musk's Tesla is in the second position with 11,509 BTC valued at $1.23 billion, followed by Metaplanet with 11,111 BTC valued at $1.18 billion.
Bitcoin treasury holdings | Source: SoSoValue
Bitcoin spot Exchange Traded Funds ( ETFs) gained momentum on Tuesday, reaching $589 million from approximately $350 million recorded on Monday. BlackRock's IBIT led with the highest daily net inflow of $436 million, followed by Fidelity's FBTC with $85 million.
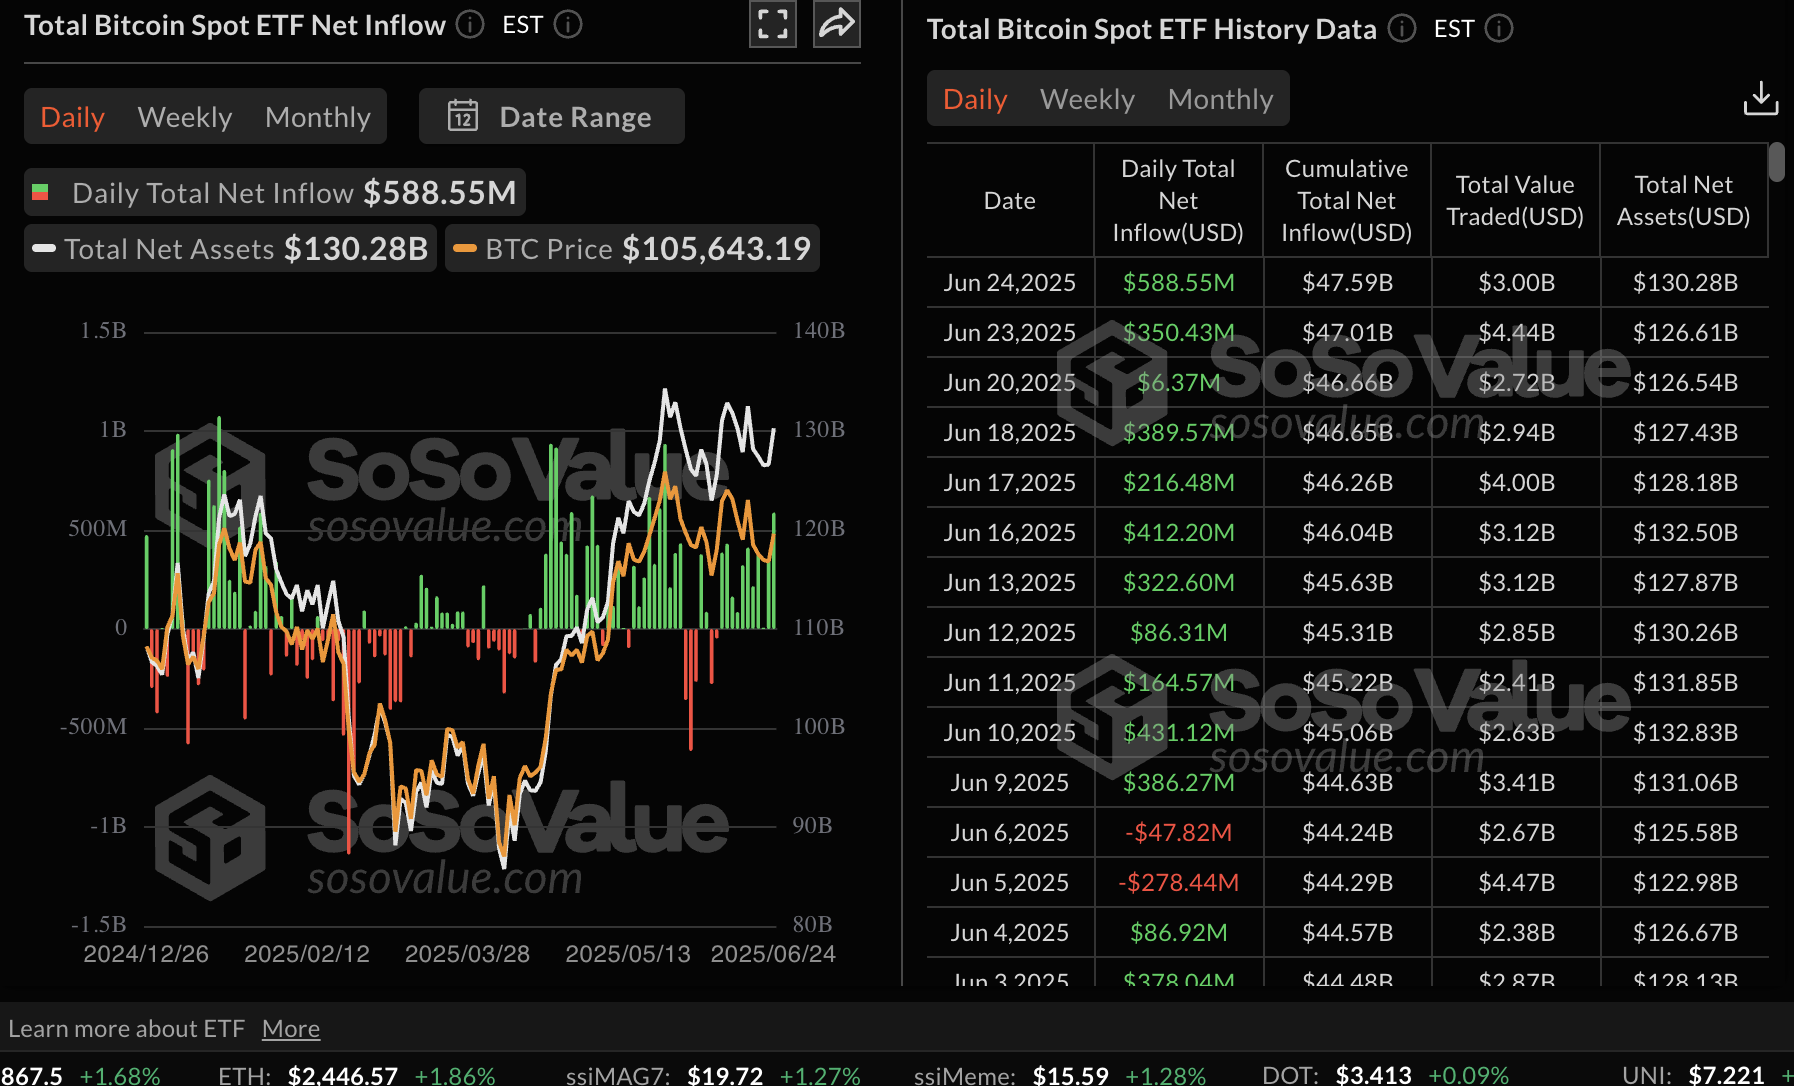
Bitcoin spot ETF data | Source: SoSoValue
Chart of the day: Bitcoin extends recovery
Bitcoin's price is approaching the next short-term resistance at $107,000 after confirming support above $106,000. The uptrend reflects steady investor interest in BTC, which significantly increases the probability of a breakout past the round-number hurdle at $110,000, last tested in early June.
The Moving Average Convergence Divergence (MACD) indicator is on the cusp of validating a buy signal on the daily chart below. This signal, which often encourages traders to increase their exposure to BTC, will manifest when the blue MACD line crosses above the red signal line.
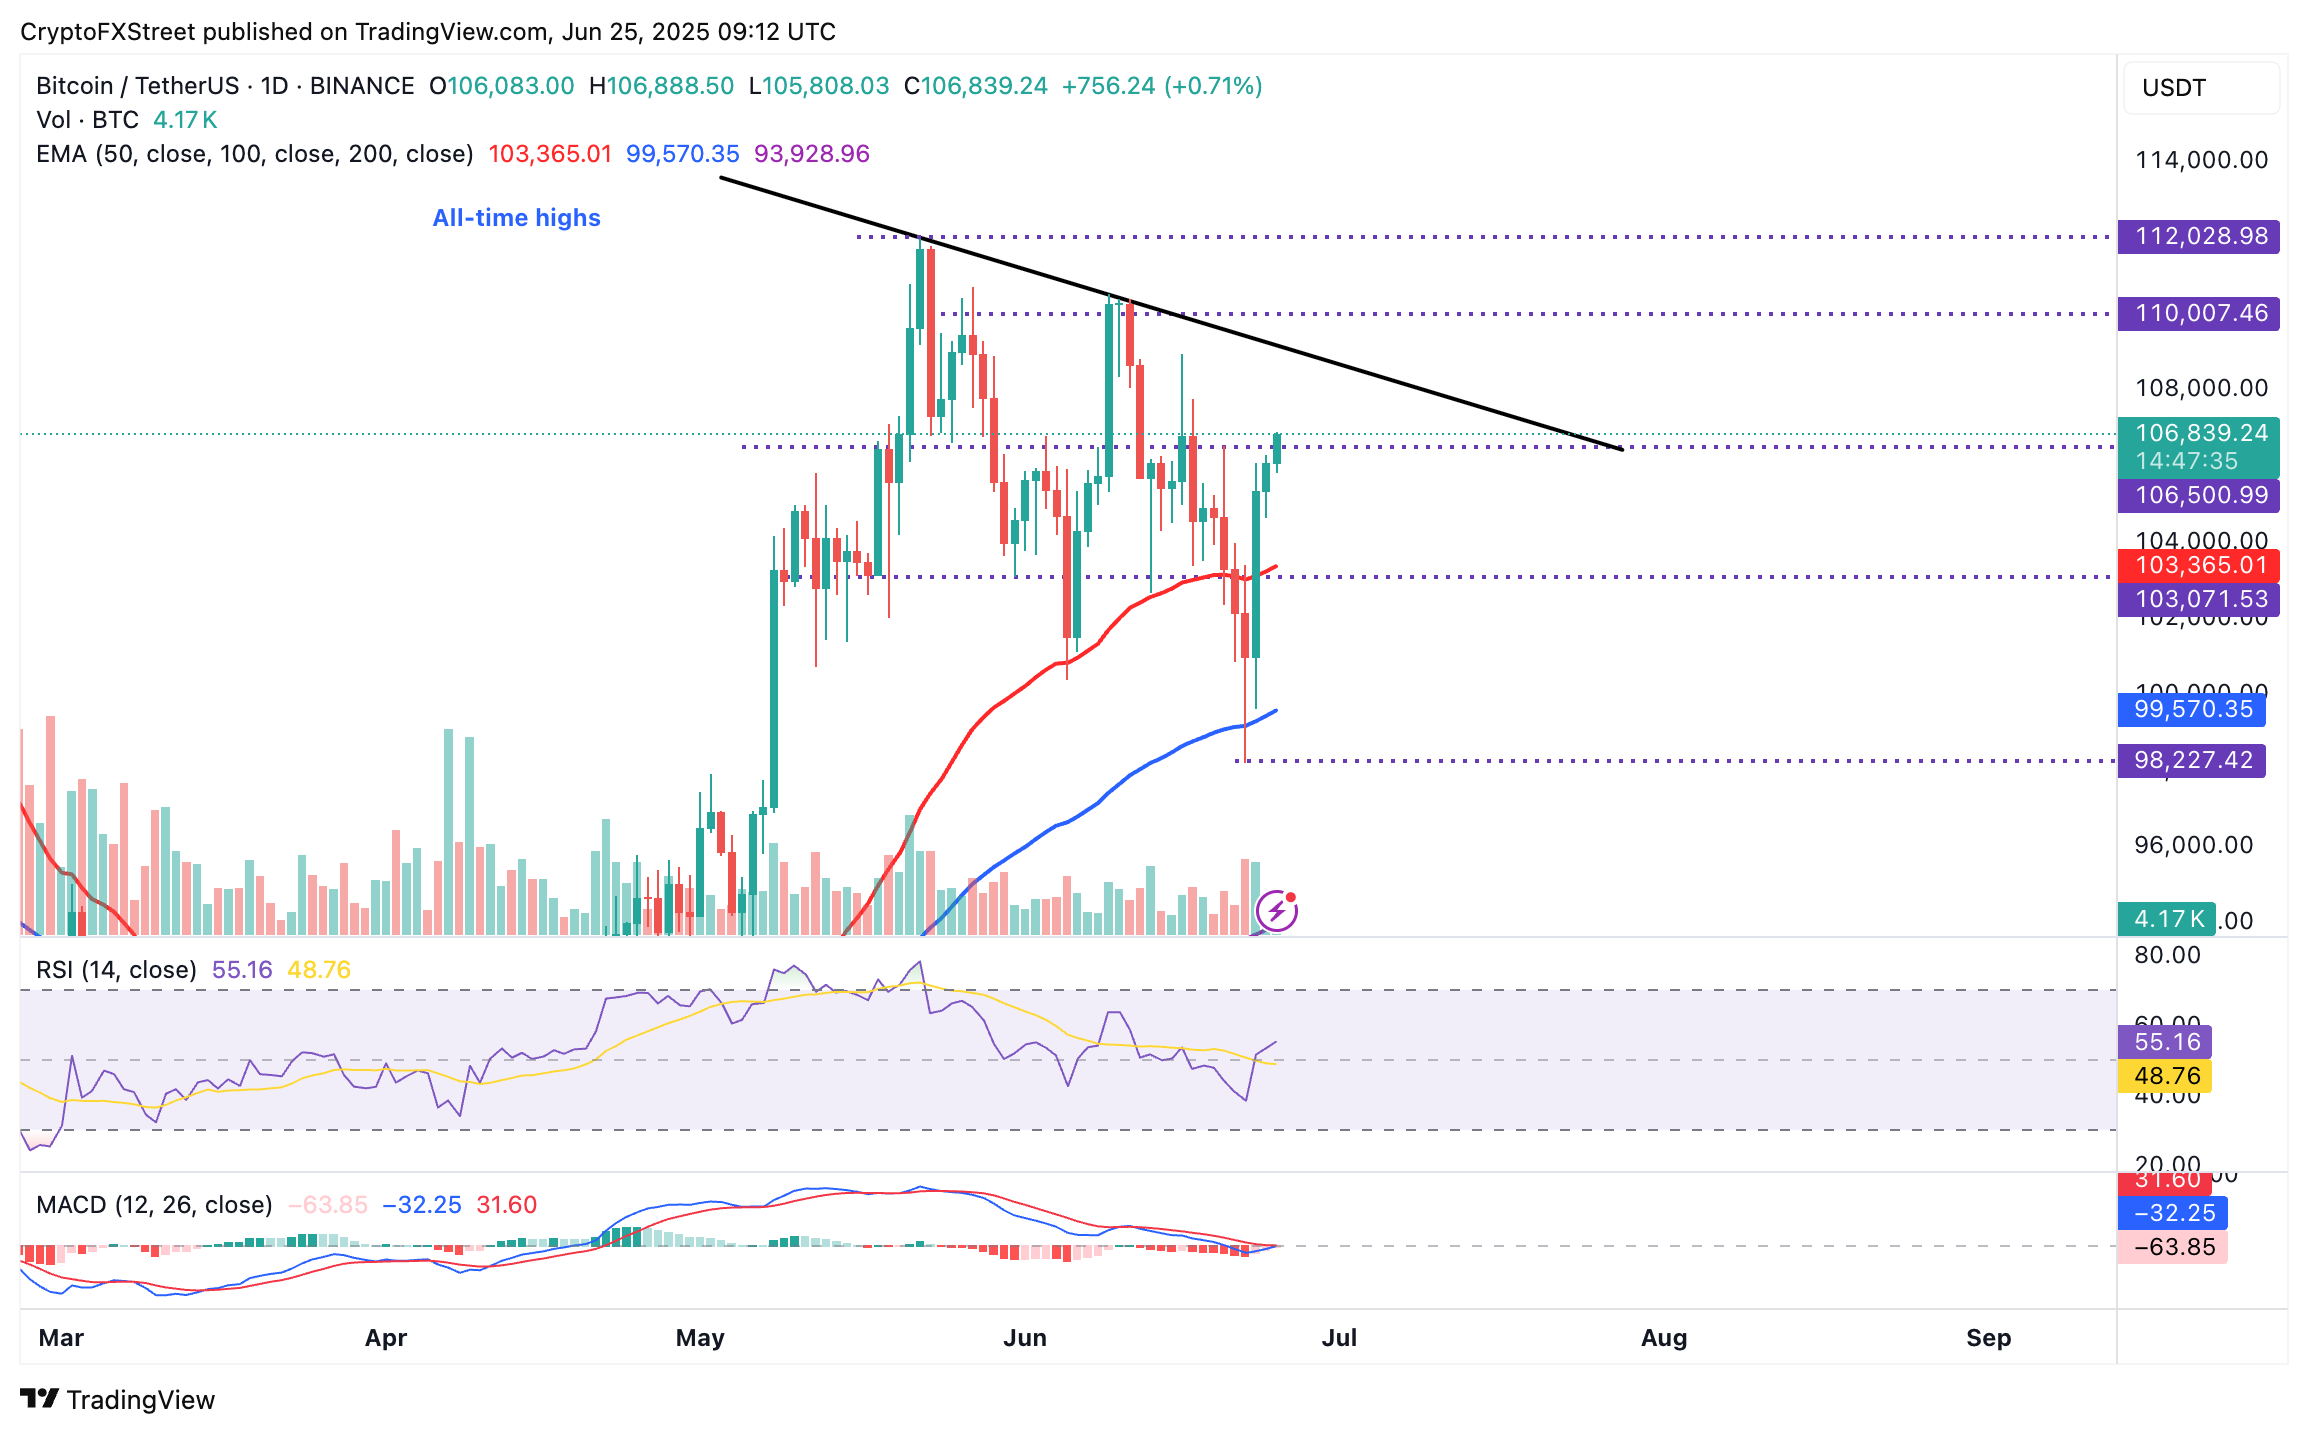
BTC/USD daily chart
Key technical milestones traders would look for include a break above the descending trendline resistance and price action above $110,000 resistance, which could catalyze the move to new all-time highs above $110,980.
On the contrary, potential profit-taking amid geopolitical uncertainty could pause the uptrend and lead to a reversal below the $106,000 support level. Other key levels to keep in mind include the 50-day Exponential Moving Average (EMA), currently holding at $103,365, the 100-day EMA at $99,571 and weekend lows at around $98,227, which will likely serve as tentative support areas to absorb overhead pressure.
Altcoins update: Ethereum, XRP recovery takes a breather
Ethereum's price has paused the recovery uptrend under resistance marked by the 200-day EMA at $2,470, while the 50-day EMA at $2,424 provides immediate support.
The sideways movement portrayed by the MACD indicator suggests indecision among traders. However, the Relative Strength Index (RSI) failure to break above the midline hints at a resolute bearish bias.
In the event that the price retreats below the 50-day EMA support, the 100-day EMA at $2,371 is poised to absorb sell-side pressure. Moreover, traders cannot ignore the weekend low of $2,110 if the down leg extends further.
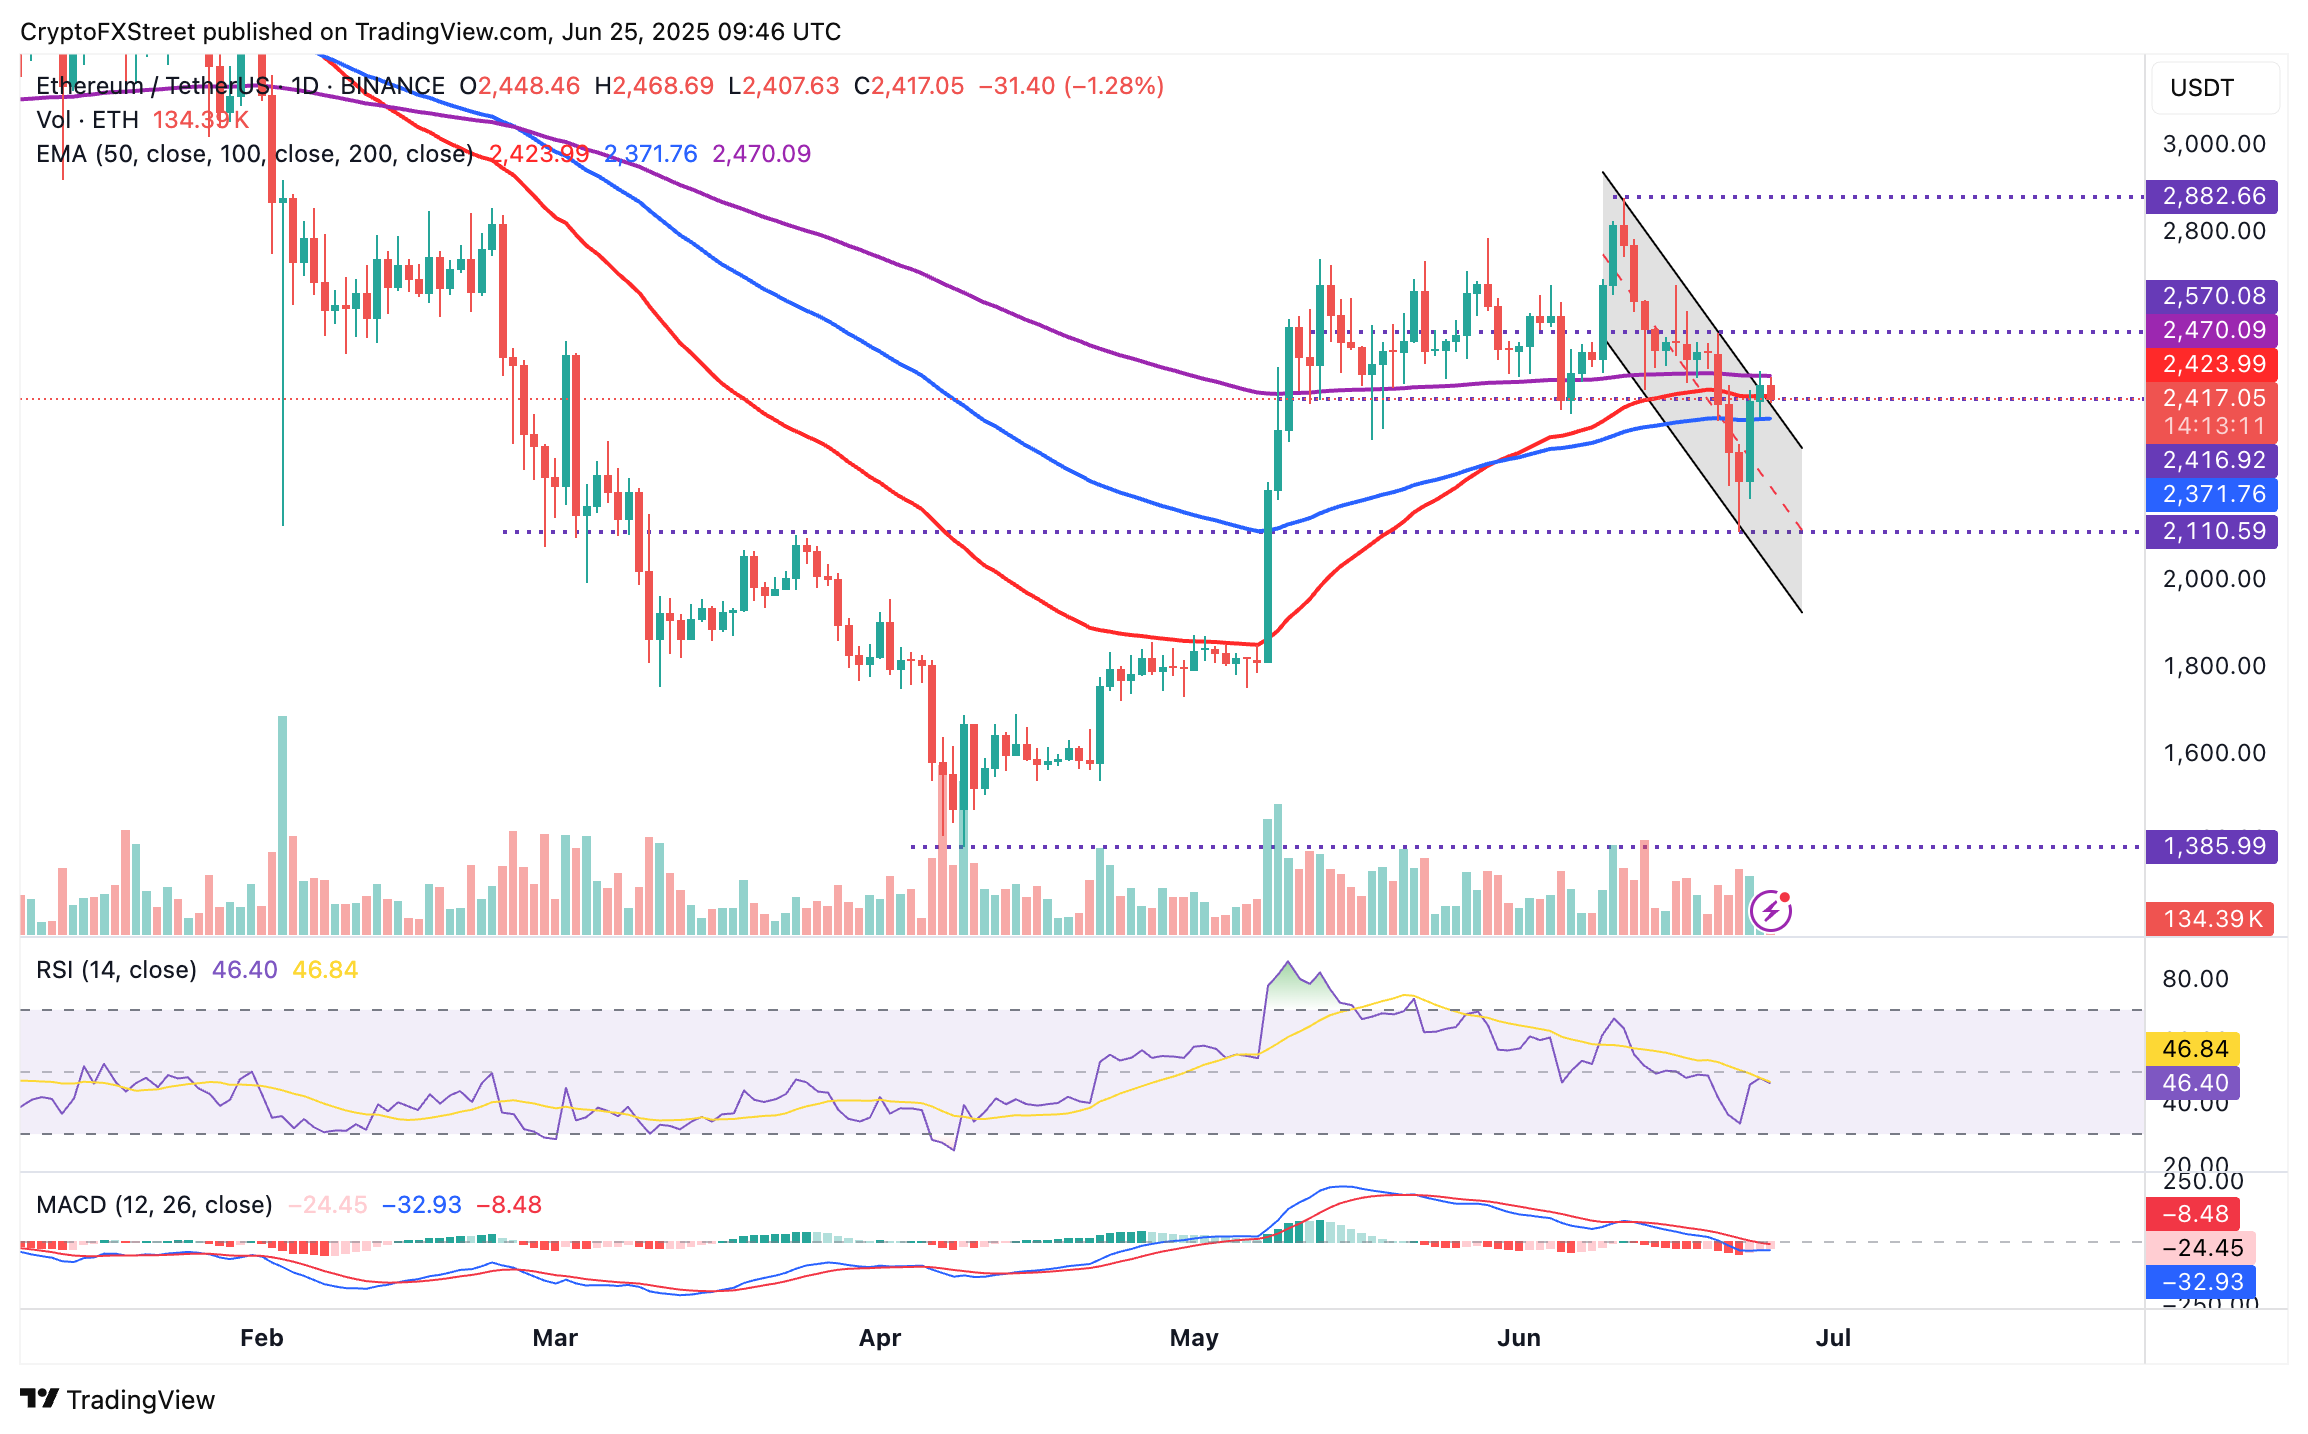
ETH/USDT daily chart
As Ethereum generally consolidates, the derivatives market reveals a positive dynamic change, reflected by the futures Open Interest (OI) rising to $31.53 billion, up from $28.19 billion seen on Monday.
OI refers to the US Dollar (USD) sum of all futures and options contracts that have yet to be settled or closed. A steady increase in OI indicates rising interest in ETH, supported by soaring market activity.
Ethereum futures open interest data | Source: CoinGlass
On the other hand, XRP exhibits signs of a weakening uptrend after testing resistance near the 50-day EMA at $2.21. Based on the RSI indicator's flat position at the midline, XRP could extend consolidation, especially with its downside protected by the 200-day EMA support at $2.09.
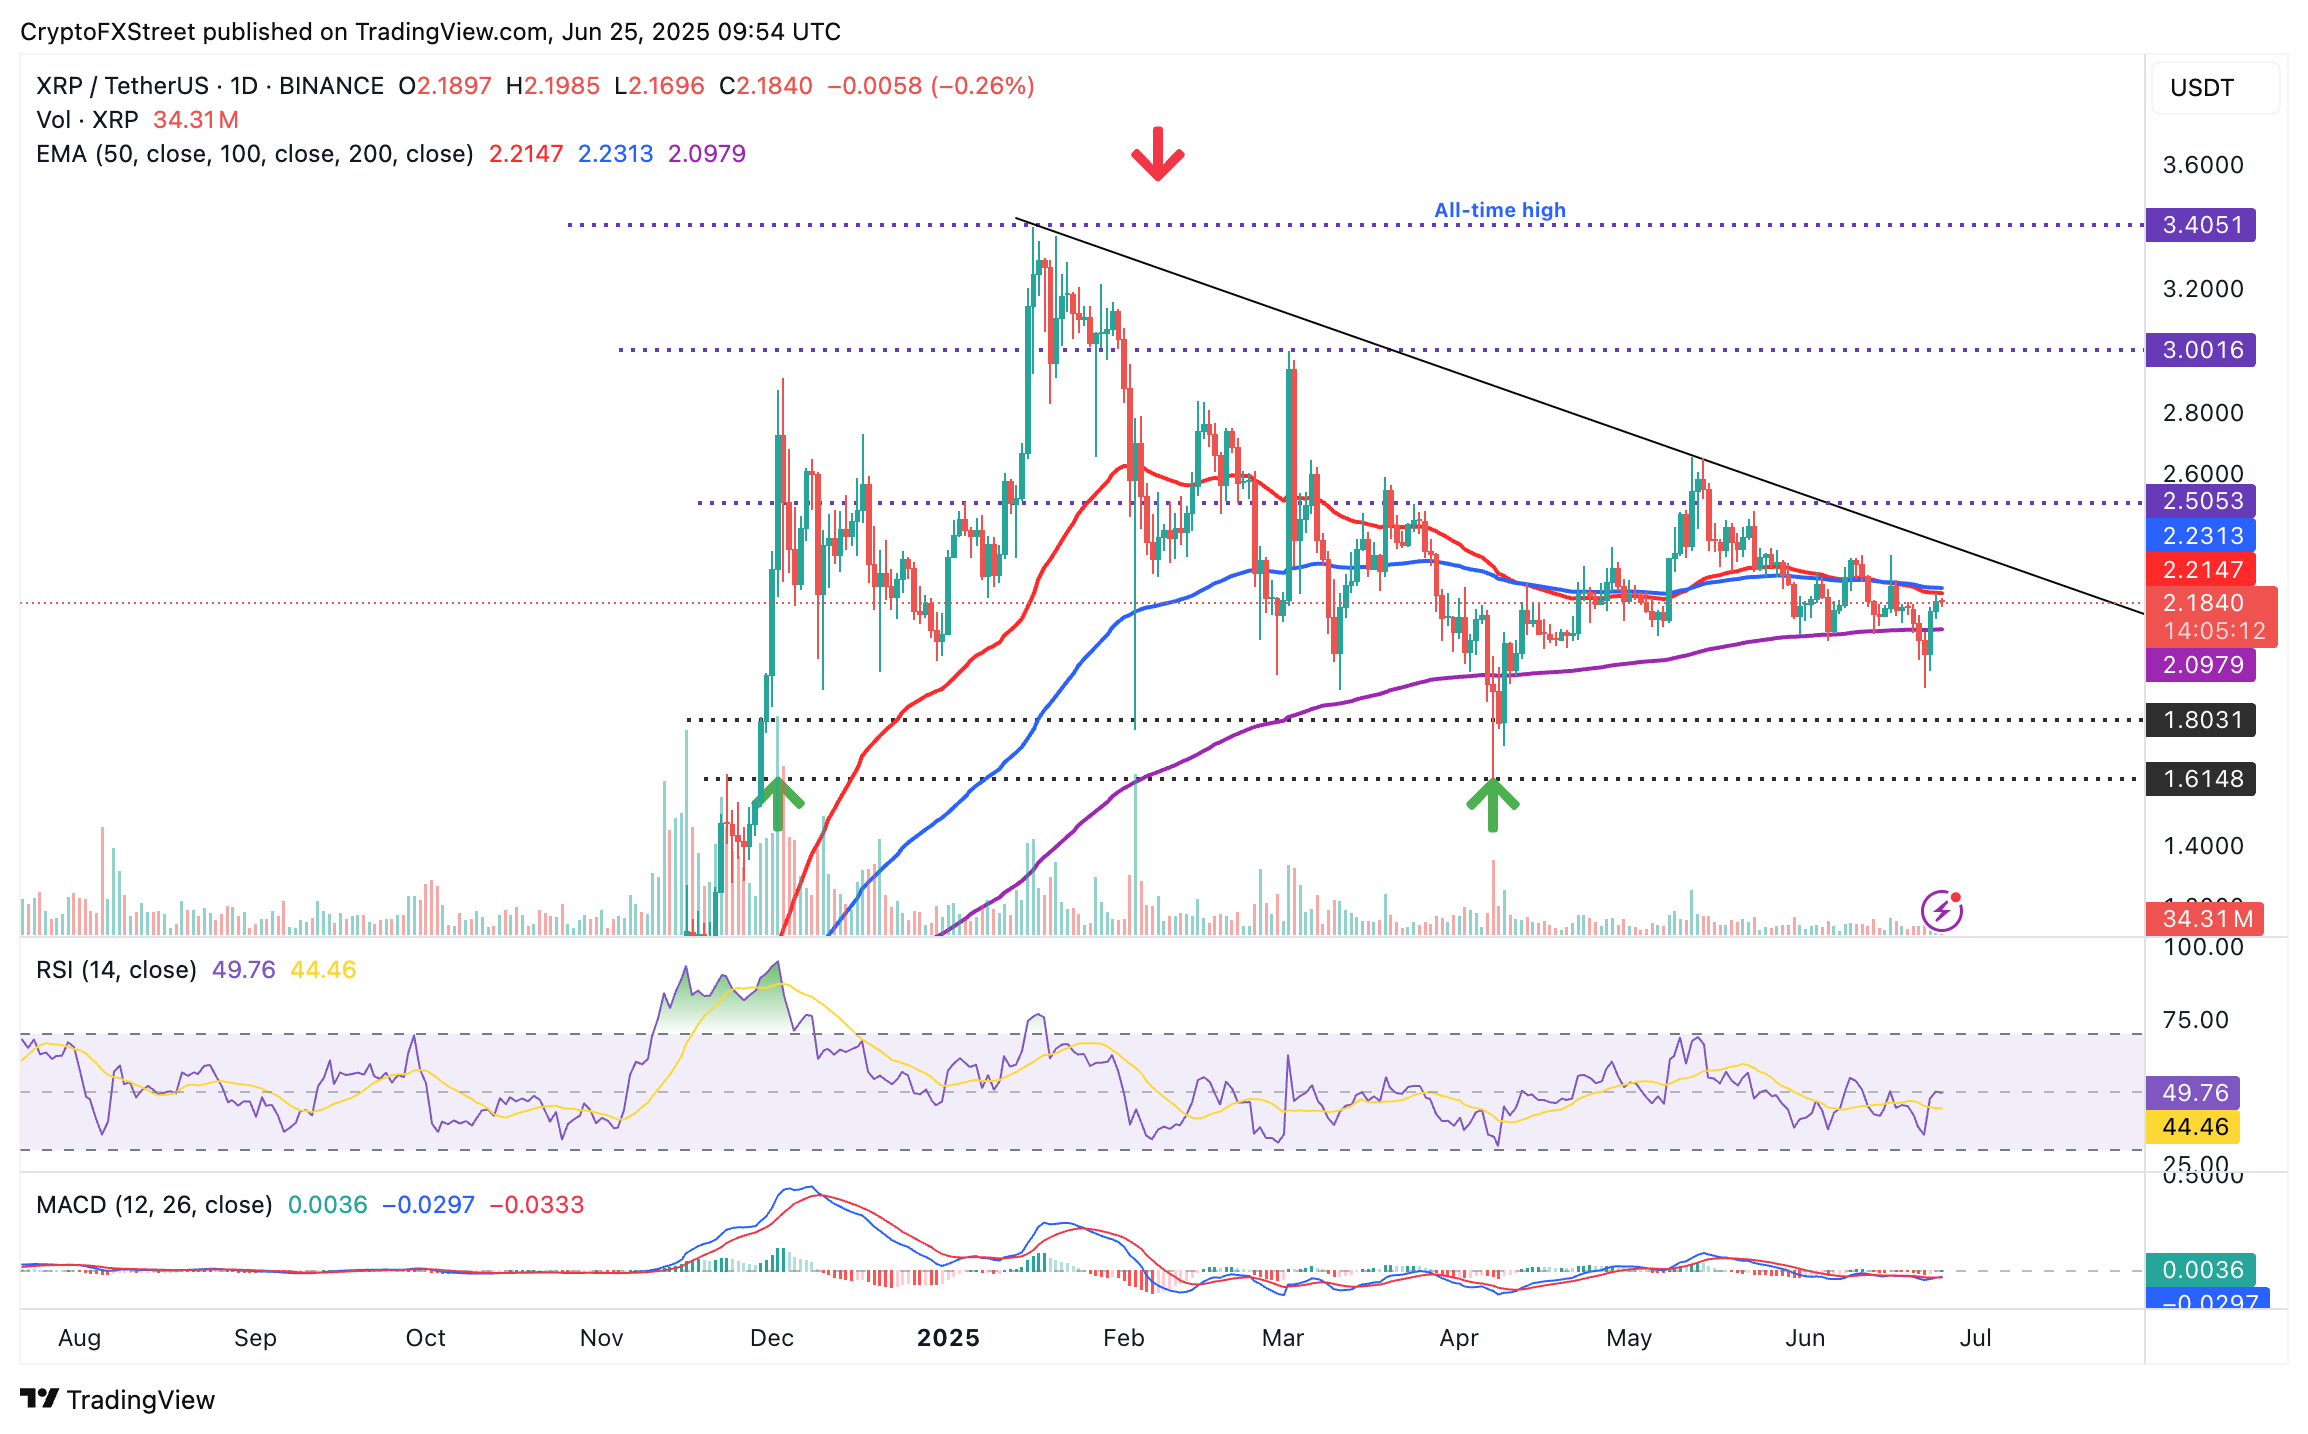
XRP/USDT daily chart
Meanwhile, a minor uptick in the XRP futures open interest from a Monday low of $3.54 billion to $3.76 billion suggests a resurgence in investor interest in the token.
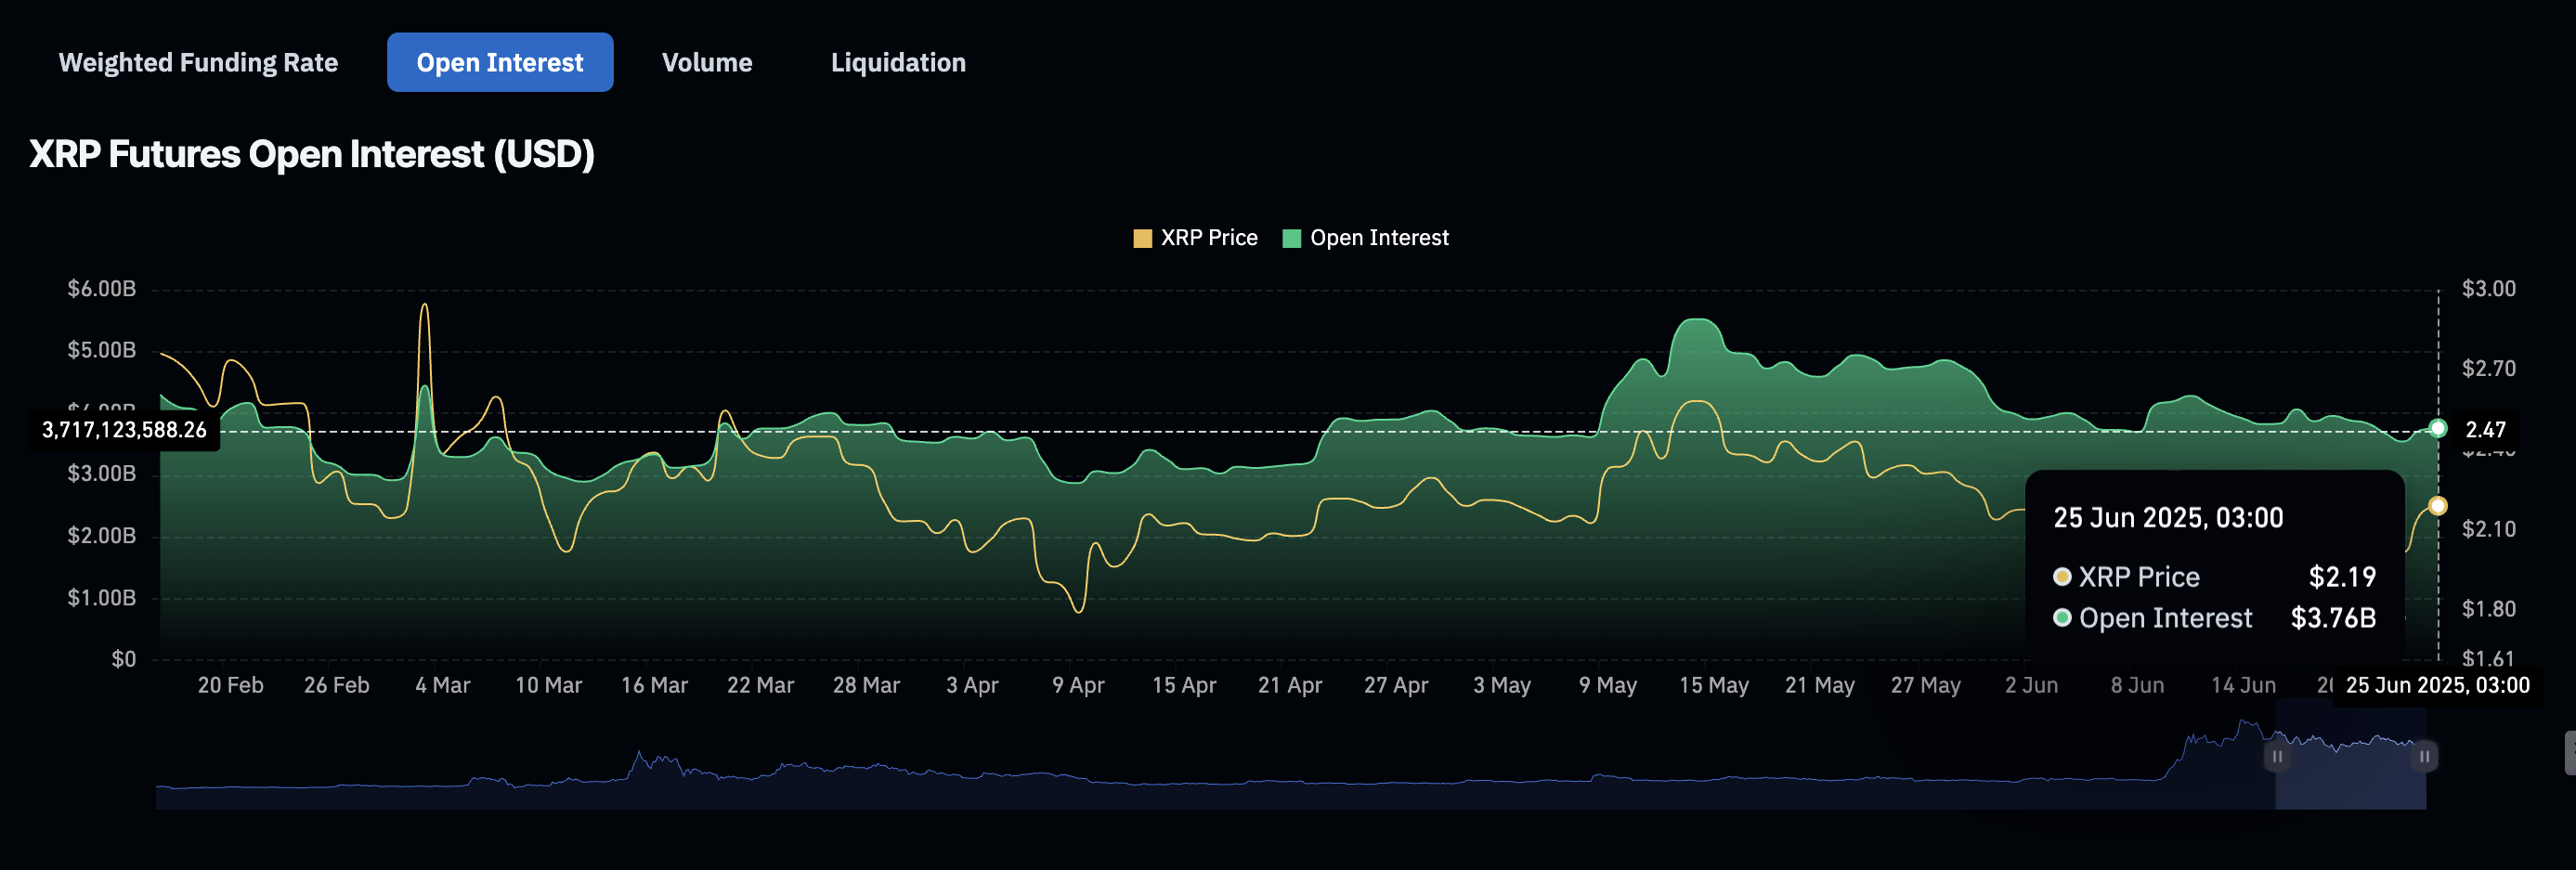
XRP futures open interest data | Source: CoinGlass
Traders may want to closely monitor this metric to validate recovery potential or prepare for another sweep at the $1.90 support level.
Cryptocurrency prices FAQs
Token launches influence demand and adoption among market participants. Listings on crypto exchanges deepen the liquidity for an asset and add new participants to an asset’s network. This is typically bullish for a digital asset.
A hack is an event in which an attacker captures a large volume of the asset from a DeFi bridge or hot wallet of an exchange or any other crypto platform via exploits, bugs or other methods. The exploiter then transfers these tokens out of the exchange platforms to ultimately sell or swap the assets for other cryptocurrencies or stablecoins. Such events often involve an en masse panic triggering a sell-off in the affected assets.
Macroeconomic events like the US Federal Reserve’s decision on interest rates influence crypto assets mainly through the direct impact they have on the US Dollar. An increase in interest rate typically negatively influences Bitcoin and altcoin prices, and vice versa. If the US Dollar index declines, risk assets and associated leverage for trading gets cheaper, in turn driving crypto prices higher.
Halvings are typically considered bullish events as they slash the block reward in half for miners, constricting the supply of the asset. At consistent demand if the supply reduces, the asset’s price climbs.
추천 기사


