
Bonk, Fartcoin meme coins maintain steady gains as TRUMP tumbles
- Shiba Inu ecosystem’s Bonk has sustained over 50% gains in the past 30 days, aiming for a return above $0.00003.
- Fartcoin rallies within an ascending channel, backed by a bullish structure and multiple buy signals.
- TRUMP meme coin tumbles from $16 highs and tests the 4-hour 100 EMA as dinner with President Donald Trump attracts negative publicity.
The cryptocurrency market faced headwinds on Friday following United States (US) President Donald Trump’s threat of a 50% tariff targeting the European Union (EU). While crypto prices generally retrace from recent highs, including Bitcoin’s (BTC) sharp drop to $108,000, select meme coins such as Bonk (BONK) and Fartcoin (FARTCOIN) maintain steady uptrends, signaling a dynamic shift in trader sentiment.
Meanwhile, investor reaction to the new tariff threat has extended the Official Trump (TRUMP) meme coin’s decline, which briefly tested support at around $13.00 before recovering to trade at $13.40 at the time of writing.
Bonk and Fartcoin surge amid multiple buy signals
Meme coins are stealing the show in the broader altcoin market, with tokens like Fartcoin and Bonk maintaining steady gains ahead of the weekend. Shiba Inu’s ecosystem’s Bonk hovers at $0.000023, supported by a buy signal from the Moving Average Convergence Divergence (MACD) indicator sent on Wednesday.
The path with the least resistance remains firmly upwards, with the indicator crossing above the center line while expanding the green histogram bars. An increase in trading volume highlighted heightened market participation as bulls target a potential return above $0.00003.
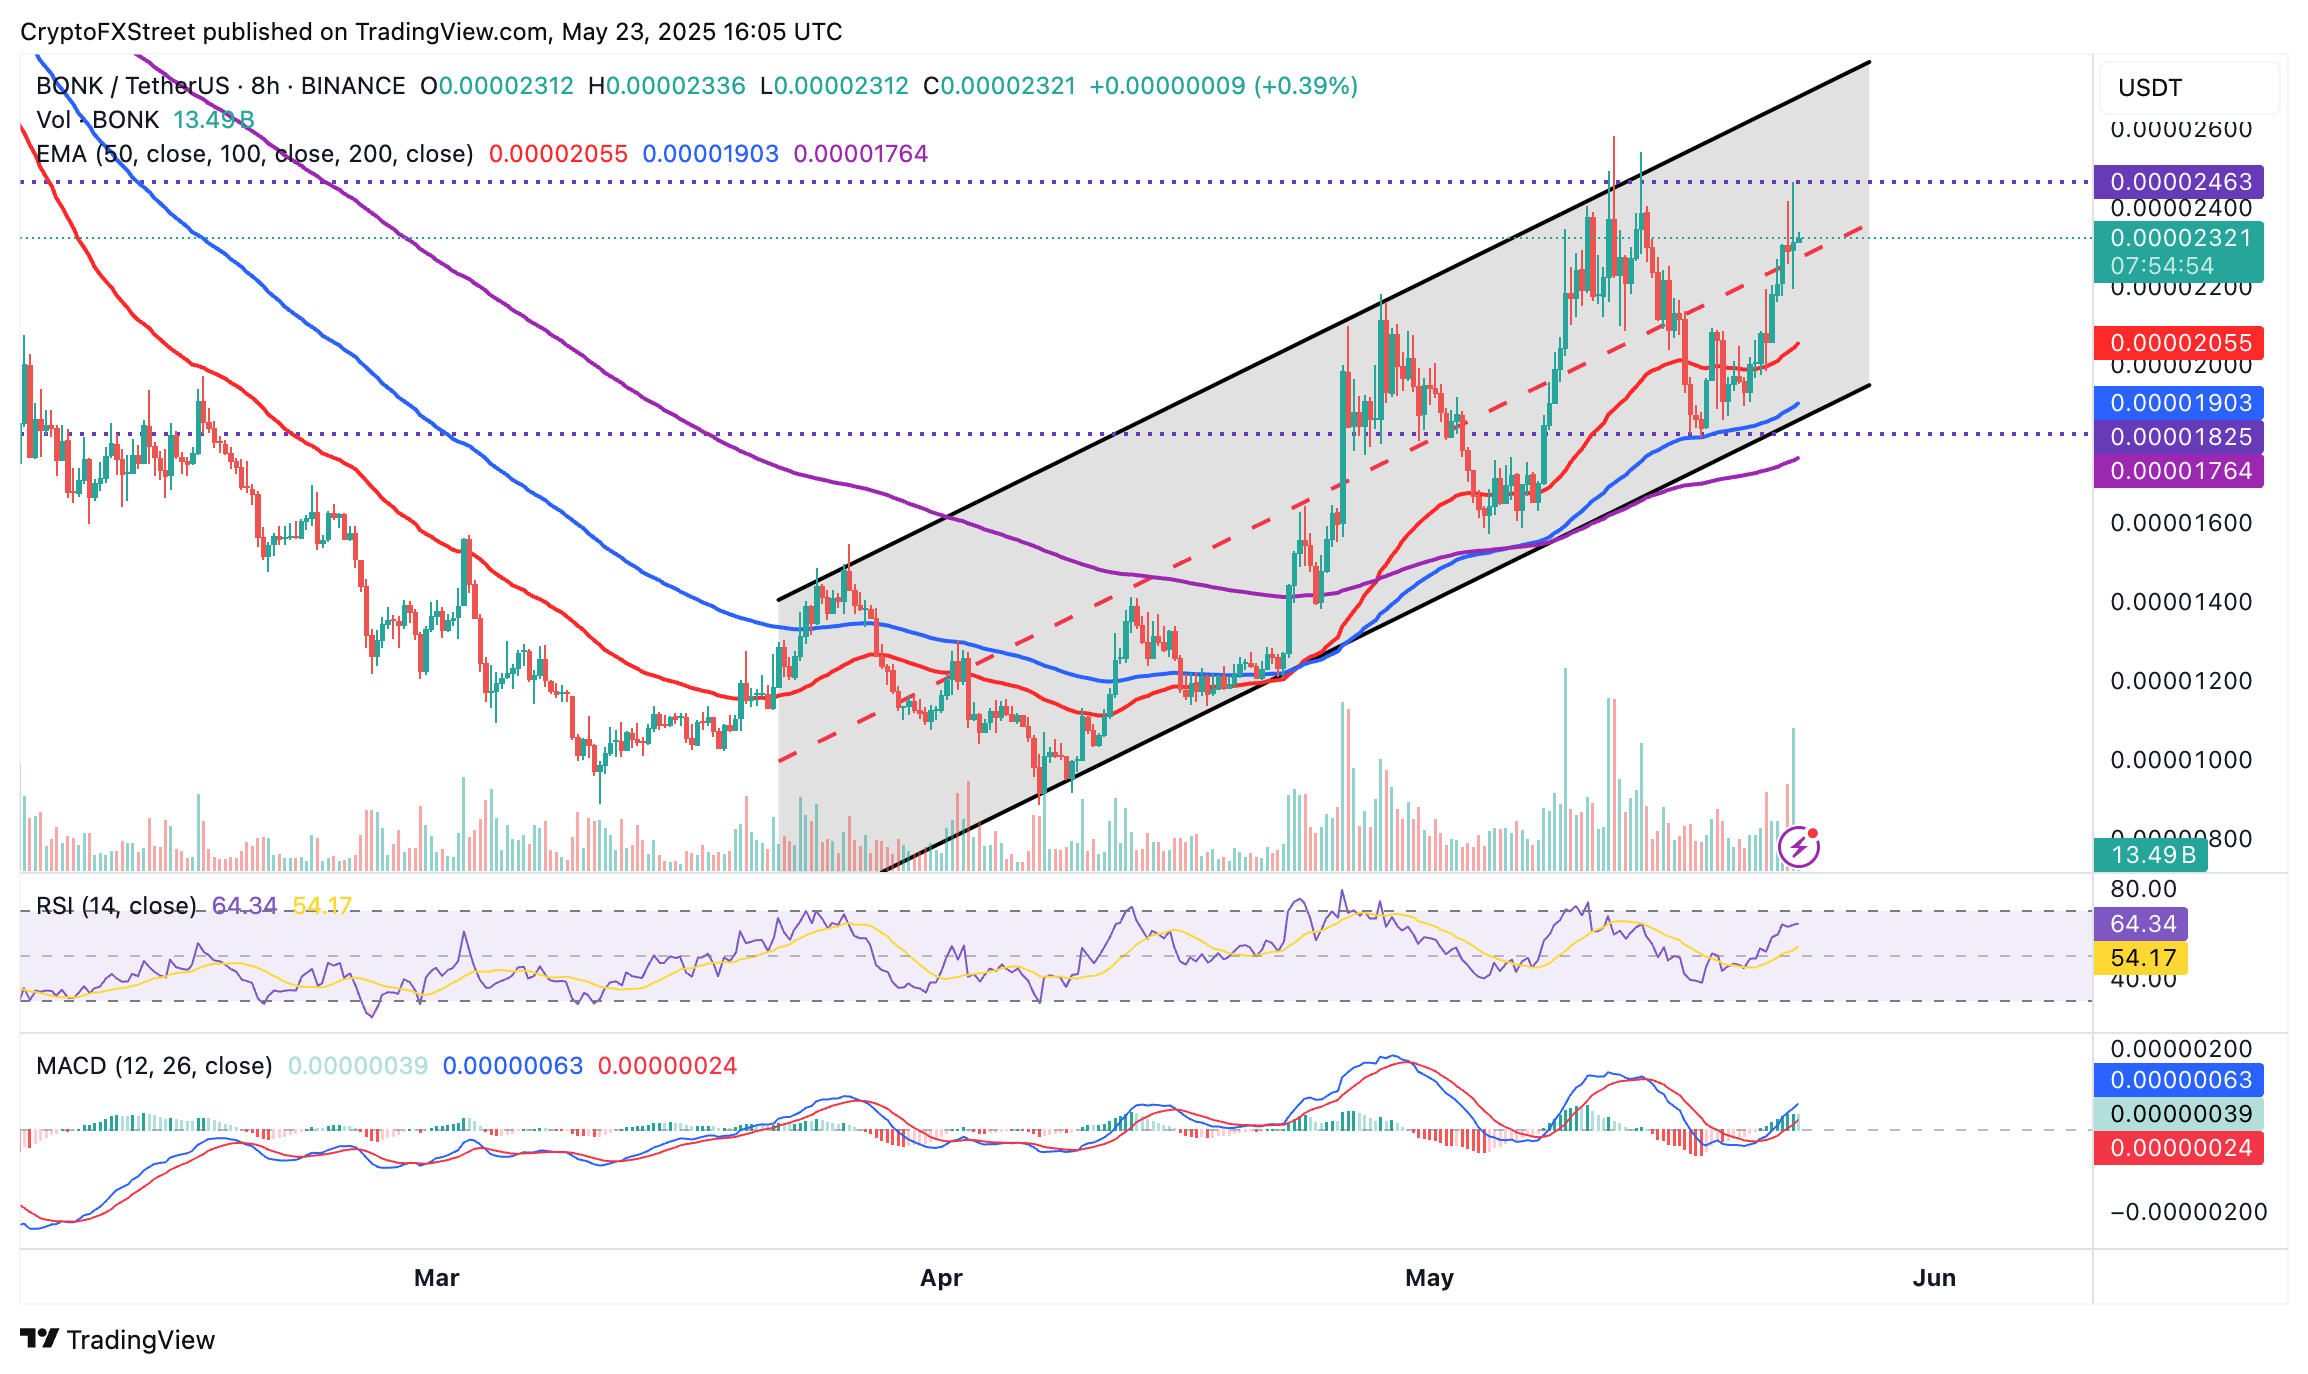
BONK/USDT 8-hour chart
Support above the ascending channel’s middle boundary could prevent sudden pullbacks in upcoming sessions. Moreover, the Relative Strength Index (RSI) at 64 is approaching the overbought region, signaling a vigorous uptrend.
Similarly, Fartcoin flaunts a robust bullish structure supported within an ascending channel. Trading at $1.55 at the time of writing, the meme coin is testing an immediate resistance around $1.65, marked red on the daily chart below.
On top of the buy signal validated by the MACD indicator, when the MACD line crossed above the signal line, Fartcoin’s price holds significantly above three key moving averages, ranging from the 50-day Exponential Moving Average (EMA) at $1.08, the 100-day EMA at $0.88 to the 200-day EMA at $0.71. With the moving averages playing catch-up with the uptrend, the probability of Fartcoin approaching the critical $2.00 level in the coming days is high.
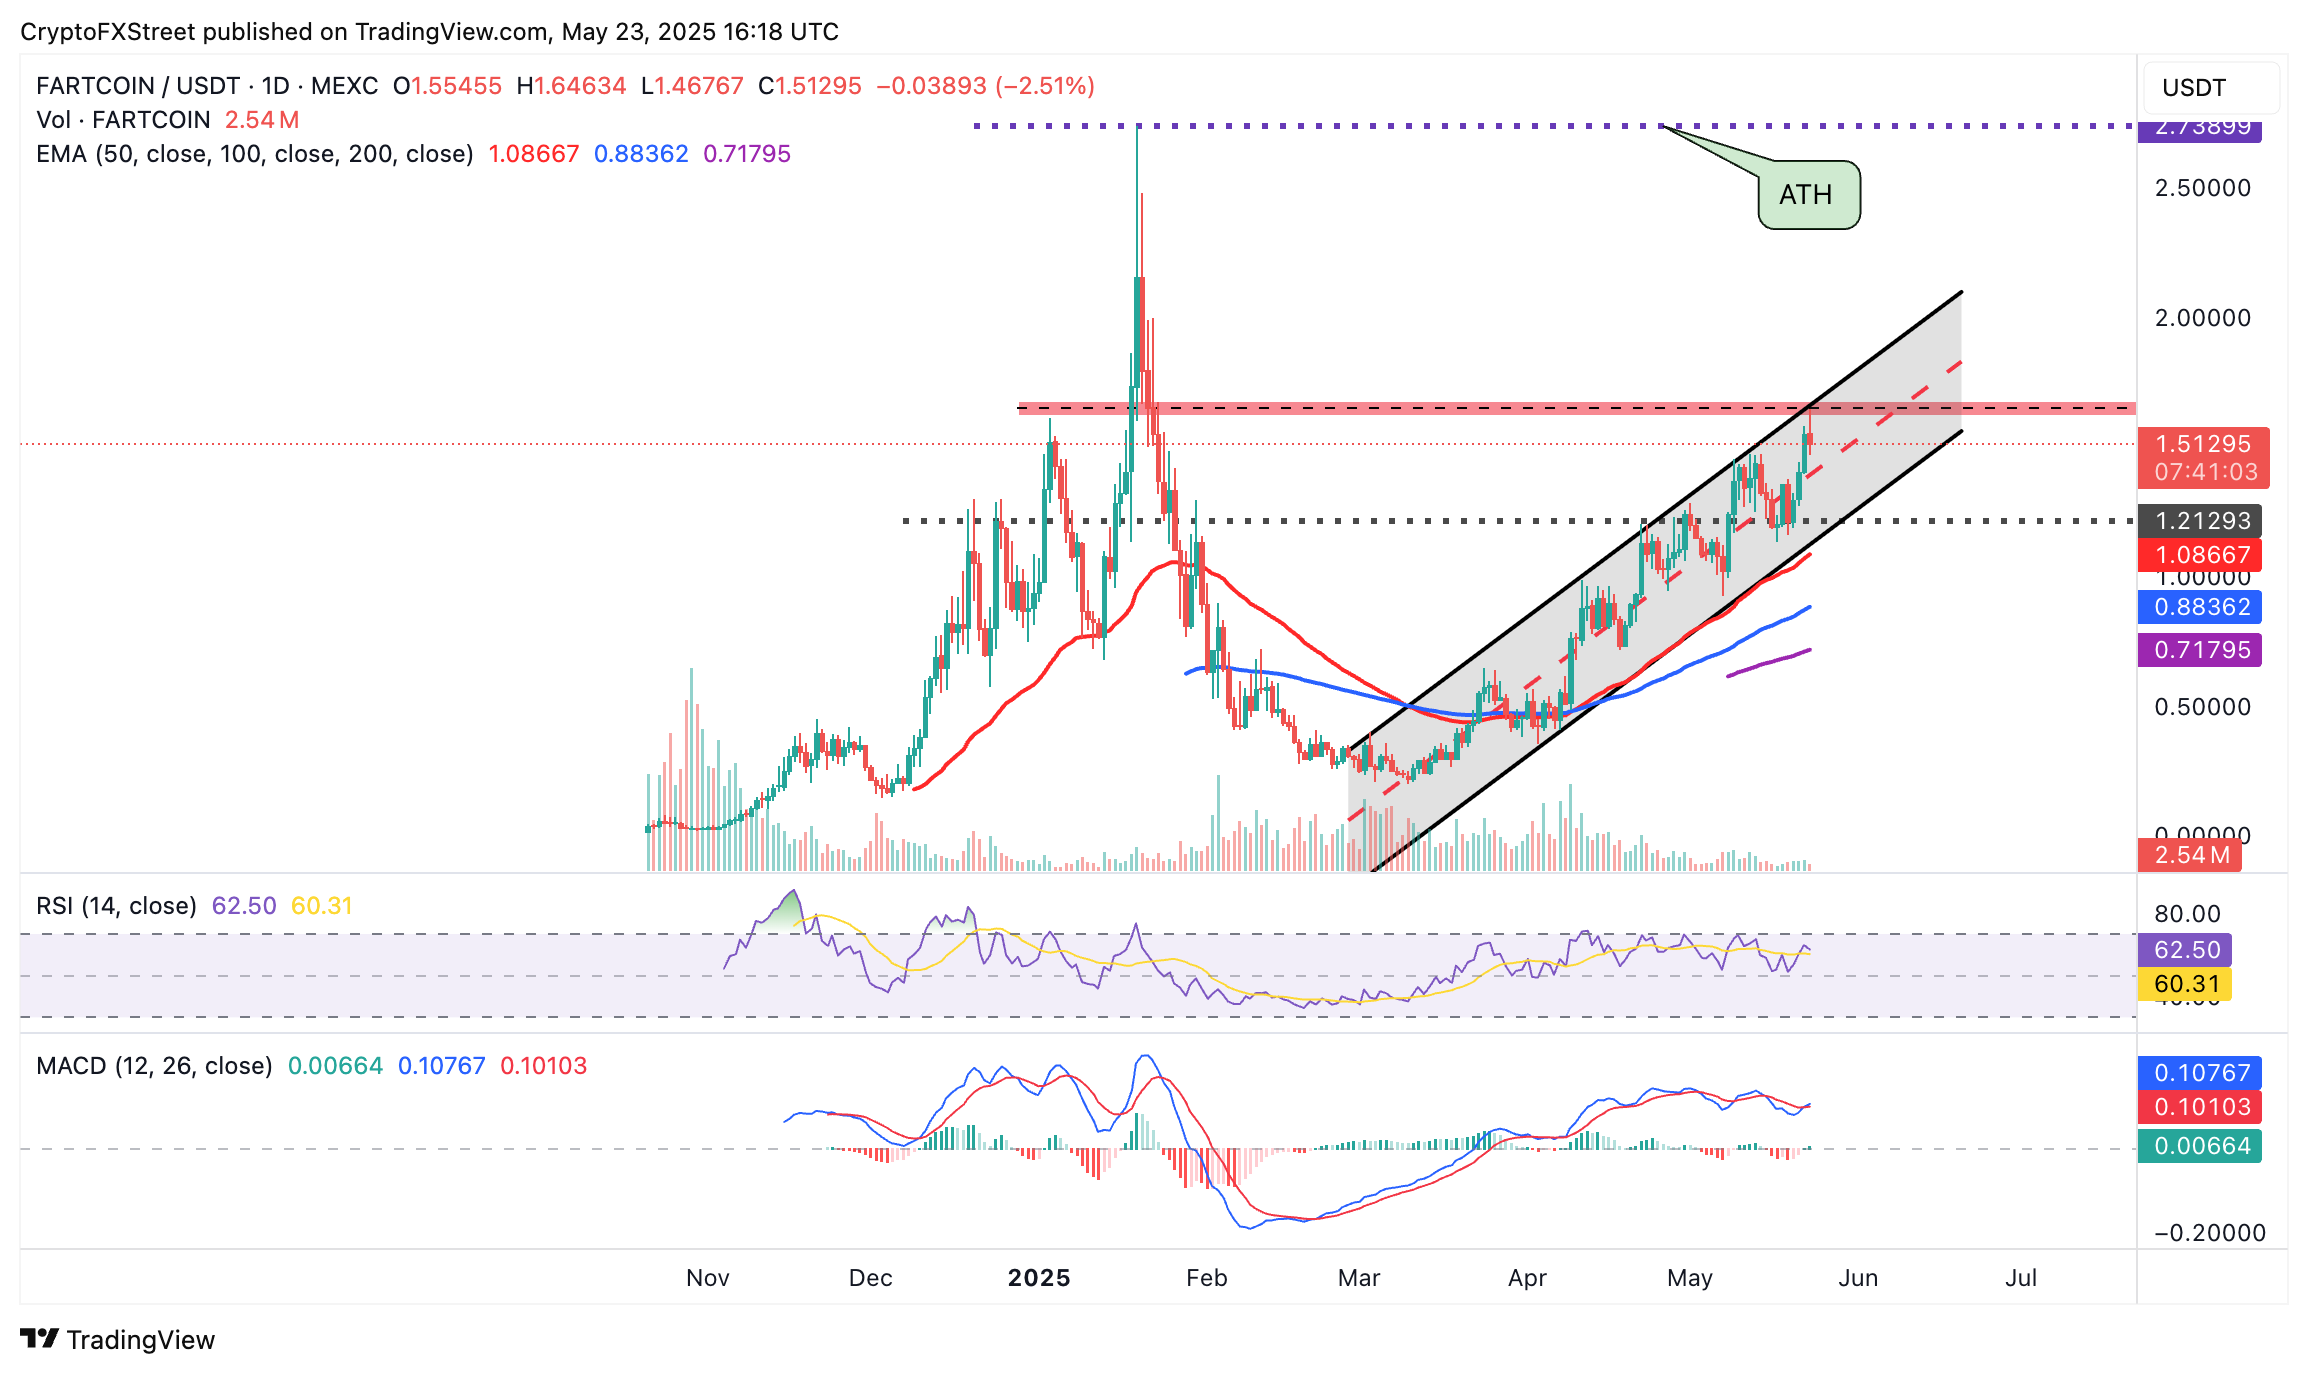
FARTCOIN/USDT daily chart
Furthermore, the RSI at 62 is not yet overbought, so bulls can still push the price higher before overbought conditions introduce the risk of a plausible reversal. The ascending channel has the potential to offer support, reducing the risk of a sharp drop.
TRUMP meme coin’s rally cut short after investor dinner with President Trump
Hundreds of top TRUMP meme coin holders converged at the Trump National Golf Club in Washington, D.C., for an exclusive dinner attended by President Trump on Thursday.
The dinner announced in April brought together the top 220 holders of the TRUMP token, launched before his inauguration in January. According to the announcement, a VIP White House tour was organized for the token’s top 25 holders, including Tron’s (TRX) founder Justin Sun.
Unexpectedly, protesters gathered outside the private golf club with signs calling for an end to “crypto corruption” while asking the dinner organizers to “release the guest list,” as reported by Reuters.
The TRUMP meme coin, which rallied aggressively following the announcement in April, cut short its mid-week rally under $16.00, reflecting the negative sentiment around the dinner.
Based on the chart below, TRUMP’s price plunged below $13.00 but managed to hold onto the support provided by the 4-hour 50-day EMA at $13.27.
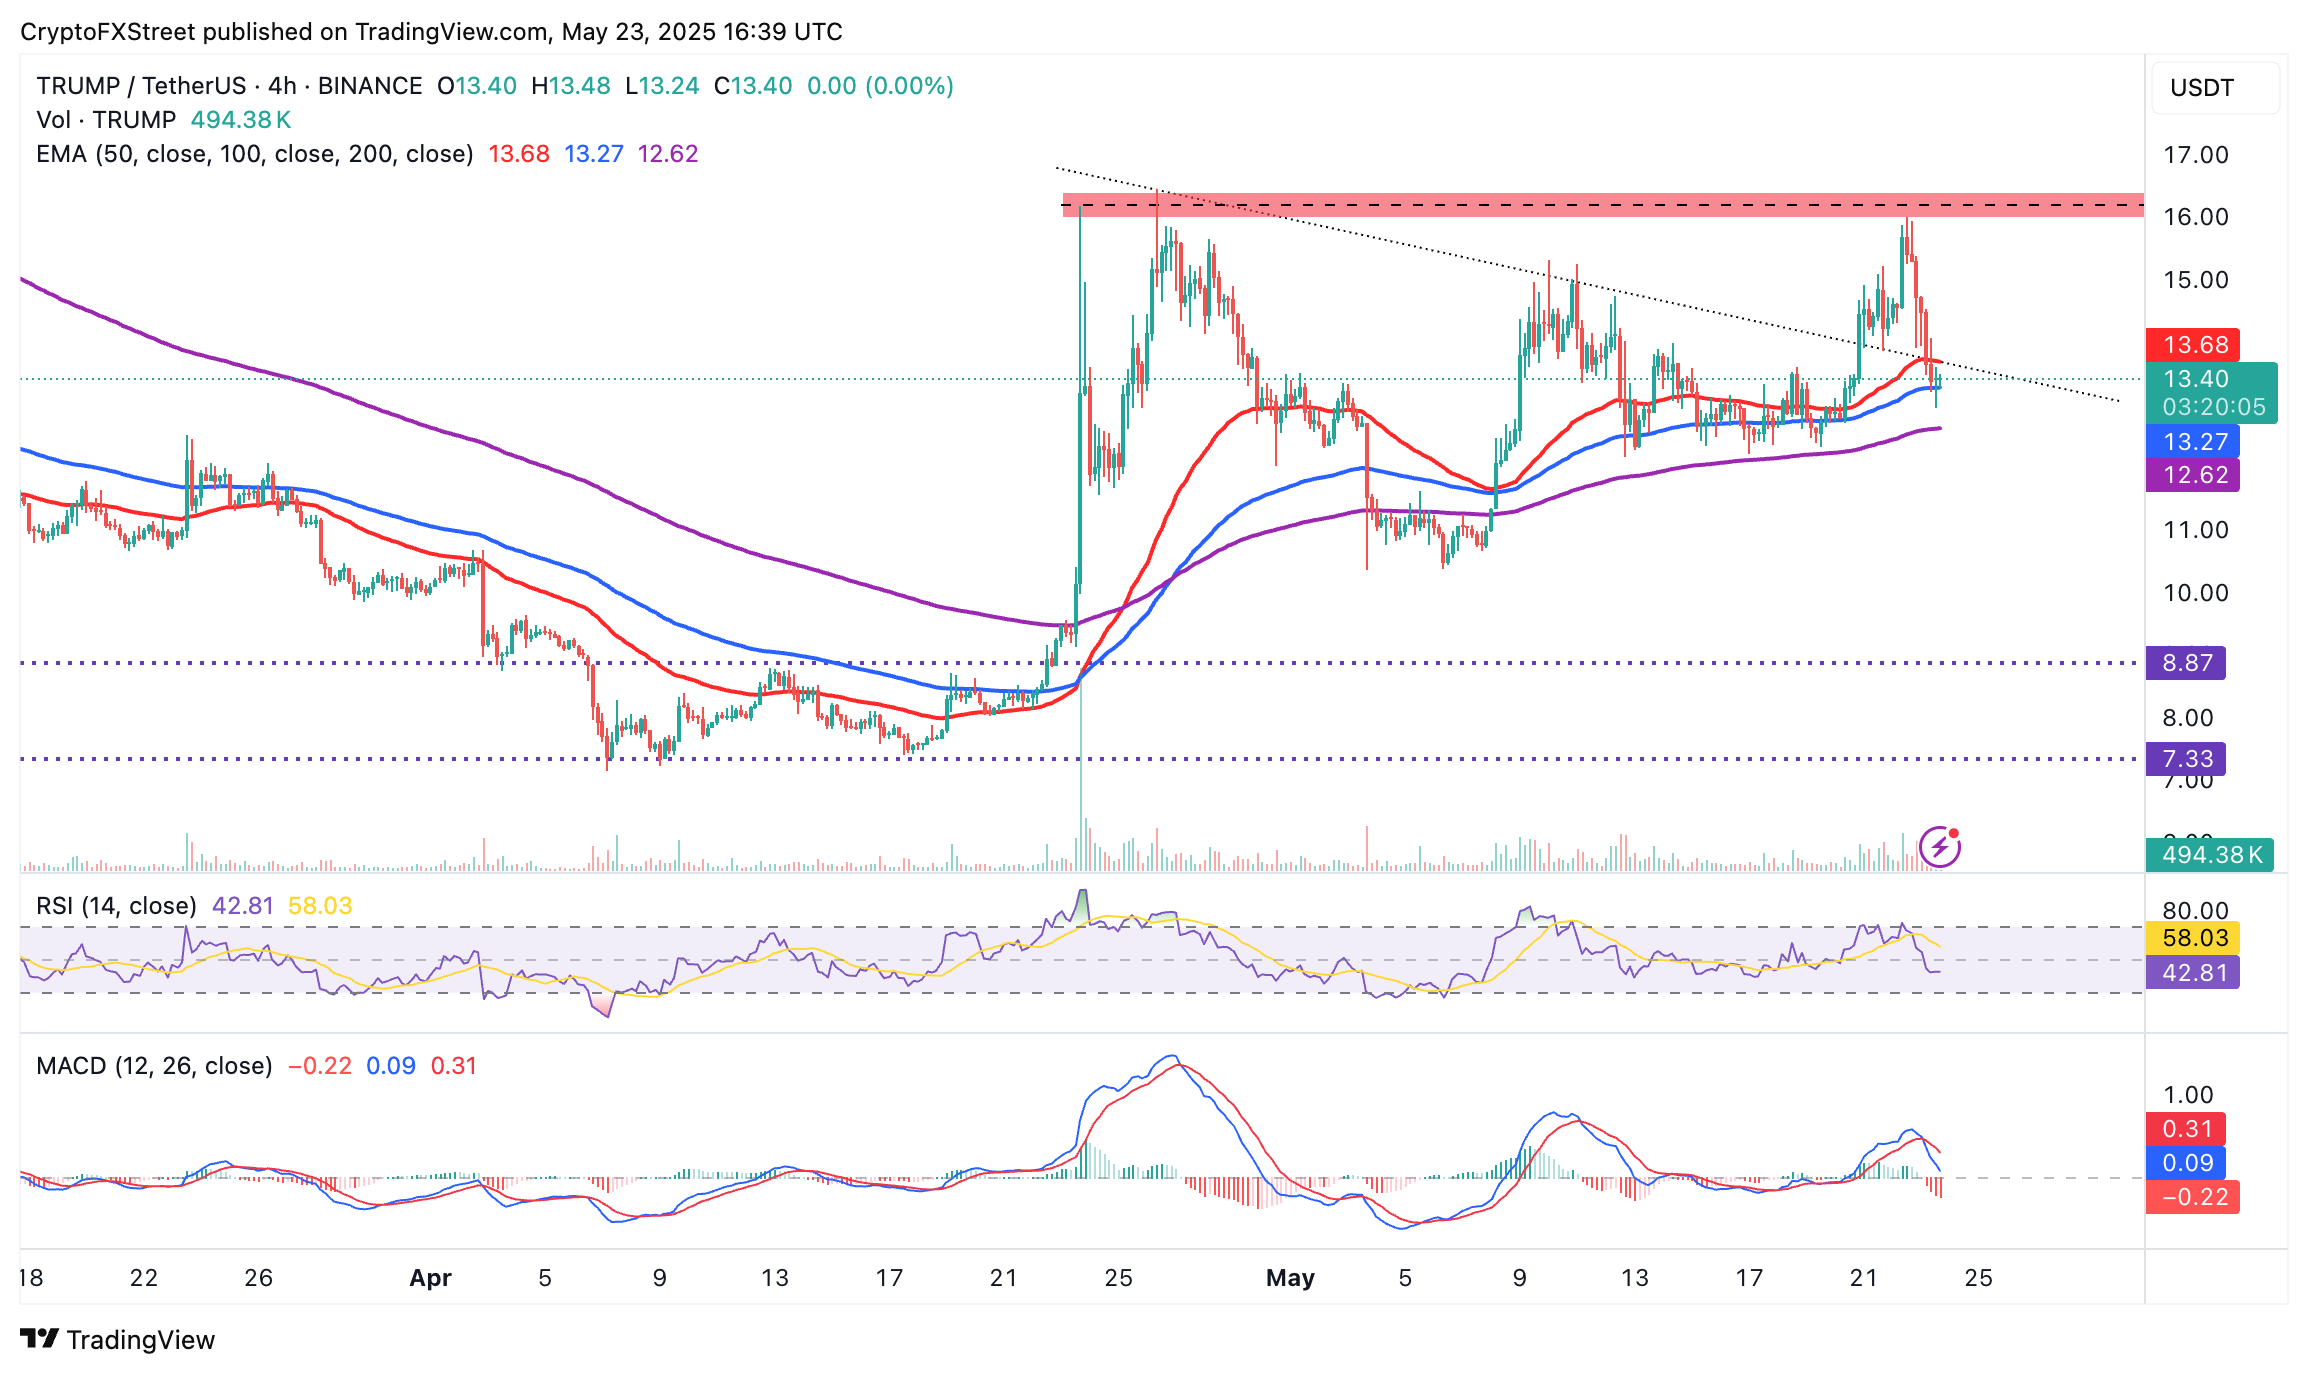
TRUMP/USDT 4-hour chart
Despite the reflex reversal to $13.40 at the time of writing, overhead pressure remains apparent, especially with the MACD indicator validating a buy signal while approaching the center line.
The RSI crossed beneath the 50 midline to 42, affirming the downtrend’s strength. Beyond the 50 EMA, key monitoring levels include the 200-day EMA at $12.62 and the lowest price point in May at around $10.39.
Cryptocurrency prices FAQs
Token launches influence demand and adoption among market participants. Listings on crypto exchanges deepen the liquidity for an asset and add new participants to an asset’s network. This is typically bullish for a digital asset.
A hack is an event in which an attacker captures a large volume of the asset from a DeFi bridge or hot wallet of an exchange or any other crypto platform via exploits, bugs or other methods. The exploiter then transfers these tokens out of the exchange platforms to ultimately sell or swap the assets for other cryptocurrencies or stablecoins. Such events often involve an en masse panic triggering a sell-off in the affected assets.
Macroeconomic events like the US Federal Reserve’s decision on interest rates influence crypto assets mainly through the direct impact they have on the US Dollar. An increase in interest rate typically negatively influences Bitcoin and altcoin prices, and vice versa. If the US Dollar index declines, risk assets and associated leverage for trading gets cheaper, in turn driving crypto prices higher.
Halvings are typically considered bullish events as they slash the block reward in half for miners, constricting the supply of the asset. At consistent demand if the supply reduces, the asset’s price climbs.
추천 기사


