
Ripple Price Forecast: XRP offers mixed signals amid whale accumulation, increase in exchange reserves
- XRP sustains mid-week recovery as XRP/BTC flashes golden cross for the first time since 2017.
- Large volume holders increase XRP exposure, indicating rising demand and investor confidence.
- An increase in exchange reserves to 2.9 billion XRP from 2.7 billion XRP on May 1 signals potential selling pressure.
Ripple's (XRP) mid-week recovery remains stable as the token's price hovers at $2.44 at the time of writing on Friday. The uptick from support at $2.29 on Monday mirrored broader risk-on sentiment in the cryptocurrency market, which saw altcoins rally alongside Bitcoin's (BTC) surge to new all-time highs of around 111,980.
Meanwhile, key on-chain metrics like Exchange Reserves and Supply Distribution show mixed signals, urging trader caution, which could slow the XRP uptrend targeting $3.00.
XRP's uptrend persists amid mixed on-chain signals
The uptick in XRP has been supported by positive broader sentiment in the market, as well as an increase in whale holdings over the past week. Santiment's Supply Distribution metric, shown in the chart below, highlights the targeted accumulation of XRP by investors with between 10 million and 100 million coins.
This cohort of investors currently holds 12.1% of the token's total supply, up from 11.88% recorded on May 12 and 11.58% on April 12. An increase in the risk appetite among whales implies confidence in the future of XRP as investors bet on a potential price increase.
 [12-1747999397677.32.40, 23 May, 2025].png)
XRP Supply Distribution metric
Traders might scale back optimism this weekend, as CryptoQuant's Exchange Reserve metric reveals a sharp rise in Binance's XRP holdings to 2.9 billion XRP from 2.7 billion XRP, as illustrated in the chart below.
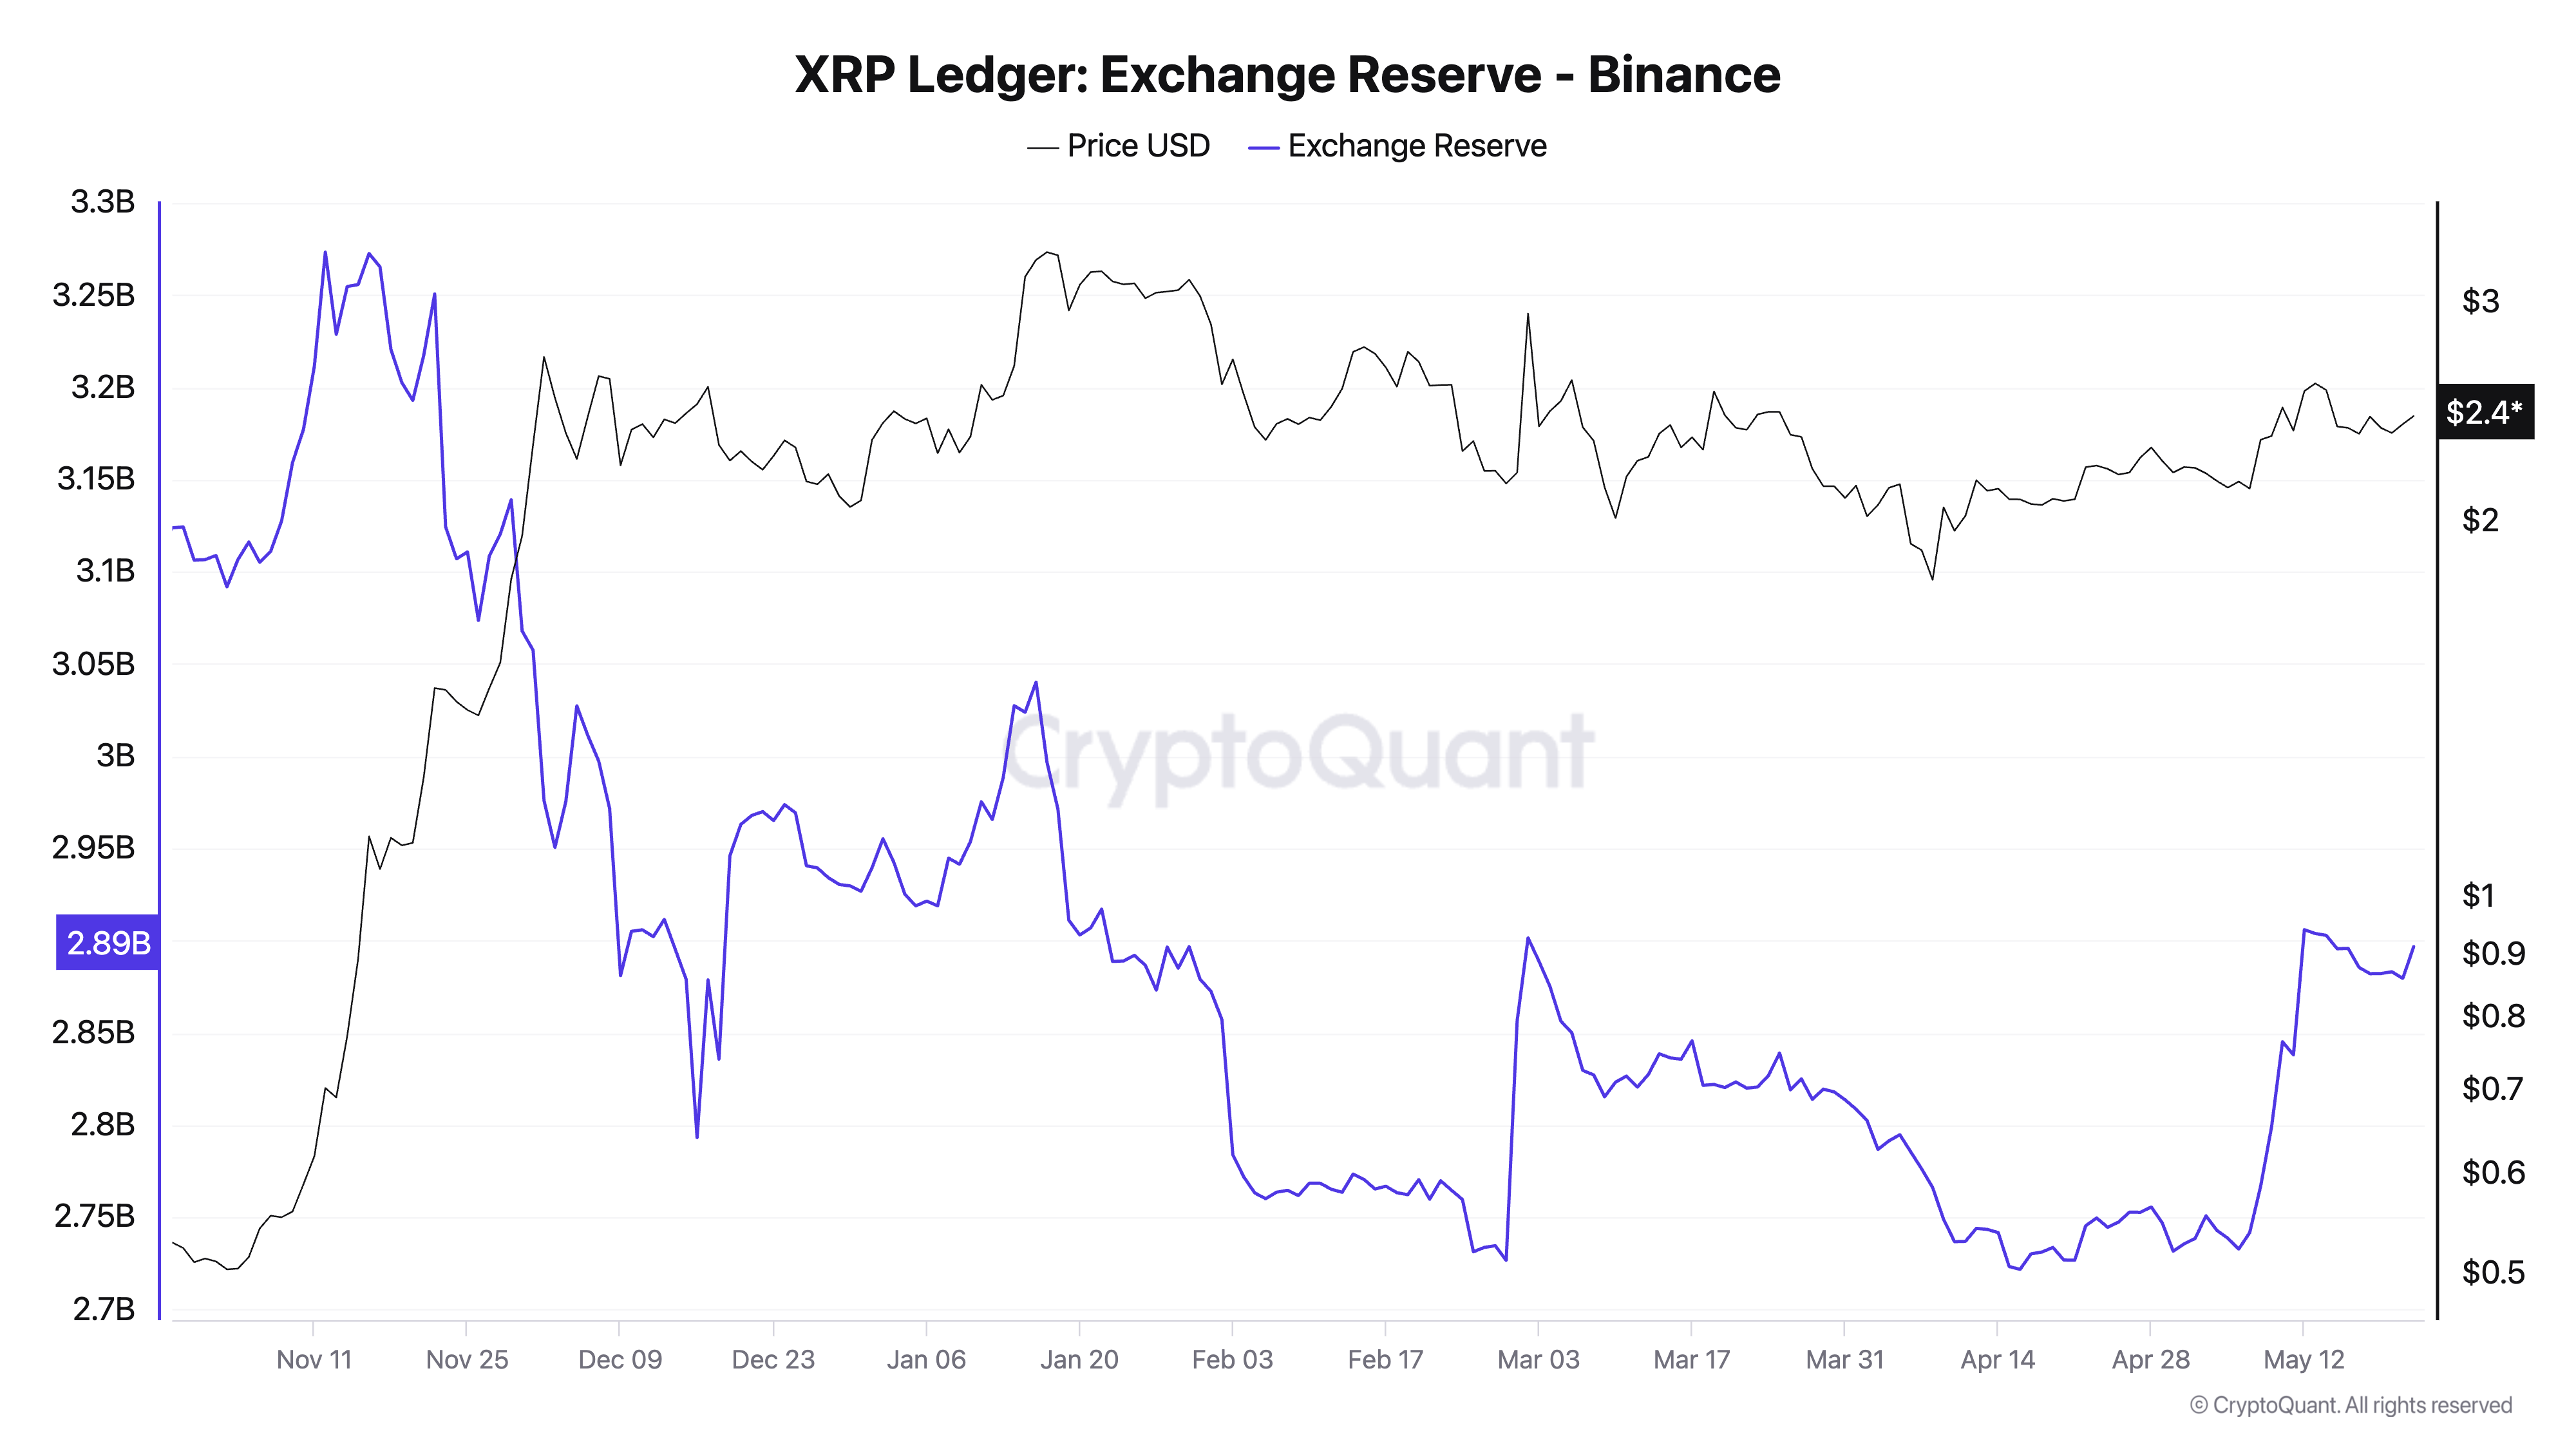
XRP Exchange Reserves | Source: CryptoQuant
As exchange reserves increase, so does the potential selling pressure or heightened volatility, especially if traders channel the coins to open both long and short positions. Generally, investors move holdings to exchange platforms intending to sell, which can significantly boost overhead pressure.
At the same time, the XRP futures contracts' Open Interest (OI) increased to $4.94 billion after falling to $4.59 billion on Wednesday. An uptick in OI suggests that trader interest is growing alongside market participation.
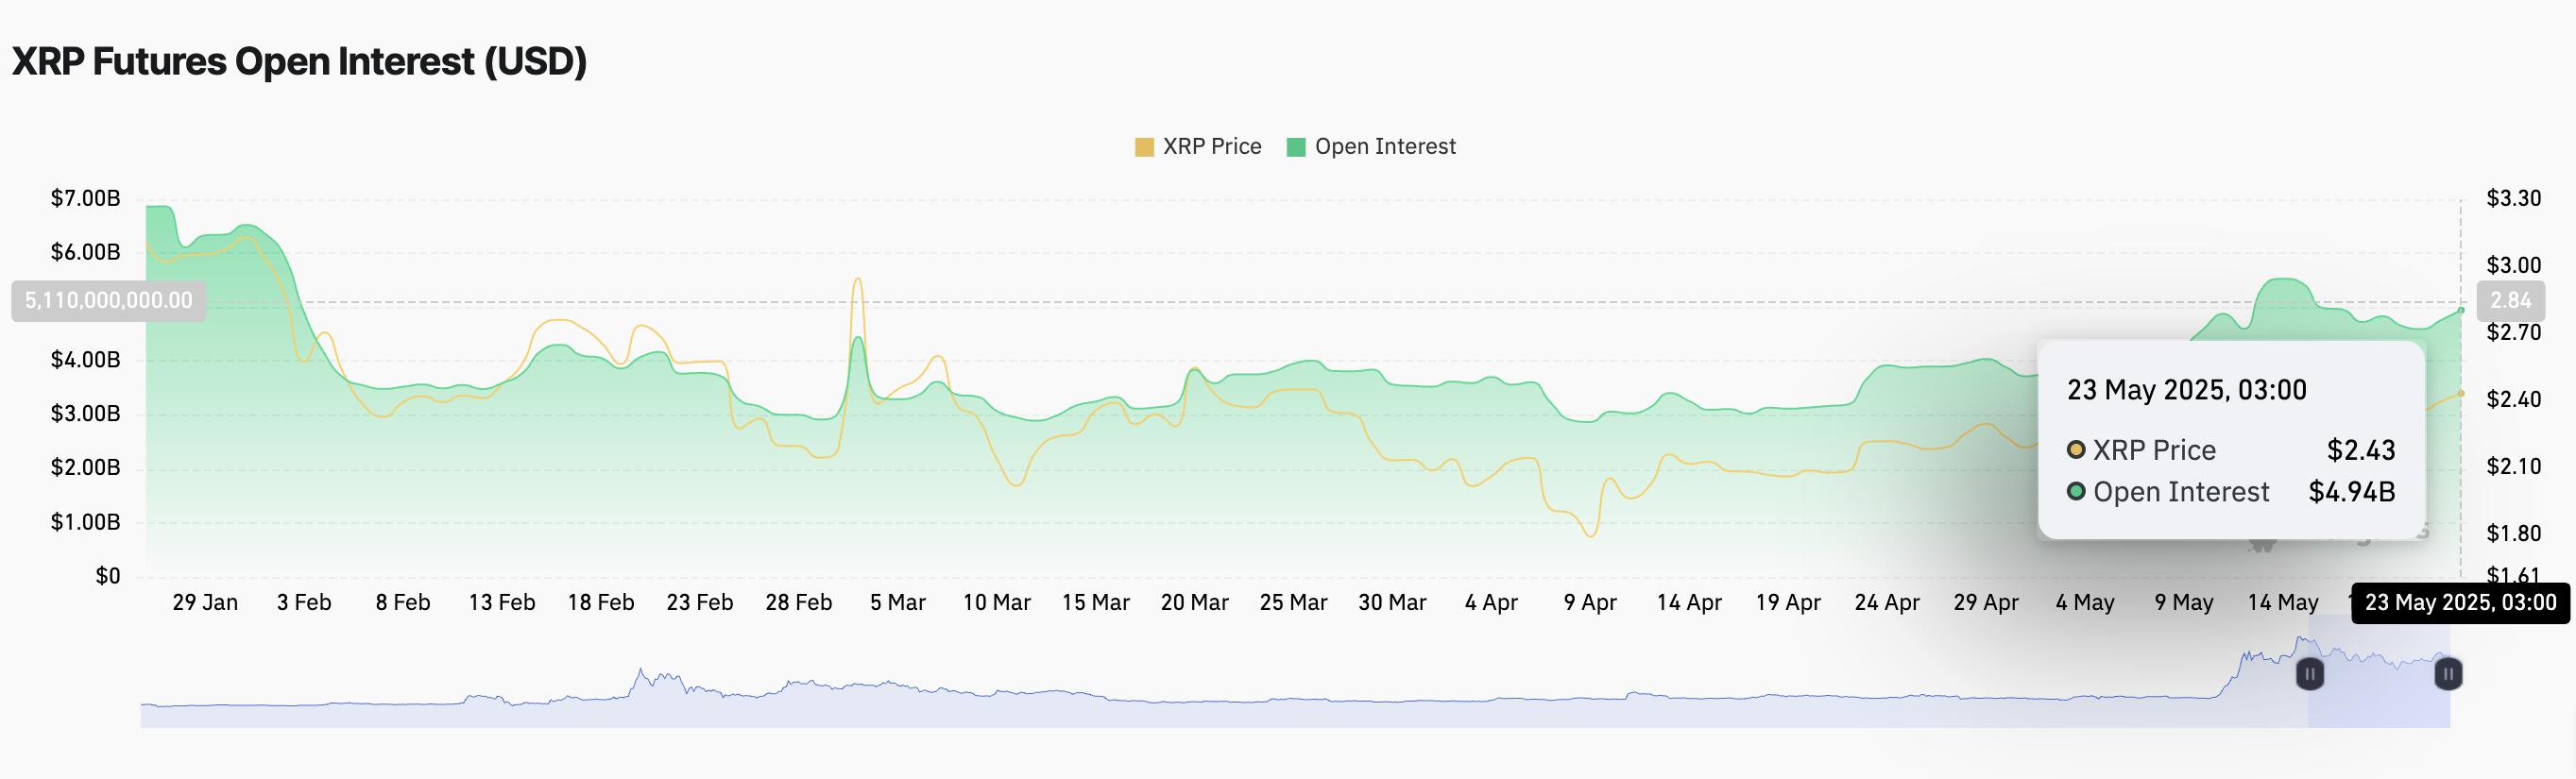
XRP futures Open Interest | Source: CoinGlass
As observed on the chart below, rising trading volume to $4.63 billion alongside the uptrend in OI signals heightened market activity and investor enthusiasm. This could fuel the ongoing uptrend for a return above $3.00.
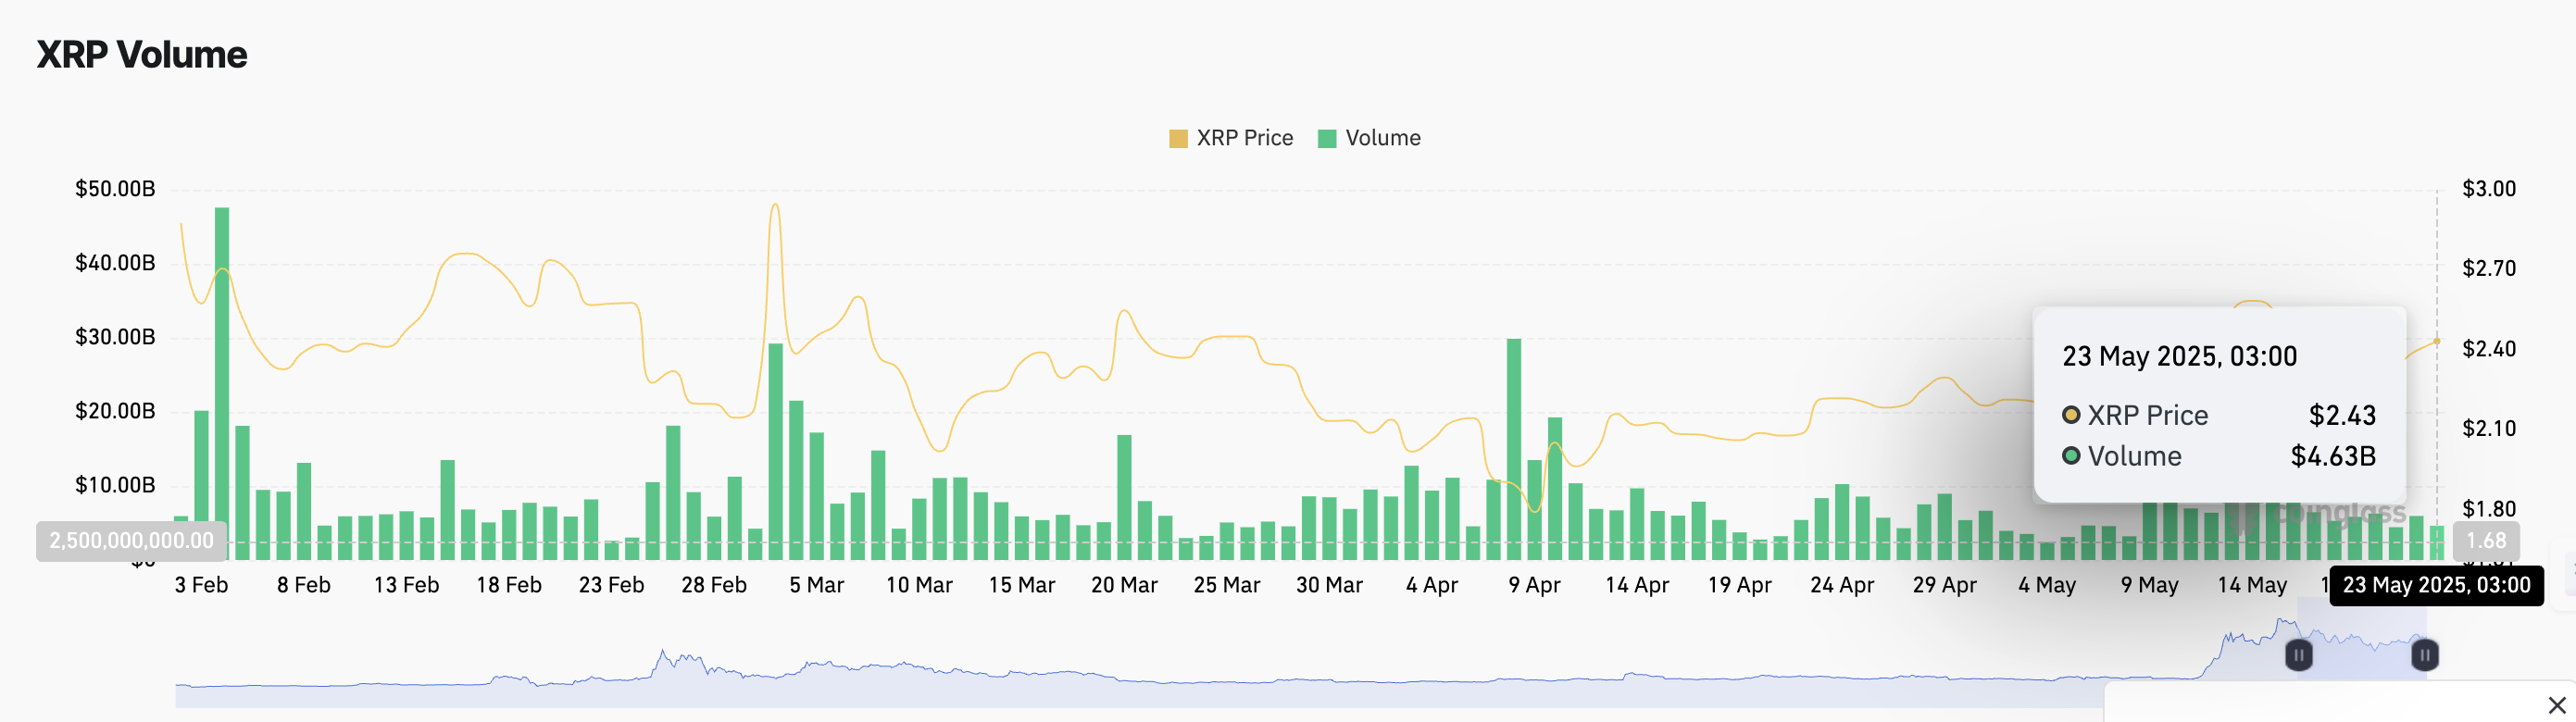
XRP futures volume | Source: CoinGlass
Looking ahead: XRP's rally holds steady
The mid-week resumed uptrend appears to hold steady above upward-trending moving averages, including the 50-day Exponential Moving Average (EMA) at $2.30, the 100-day EMA at $2.26 and the 200-day EMA at $2.06.
A higher low pattern established along an ascending trendline (dotted) affirms bullish control, supported by the Relative Strength Index (RSI) indicator's slight uptrend bias above the 50 midline. Movement of the RSI toward the overbought region above 70 would mean a strong uptrend.
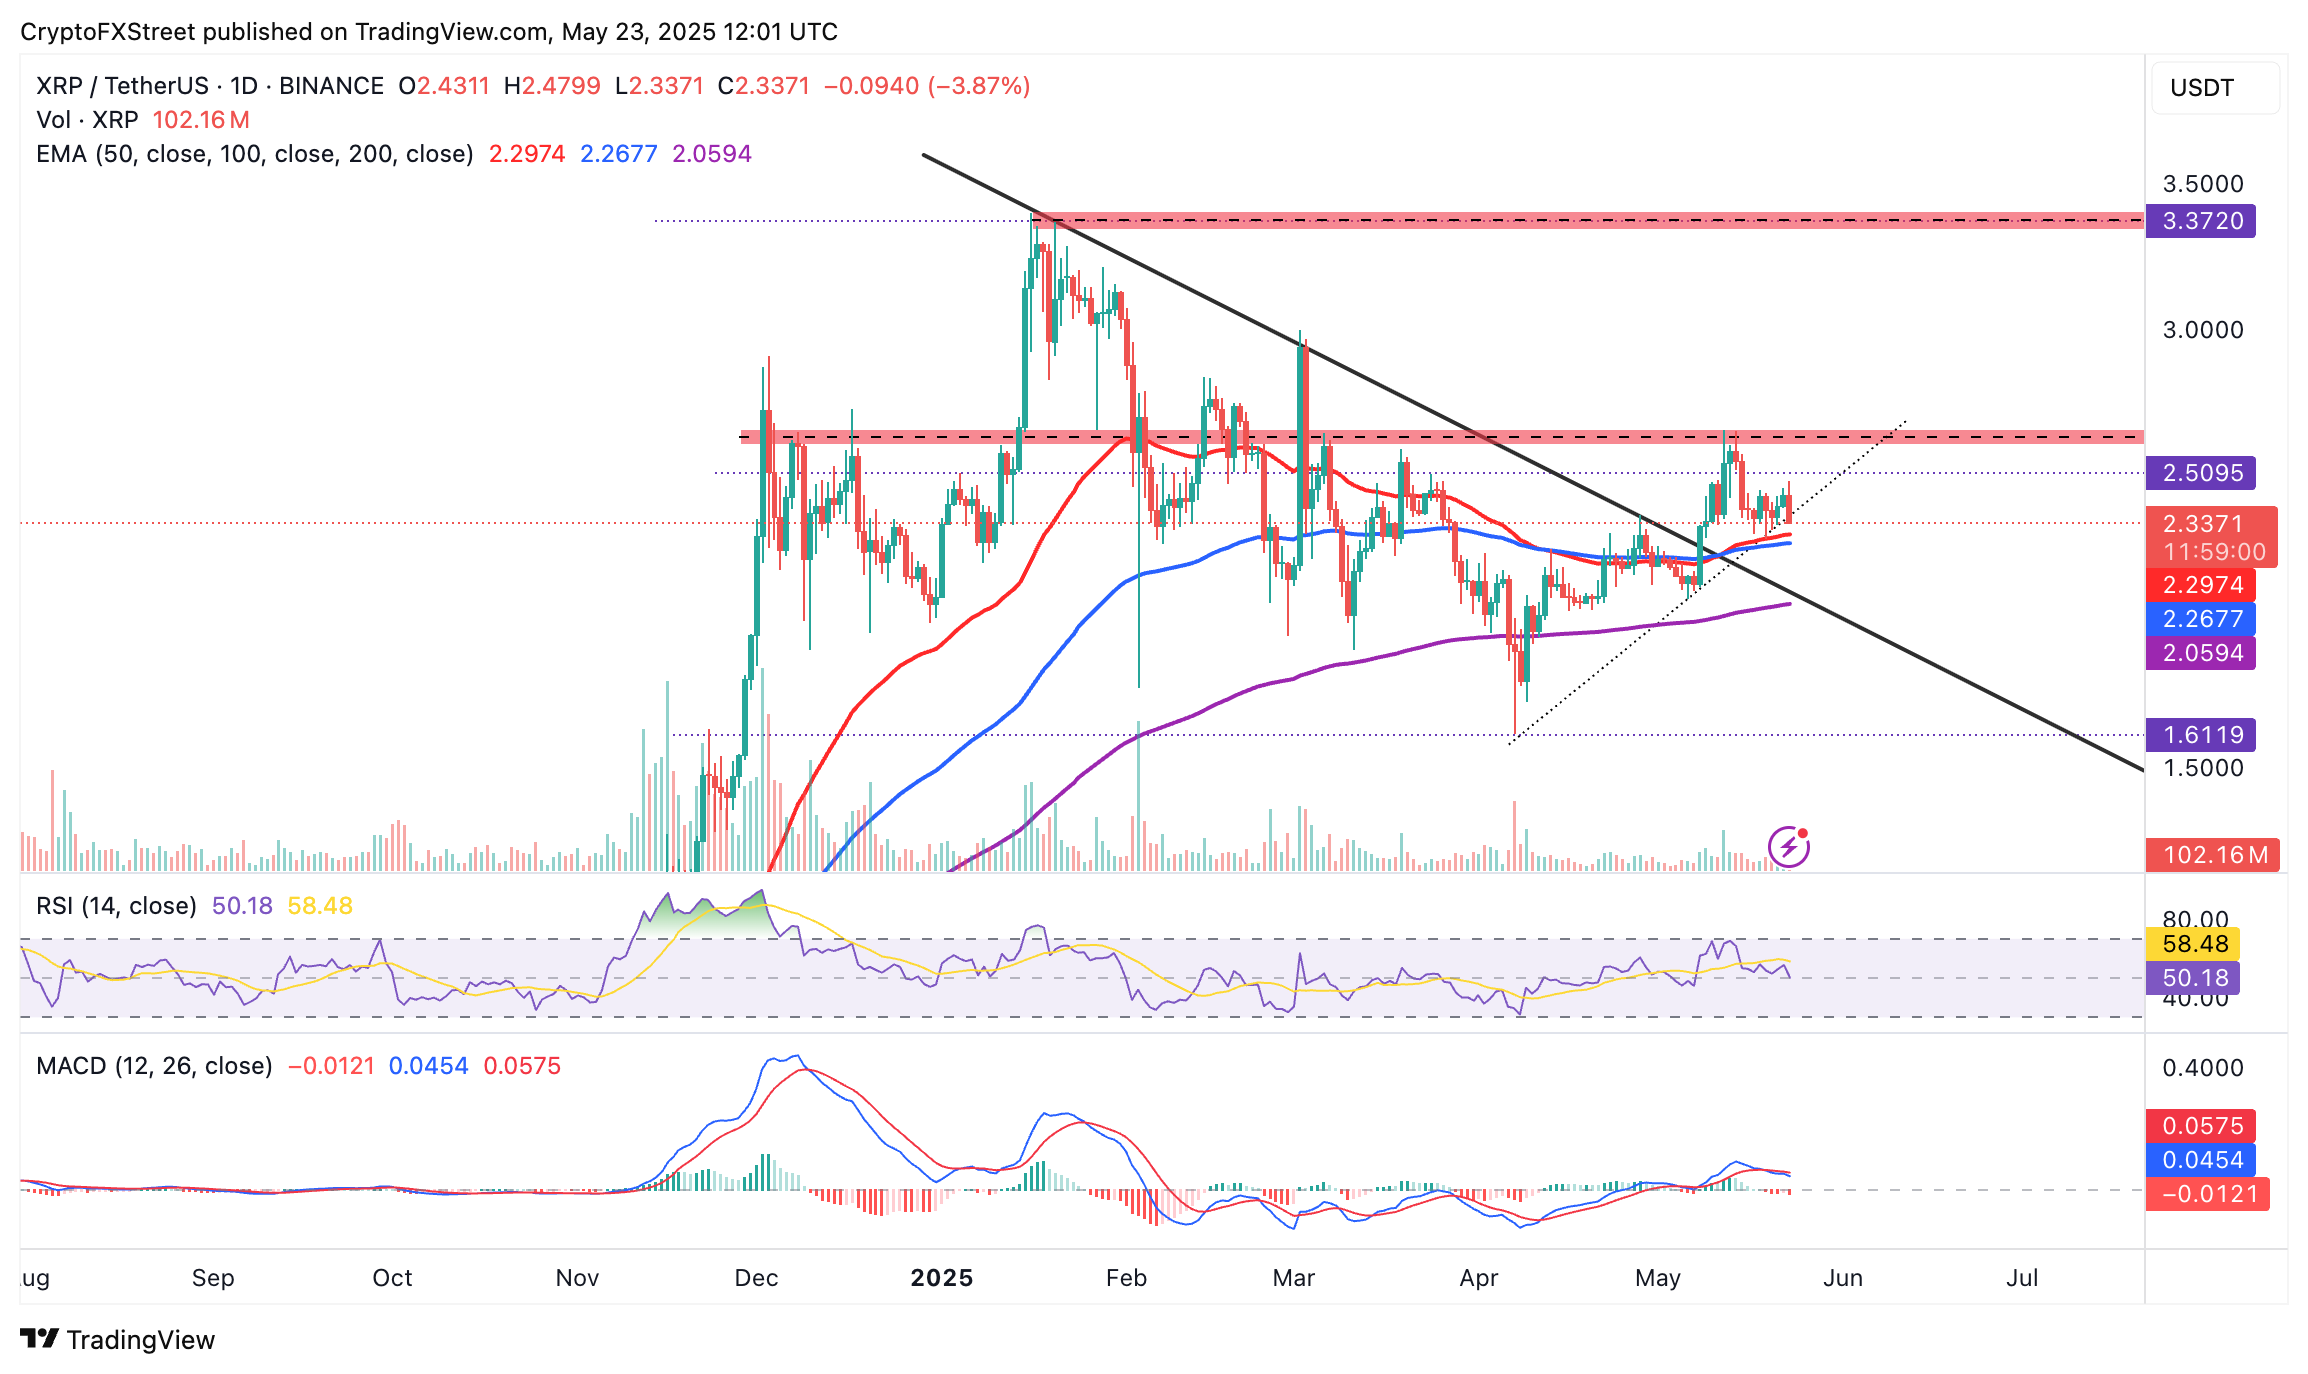
XRP/USDT daily chart
On the other hand, levels to watch in case of an increase in selling pressure include the 50-day EMA at $2.30, the 100-day EMA at $2.26 and the 200-day EMA at $2.06.
Despite the mixed signals flaunted by XRP's on-chain metrics and the technical outlook, the XRP/BTC trading pair has confirmed a golden cross pattern for the first time since 2017 in the weekly time frame, as shown in the chart.
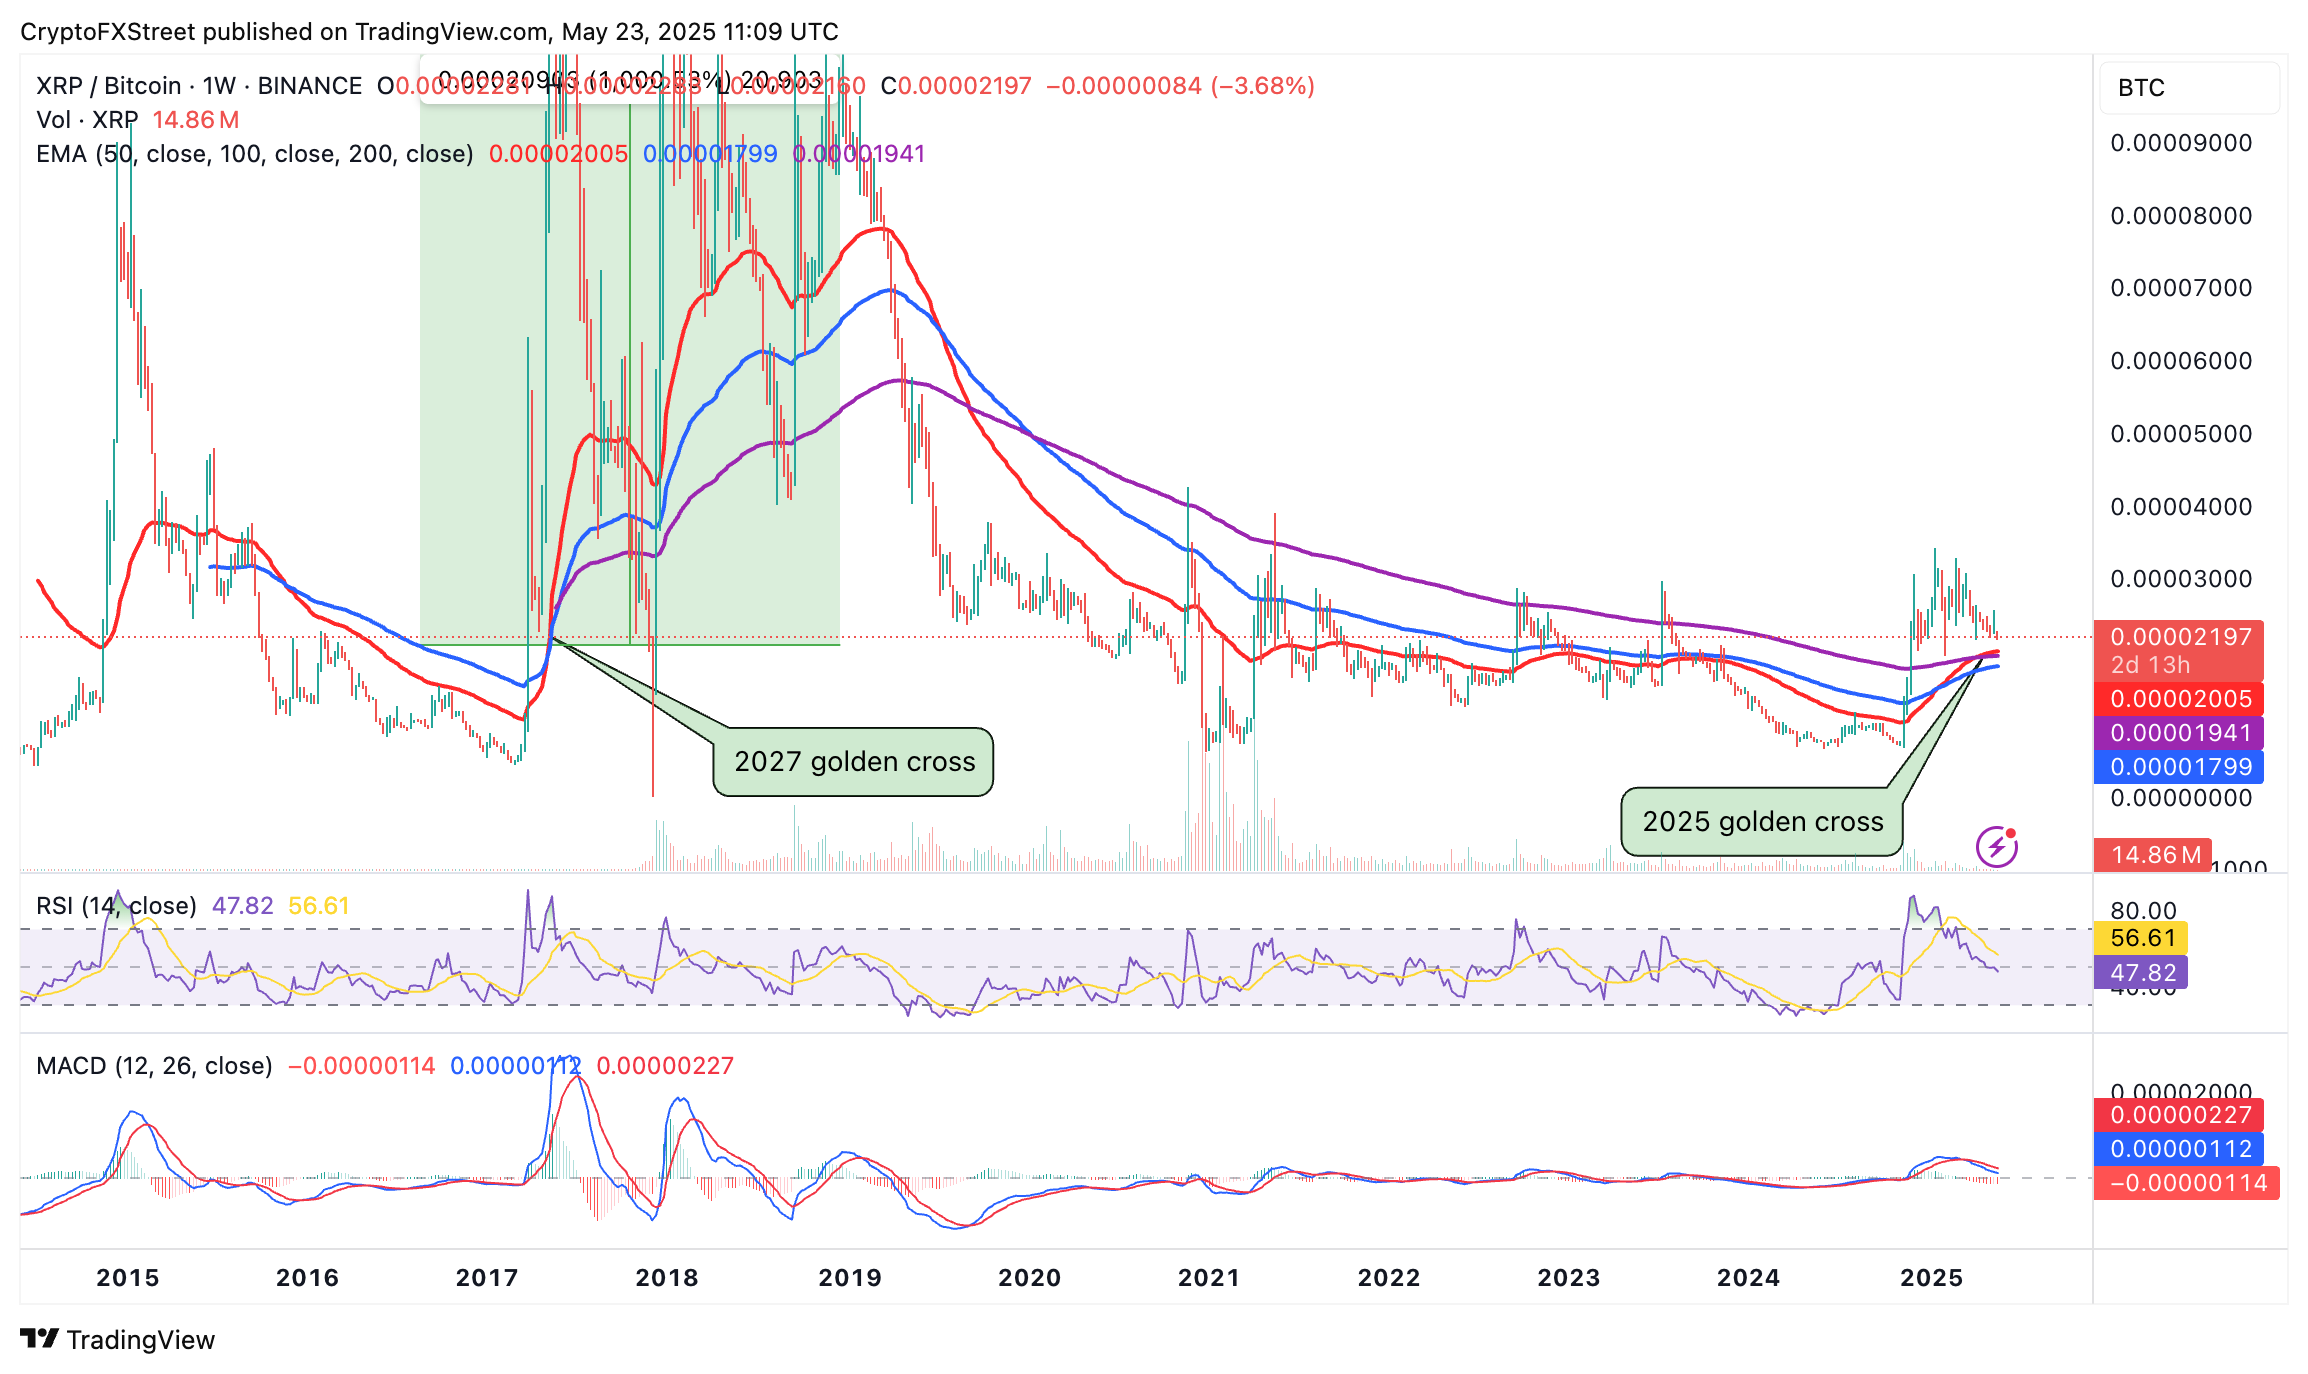
XRP/BTC weekly chart
A golden cross is a bullish pattern that occurs when a shorter-term moving average flips above a longer-term one. For instance, on the chart above, the 50-week EMA currently sits above the 200-week EMA, hinting at a potentially massive bull run.
The 2017 golden cross gave way to a massive 1,000% rally from a ratio of 0.00002 to 0.00022, which coincided with XRP's price surge to all-time highs of $3.40 in January 2018.
Cryptocurrency metrics FAQs
The developer or creator of each cryptocurrency decides on the total number of tokens that can be minted or issued. Only a certain number of these assets can be minted by mining, staking or other mechanisms. This is defined by the algorithm of the underlying blockchain technology. On the other hand, circulating supply can also be decreased via actions such as burning tokens, or mistakenly sending assets to addresses of other incompatible blockchains.
Market capitalization is the result of multiplying the circulating supply of a certain asset by the asset’s current market value.
Trading volume refers to the total number of tokens for a specific asset that has been transacted or exchanged between buyers and sellers within set trading hours, for example, 24 hours. It is used to gauge market sentiment, this metric combines all volumes on centralized exchanges and decentralized exchanges. Increasing trading volume often denotes the demand for a certain asset as more people are buying and selling the cryptocurrency.
Funding rates are a concept designed to encourage traders to take positions and ensure perpetual contract prices match spot markets. It defines a mechanism by exchanges to ensure that future prices and index prices periodic payments regularly converge. When the funding rate is positive, the price of the perpetual contract is higher than the mark price. This means traders who are bullish and have opened long positions pay traders who are in short positions. On the other hand, a negative funding rate means perpetual prices are below the mark price, and hence traders with short positions pay traders who have opened long positions.
추천 기사


