


Bitcoin Weekly Forecast: BTC in positive tone ahead of third highest-returning month
- Bitcoin price holds above $104,000 on Friday after bouncing off its 50-day EMA earlier this week.
- A K33 Research explains how Nvidia’s big drop this week, driven by DeepSeek, affected Bitcoin price.
- Bitcoin’s historical monthly returns data shows BTC generally yielded the third highest returns for traders in February, averaging 15.66%.
Bitcoin (BTC) price hovers around $104,000 on Friday after bouncing off its 50-day Exponential Moving Average earlier this week. A K33 Research explains how Nvidia’s big drop in stock valuation this week, driven by DeepSeek, affected Bitcoin’s price. While BTC ended January positively, with over 11% gains, historical returns data shows that the biggest cryptocurrency by market capitalization generally yielded the third-highest monthly returns for traders in February, averaging 15.66%.
Bitcoin correlation to traditional markets and China’s Deepseek
Bitcoin’s price started this week with a correction, reaching a low of $97,777, but recovered and closed above $102,000 on Monday. This correction triggered a wave of liquidations across the crypto market, resulting in $860.55 million in total liquidations that day, almost $260 million specifically in BTC, according to data from CoinGlass.
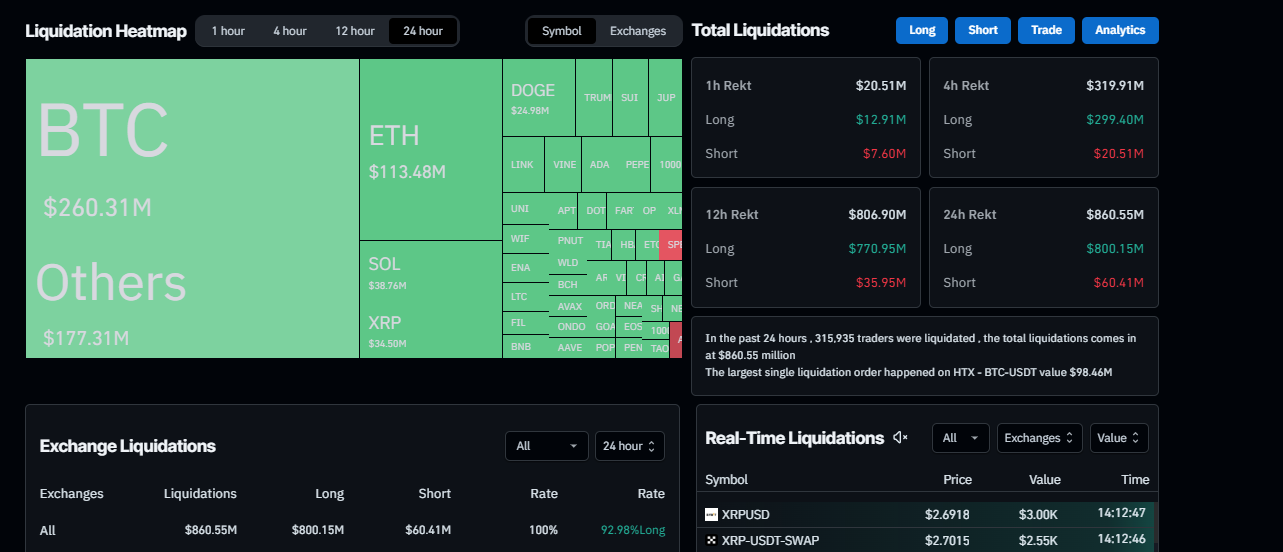
Liquidation Heatmap on Monday. Source: Coinglass
QCP Capital’s report on Monday states, “BTC dipped below $100k, along with other risk assets, as news of China’s Deepseek continues to spread from the weekend.”
The report further explains that the Chinese LLM potentially threatens US equity markets by disrupting US Artificial Intelligence (AI) dominance with their cost efficiency and groundbreaking open-source technology.
K33 Research’s “Ahead of the curve” report published on Tuesday explains how Nvidia’s big drop in stock valuation this week, driven by DeepSeek, affected Bitcoin’s price.
The report explains that a stronger correlation between BTC and US equities has recently emerged. BTC was not immune to Nvidia’s drop caused by the announcement of DeepSeek, a reportedly cost-effective Chinese Artificial Intelligence (AI) start-up rival to existing solutions. NVIDIA dropped 17%, while the Nasdaq saw a 3% fall. BTC dropped a relatively moderate 2.6%.
The report states, “One can argue that the BTC drop on Monday was caused by noise, but the aggressive de-risking on CME speaks volumes of general caution among professional traders.”
The report also noted that CME premiums quickly fell to negative territory for the first time since August 2023, while open interest had its largest daily drop by 17,225 BTC. Additionally, January contracts expiring on Friday will further the decline in open interest. While premiums have since returned to slightly positive territory, this CME activity shows bearish sentiment, favoring caution.
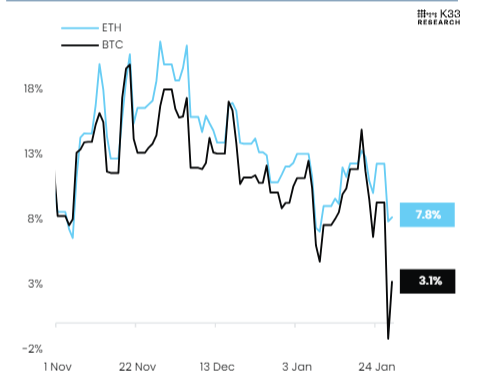
CME BTC and ETH Futures annualized rolling 1-month basis chart. Source: K33 Research
US macroeconomic data effect on Bitcoin price
Bitcoin price was moderately supported by the US macroeconomic data releases this week. Bitcoin price rose slightly following Wednesday’s Federal Open Market Committee (FOMC) meeting. As widely expected, the US Federal Reserve (Fed) decided to keep the fed funds rate unchanged at the 4.25% — 4.50% range while shifting slightly hawkish after acknowledging no improvement in inflation.
The Federal Reserve’s monetary policy statement highlighted a resilient labor market while maintaining that risks to its dual mandate goals “are roughly in balance.” The committee also hinted at an uncertainty of future rate cuts due to ongoing policy changes in the US.
Following the announcement, US Treasury yields rose, with the 10-year note gaining 4.5 basis points to 4.581%. At the same time, the US Dollar Index (DXY) climbed 0.17% to a session high of 108.10 despite Bitcoin’s 2.37% surge on Wednesday.
Moreover, on Thursday, the US released the first preliminary of the 2024 Q4 Gross Domestic Product (GDP), which showed that the economy grew at an annualized pace of 2.3% in the three months to December, below the 2.6% expected and the 3.1% reported in Q3. The weak growth-related data undermined USD demand, benefiting risky assets like Bitcoin.
Bitcoin on-chain metrics mirrors the 2015–2018 bullish cycle
Glassnode’s “Thinking Ahead” report on Wednesday highlights that the current bull market shows several structural similarities to the 2015–2018 cycle.
The report explains that Bitcoin’s rally reflects a maturing market with reduced overall cyclical growth, measured bull market drawdowns, and moderated Realized Cap expansion.
Although lower than prior peaks, as shown in the graph below, the current cycle’s 2.1 times Realized Cap growth is below the 5.7 times peak of the last cycle. It aligns with the 2015–2018 cycle at this stage, leaving room for potential euphoria-driven expansion in the longer term.
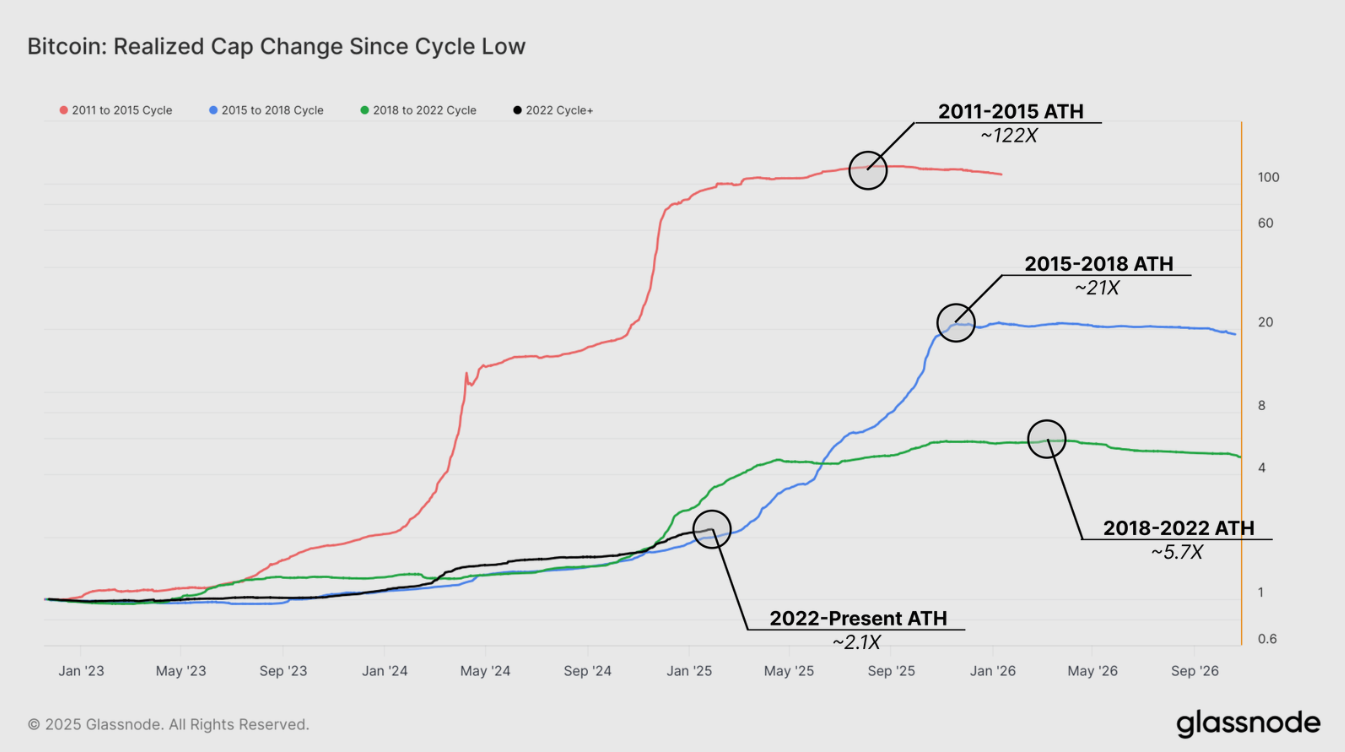
Bitcoin Realized Cap Change Since Cycle Low chart. Source: Glassnode
The report states, “The widely discussed drop in exchange balances does not signal a drastic depletion when accounting for the supply migration to ETF wallets. Therefore, the notion of an imminent supply shock due to declining exchange balances is inaccurate.”
The graph below shows that Bitcoin balances on centralized exchanges have fallen to 2.7 million BTC, down from 3.1 million BTC in July 2024. While many interpret this as a form of supply shock caused by a mass withdrawal of coins by individual investors — potentially creating upward price pressure — the report explains that most of this decline stems from coins reshuffling into Exchange Traded Fund (ETF) wallets managed by custodians like Coinbase.
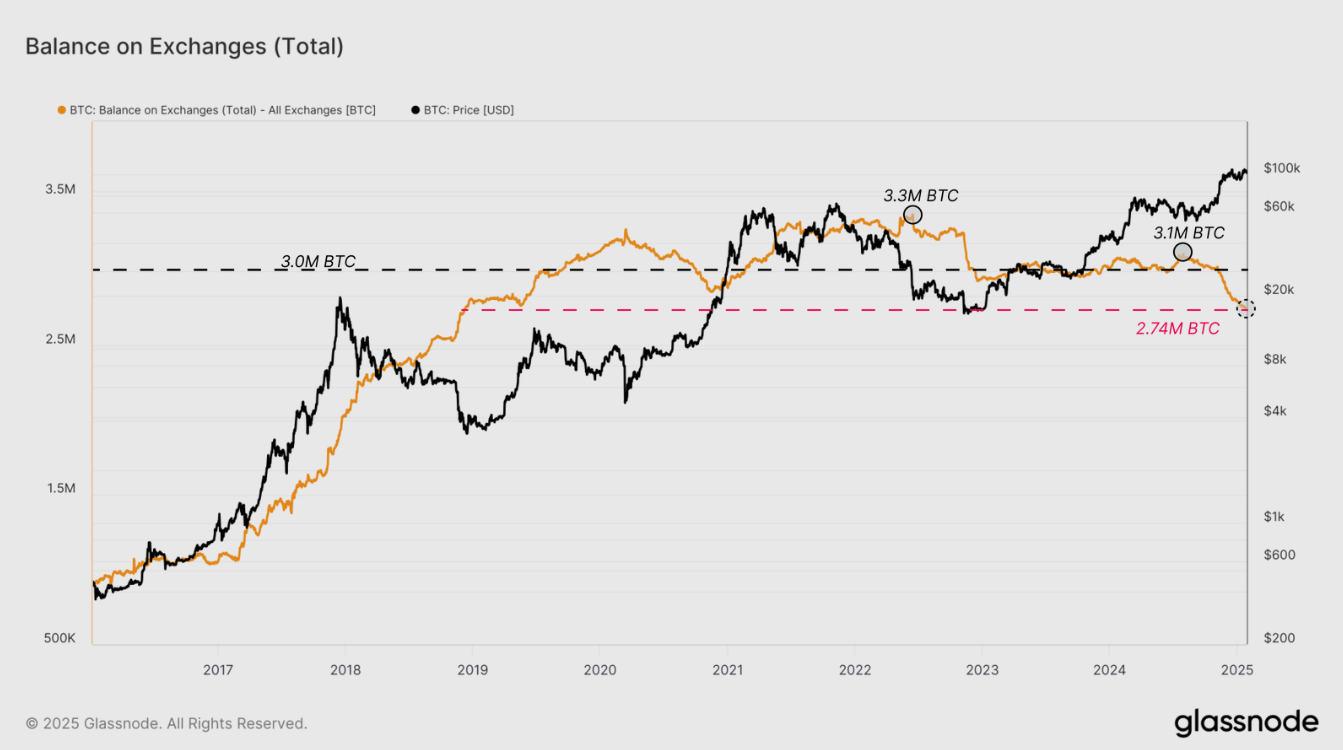
Balance on exchanges (Total) chart. Source: Glassnode
Instead, capital rotation from long-term holders to new investors remains the primary driver of market cycles. Following two distribution waves, the current cycle’s wealth rotation size and rate mirror the late 2017 and early 2021 bull markets. This suggests a demand exhaustion phase may follow in the short term, potentially leading to a predominant HODLing sentiment in the market.
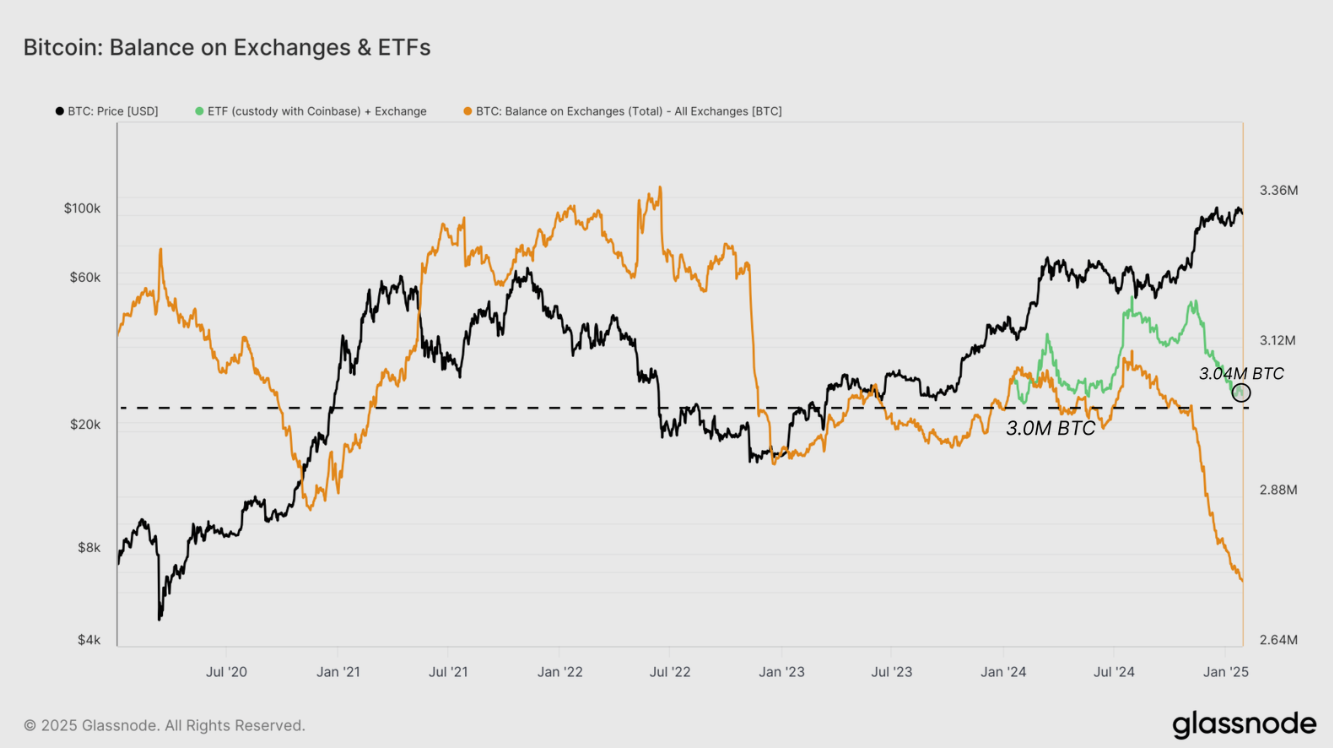
Bitcoin: Balance on Exchanges & ETFs chart. Source: Glassnode
What is there for Bitcoin in February?
Bitcoin began the year by hitting a new all-time high of $109,588 on January 20, ending with a return of over 11.00% in the month. According to Bitcoin’s historical data, BTC generally yielded the third-highest returns for traders in February, averaging 15.66%. Traders could expect an optimistic boost in the next month.
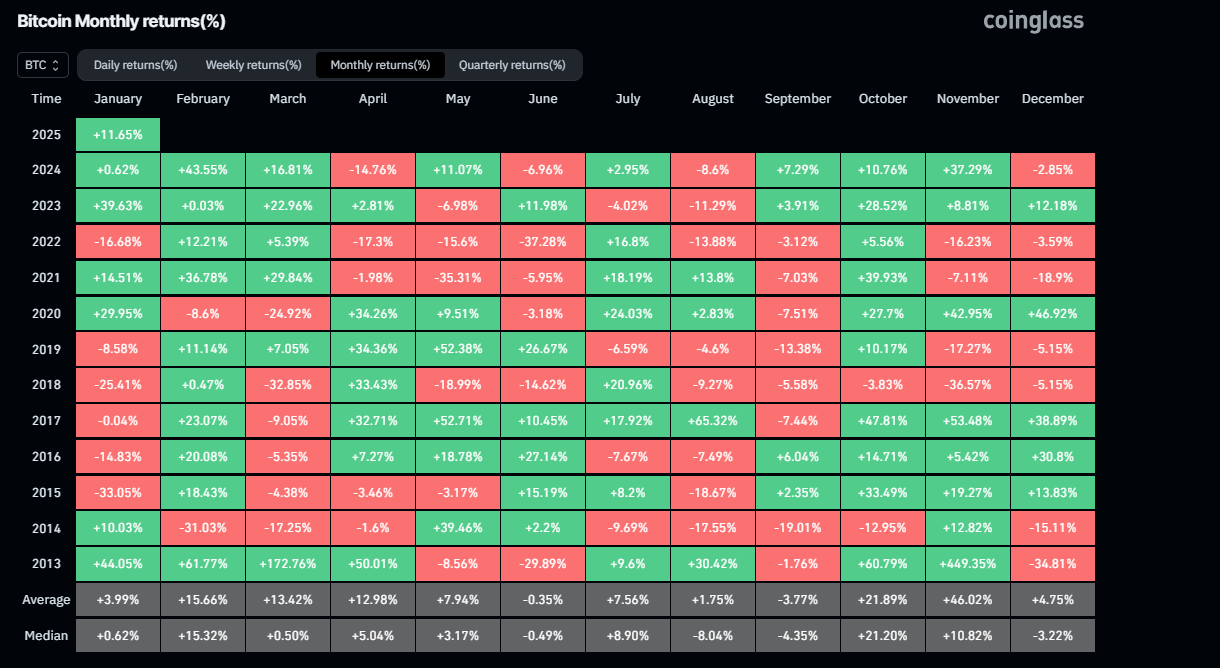
Bitcoin historical monthly returns chart. Source: Coinglass
Bitcoin bull aims for higher highs
Bitcoin price found support around its 50-day Exponential Moving Average (EMA) at $98,845 on Monday and rose 2.69% on Thursday, closing above $104,700 on that day. At the time of writing on Friday, BTC hovers around $104,000.
If BTC continues recovering, it could retest its January 20 all-time high of $109,588.
The Relative Strength Index (RSI) indicator on the daily chart reads 57, rebounding above its neutral level of 50 on Tuesday and signaling a rise in bullish momentum. However, the Moving Average Convergence Divergence (MACD) indicator converges, indicating indecisiveness among traders. If the MACD flips to a bullish crossover on a daily basis, it would give a buy signal and suggest an uptrend.
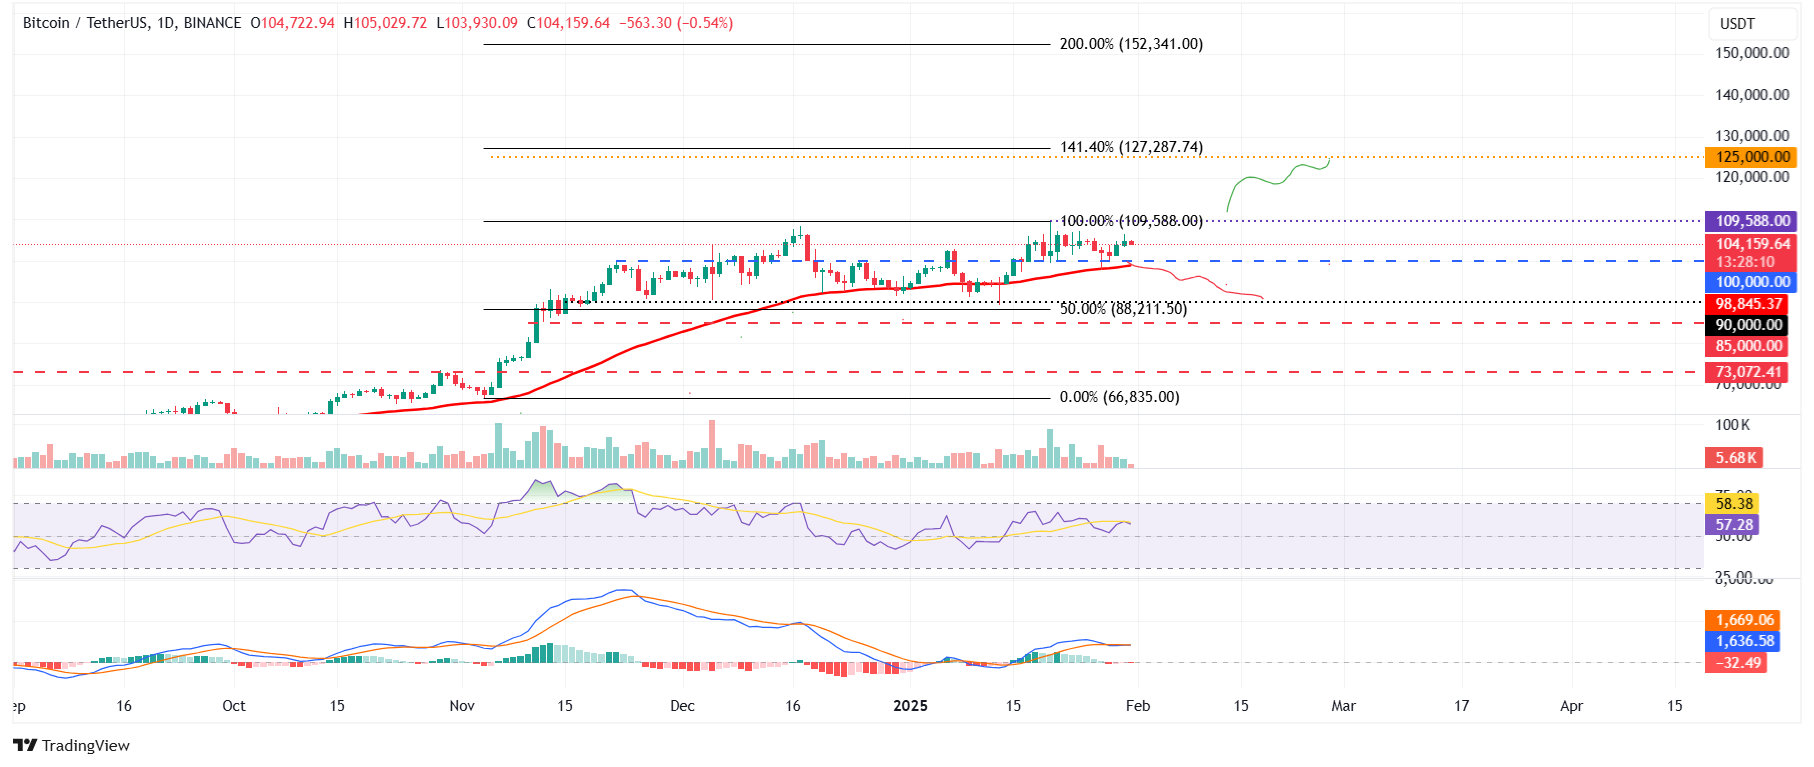
BTC/USDT daily chart
However, if BTC breaks below $100,000 and closes below the 50-day EMA on a daily basis, it could extend the decline and test its next key support around $90,000.
Bitcoin, altcoins, stablecoins FAQs
Bitcoin is the largest cryptocurrency by market capitalization, a virtual currency designed to serve as money. This form of payment cannot be controlled by any one person, group, or entity, which eliminates the need for third-party participation during financial transactions.
Altcoins are any cryptocurrency apart from Bitcoin, but some also regard Ethereum as a non-altcoin because it is from these two cryptocurrencies that forking happens. If this is true, then Litecoin is the first altcoin, forked from the Bitcoin protocol and, therefore, an “improved” version of it.
Stablecoins are cryptocurrencies designed to have a stable price, with their value backed by a reserve of the asset it represents. To achieve this, the value of any one stablecoin is pegged to a commodity or financial instrument, such as the US Dollar (USD), with its supply regulated by an algorithm or demand. The main goal of stablecoins is to provide an on/off-ramp for investors willing to trade and invest in cryptocurrencies. Stablecoins also allow investors to store value since cryptocurrencies, in general, are subject to volatility.
Bitcoin dominance is the ratio of Bitcoin's market capitalization to the total market capitalization of all cryptocurrencies combined. It provides a clear picture of Bitcoin’s interest among investors. A high BTC dominance typically happens before and during a bull run, in which investors resort to investing in relatively stable and high market capitalization cryptocurrency like Bitcoin. A drop in BTC dominance usually means that investors are moving their capital and/or profits to altcoins in a quest for higher returns, which usually triggers an explosion of altcoin rallies.
추천 기사


