

What to expect from Bitcoin in September, historically a red month for BTC
- Bitcoin traders took $4.251 billion in profits in August 2024, contributing to the selling pressure on BTC.
- Bitcoin whale transactions valued at $100,000 and higher hit their lowest point in nearly four years.
- BTC remains undervalued on the 7-day and 30-day timeframe.
- Bitcoin has historically yielded negative returns in September, BTC could extend losses if the pattern continues.
Bitcoin (BTC) on-chain metrics support gains in Bitcoin, however, historically the largest cryptocurrency has yielded negative returns for traders in the month of September. The ongoing cycle is considered different from previous ones with Bitcoin Spot ETFs approved this year and rising institutional demand for the asset.
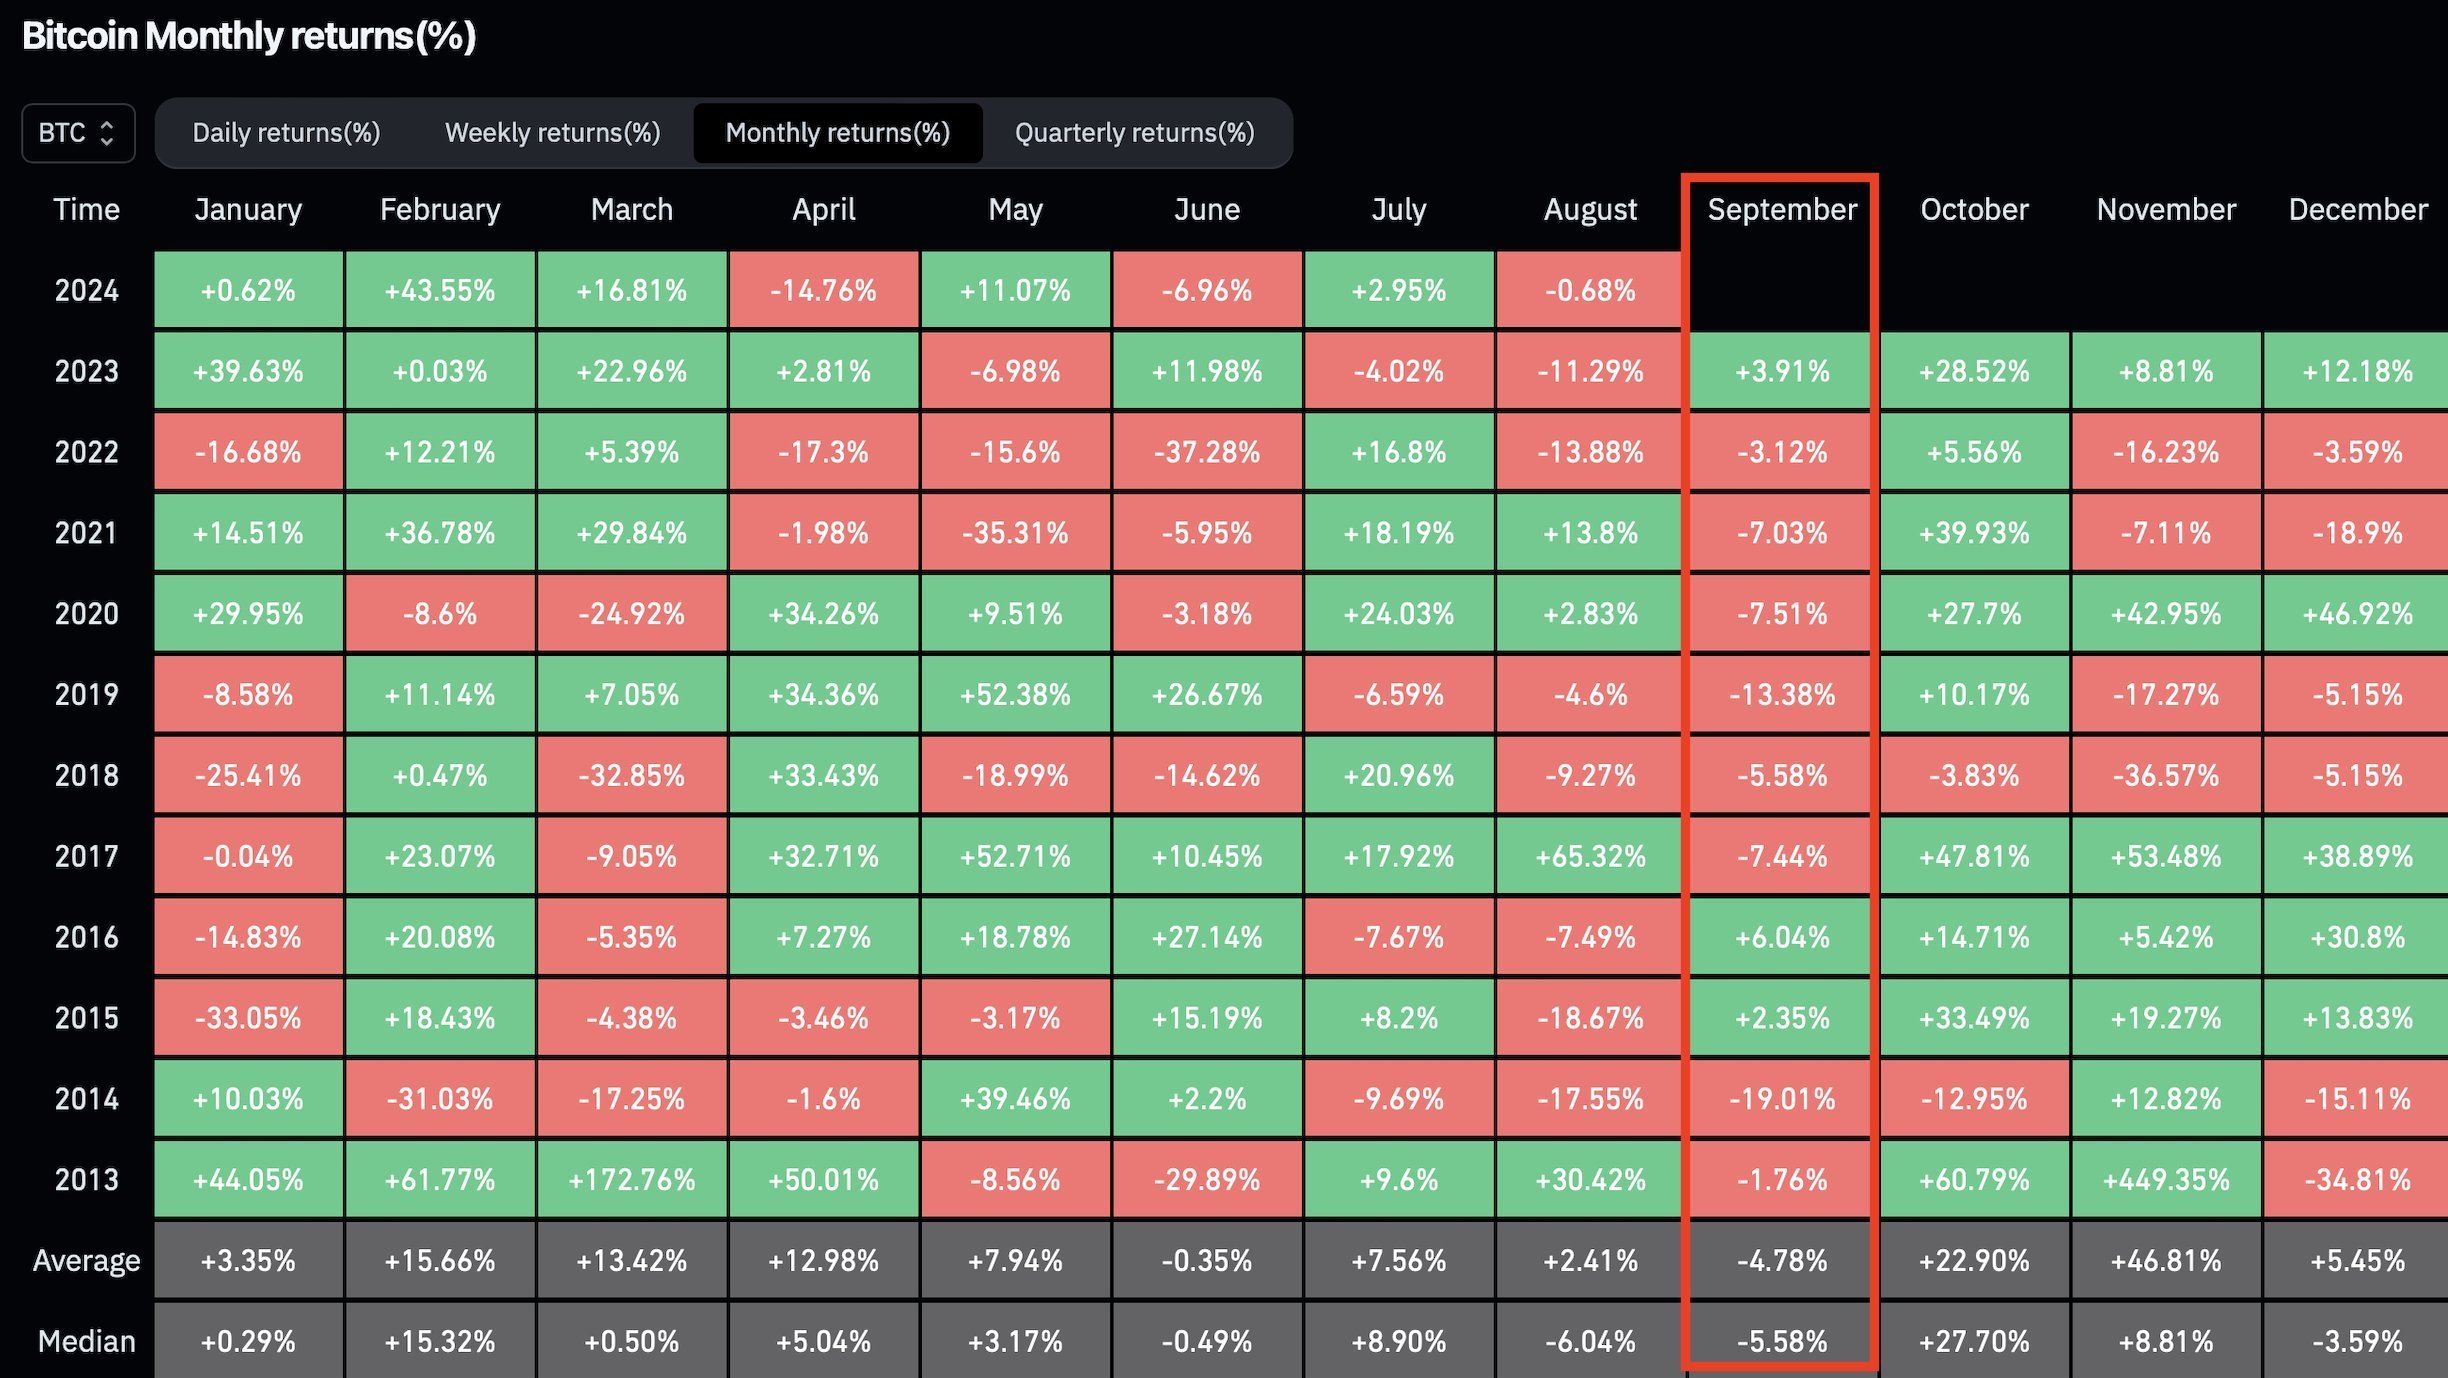
Bitcoin monthly returns
BTC price could sustain above key support at $60,000, if institutional capital continues to flow into Bitcoin ETFs and drives consistent demand for the cryptocurrency.
On-chain metrics could push Bitcoin higher
Three on-chain metrics support gains in Bitcoin. Santiment data shows that crypto traders realized $4.251 billion in gains in August 2024. This is represented by large positive spikes in Bitcoin’s Network Realized Profit/Loss (NPL) metric.
While large scale profit-taking could push BTC lower, the whale transaction metric shows that large volume transfers valued at $100,000 and higher have declined, down to their lowest point in nearly four years.
When combined, the two metrics imply there is likelihood of gains in Bitcoin, whales are yet to realize large scale profits and are likely holding on to their BTC.
 [15.14.19, 01 Sep, 2024]-638607842301171133.png)
Bitcoin network realized profit/loss
 [15.15.29, 01 Sep, 2024]-638607842595925700.png)
Bitcoin whale transactions valued at $100,000 and higher
Bitcoin supply on exchanges dipped to its lowest level since December 2018, per Santiment data. Dwindling supply on exchanges means there is a lower volume of BTC in exchange wallets and there is room for BTC gains.
Typically, declining supply is considered positive for an asset’s price.
The Market Value to Realized Value (MVRV) metric, used to identify whether an asset is undervalued or overvalued in a given timeframe shows that BTC is undervalued on both the 7-day and 30-day timeframes.
 [15.15.56, 01 Sep, 2024]-638607843301023658.png)
Bitcoin MVRV 7-day and 30-day
Bitcoin hovers close to $60,000
Bitcoin weekly chart shows BTC could sweep liquidity at $49,000, a key support level for the asset, before beginning a recovery. This marks a 15.58% decline in Bitcoin price.
The Moving Average Convergence Divergence (MACD) momentum indicator shows red histogram bars under the neutral line, meaning there is underlying negative momentum in Bitcoin price.
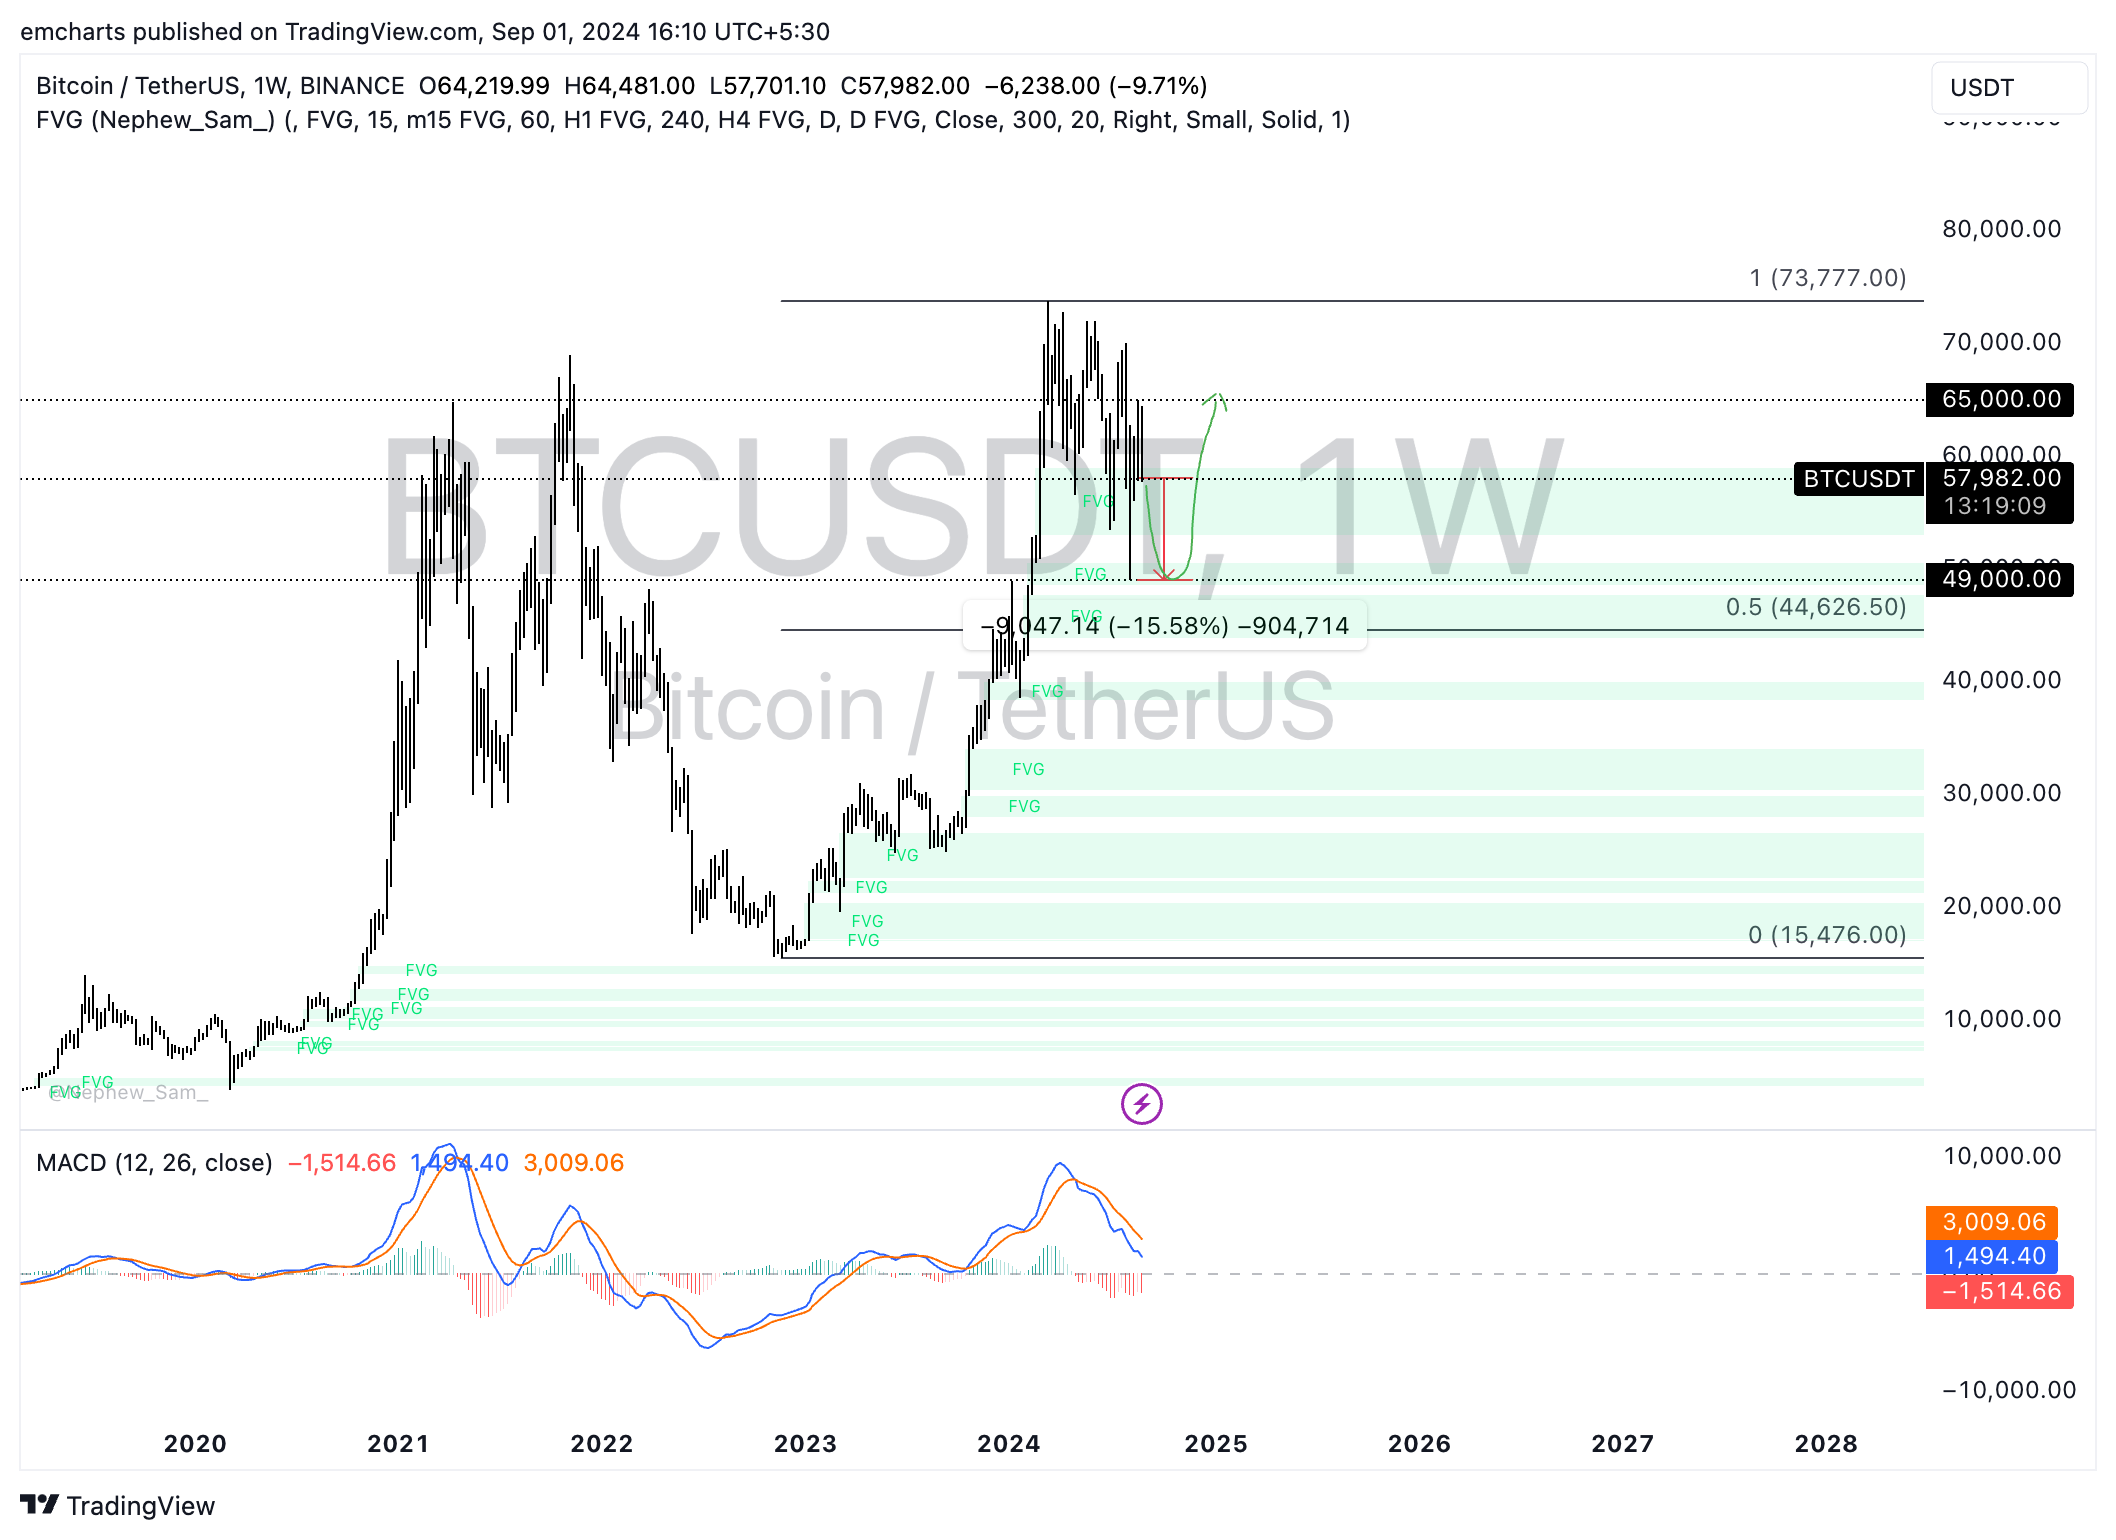
BTC/USDT weekly chart
Bitcoin could see a weekly candlestick close above $60,000, invalidating the thesis and pushing BTC towards the $65,000 target, the next key resistance for the asset.
Bitcoin, altcoins, stablecoins FAQs
Bitcoin is the largest cryptocurrency by market capitalization, a virtual currency designed to serve as money. This form of payment cannot be controlled by any one person, group, or entity, which eliminates the need for third-party participation during financial transactions.
Altcoins are any cryptocurrency apart from Bitcoin, but some also regard Ethereum as a non-altcoin because it is from these two cryptocurrencies that forking happens. If this is true, then Litecoin is the first altcoin, forked from the Bitcoin protocol and, therefore, an “improved” version of it.
Stablecoins are cryptocurrencies designed to have a stable price, with their value backed by a reserve of the asset it represents. To achieve this, the value of any one stablecoin is pegged to a commodity or financial instrument, such as the US Dollar (USD), with its supply regulated by an algorithm or demand. The main goal of stablecoins is to provide an on/off-ramp for investors willing to trade and invest in cryptocurrencies. Stablecoins also allow investors to store value since cryptocurrencies, in general, are subject to volatility.
Bitcoin dominance is the ratio of Bitcoin's market capitalization to the total market capitalization of all cryptocurrencies combined. It provides a clear picture of Bitcoin’s interest among investors. A high BTC dominance typically happens before and during a bull run, in which investors resort to investing in relatively stable and high market capitalization cryptocurrency like Bitcoin. A drop in BTC dominance usually means that investors are moving their capital and/or profits to altcoins in a quest for higher returns, which usually triggers an explosion of altcoin rallies.
추천 기사


