


Top Altcoins Price Forecast: Ripple, Solana, and Cardano extend decline as sellers resurface
- Ripple ticks lower on Thursday after three consecutive days of recovery, remaining capped within a falling channel pattern.
- Cardano is down 2%, extending the bearish breakout of a rising support trendline as selling pressure remains firm.
- Solana edges lower from its 50-day EMA at $106.76, risking a decline below $100 toward the 200-day EMA at $98.71.
Major altcoins, including Ripple (XRP), Cardano (ADA) and Solana (SOL), are trading in the red on Thursday as near-term selling pressure resurfaces. The technical outlook for the altcoins indicates a downside bias as XRP remains trapped in a falling channel pattern while ADA and SOL are capped by key moving averages.
Ripple extends losses in a bearish channel
Ripple trades around $1.3442 at press time on Thursday, flipping bearish after three consecutive days of recovery. On the four-hour chart, XRP remains capped within a falling channel pattern, with the overhead trend line connecting the September 23 and October 6 highs near $0.3669, while the lower boundary line connects the September 24 and October 18 lows near $1.2252.
From a technical perspective, the resistance cluster of the 200-period Exponential Moving Average (EMA) near $1.3827 and the overhead trend line capped gains the previous day. The 50-period EMA at $1.368 serves as immediate support, and a confirmed breakout could extend the decline toward the October 18 low at $1.2562, implying downside potential of over 6%.
Momentum on the four-hour chart remains weak, with the Moving Average Convergence Divergence (MACD) easing towards its signal line as the bullish histogram contracts, while the declining Relative Strength Index (RSI) is at 53, suggesting weak buying pressure.
Looking up, XRP must surpass the 200-period EMA at $1.3842, slightly above the overhead resistance line, which could confirm the falling channel pattern breakout. This could extend the recovery toward the $1.4517 horizontal level set by the September 24 low, followed by the $1.50 psychological level.
Cardano takes a bearish path
Cardano trades at $0.2205, keeping a bearish near-term tone as it holds below the 50-day EMA at $0.2281 and the 200-day EMA near $0.2400. The recent break under the former uptrend support line, now resistance around $0.2349, suggests rallies are being faded.
Momentum on the daily chart shifts bearish as indicated by the declining Moving Average Convergence Divergence (MACD) in the negative territory and the Relative Strength Index (RSI) at 42 hovering just above the oversold zone.
The path of least resistance for Cardano highlights a downside potential toward its initial support at the $0.1894 horizontal level set by the August 30 low.
Looking up, immediate resistance is seen at the 50-day EMA at $0.2281, followed by the previously broken rising trend line near $0.2349, with the 200-day EMA around $0.2400 acting as a higher cap if buyers attempt a deeper recovery.
Solana continues to face strong headwinds
Solana trades at $105.53 on Thursday, keeping a bearish near-term tone. The 50-day EMA at $106.76 continues to cap upside, while SOL holds above the 200-day EMA at $98.71, suggesting a capped market within a broader medium-term uptrend.
Momentum indicators on the daily chart suggest that buyers are losing their upper hand. The RSI around 43 points to subdued buying pressure, while the MACD remains negative, suggesting that downside momentum persists.
The 200-day EMA at $98.71 marks key support, and a break below this level would reinforce the bearish bias and expose SOL to a deeper pullback toward the May 17 low at $83.50.
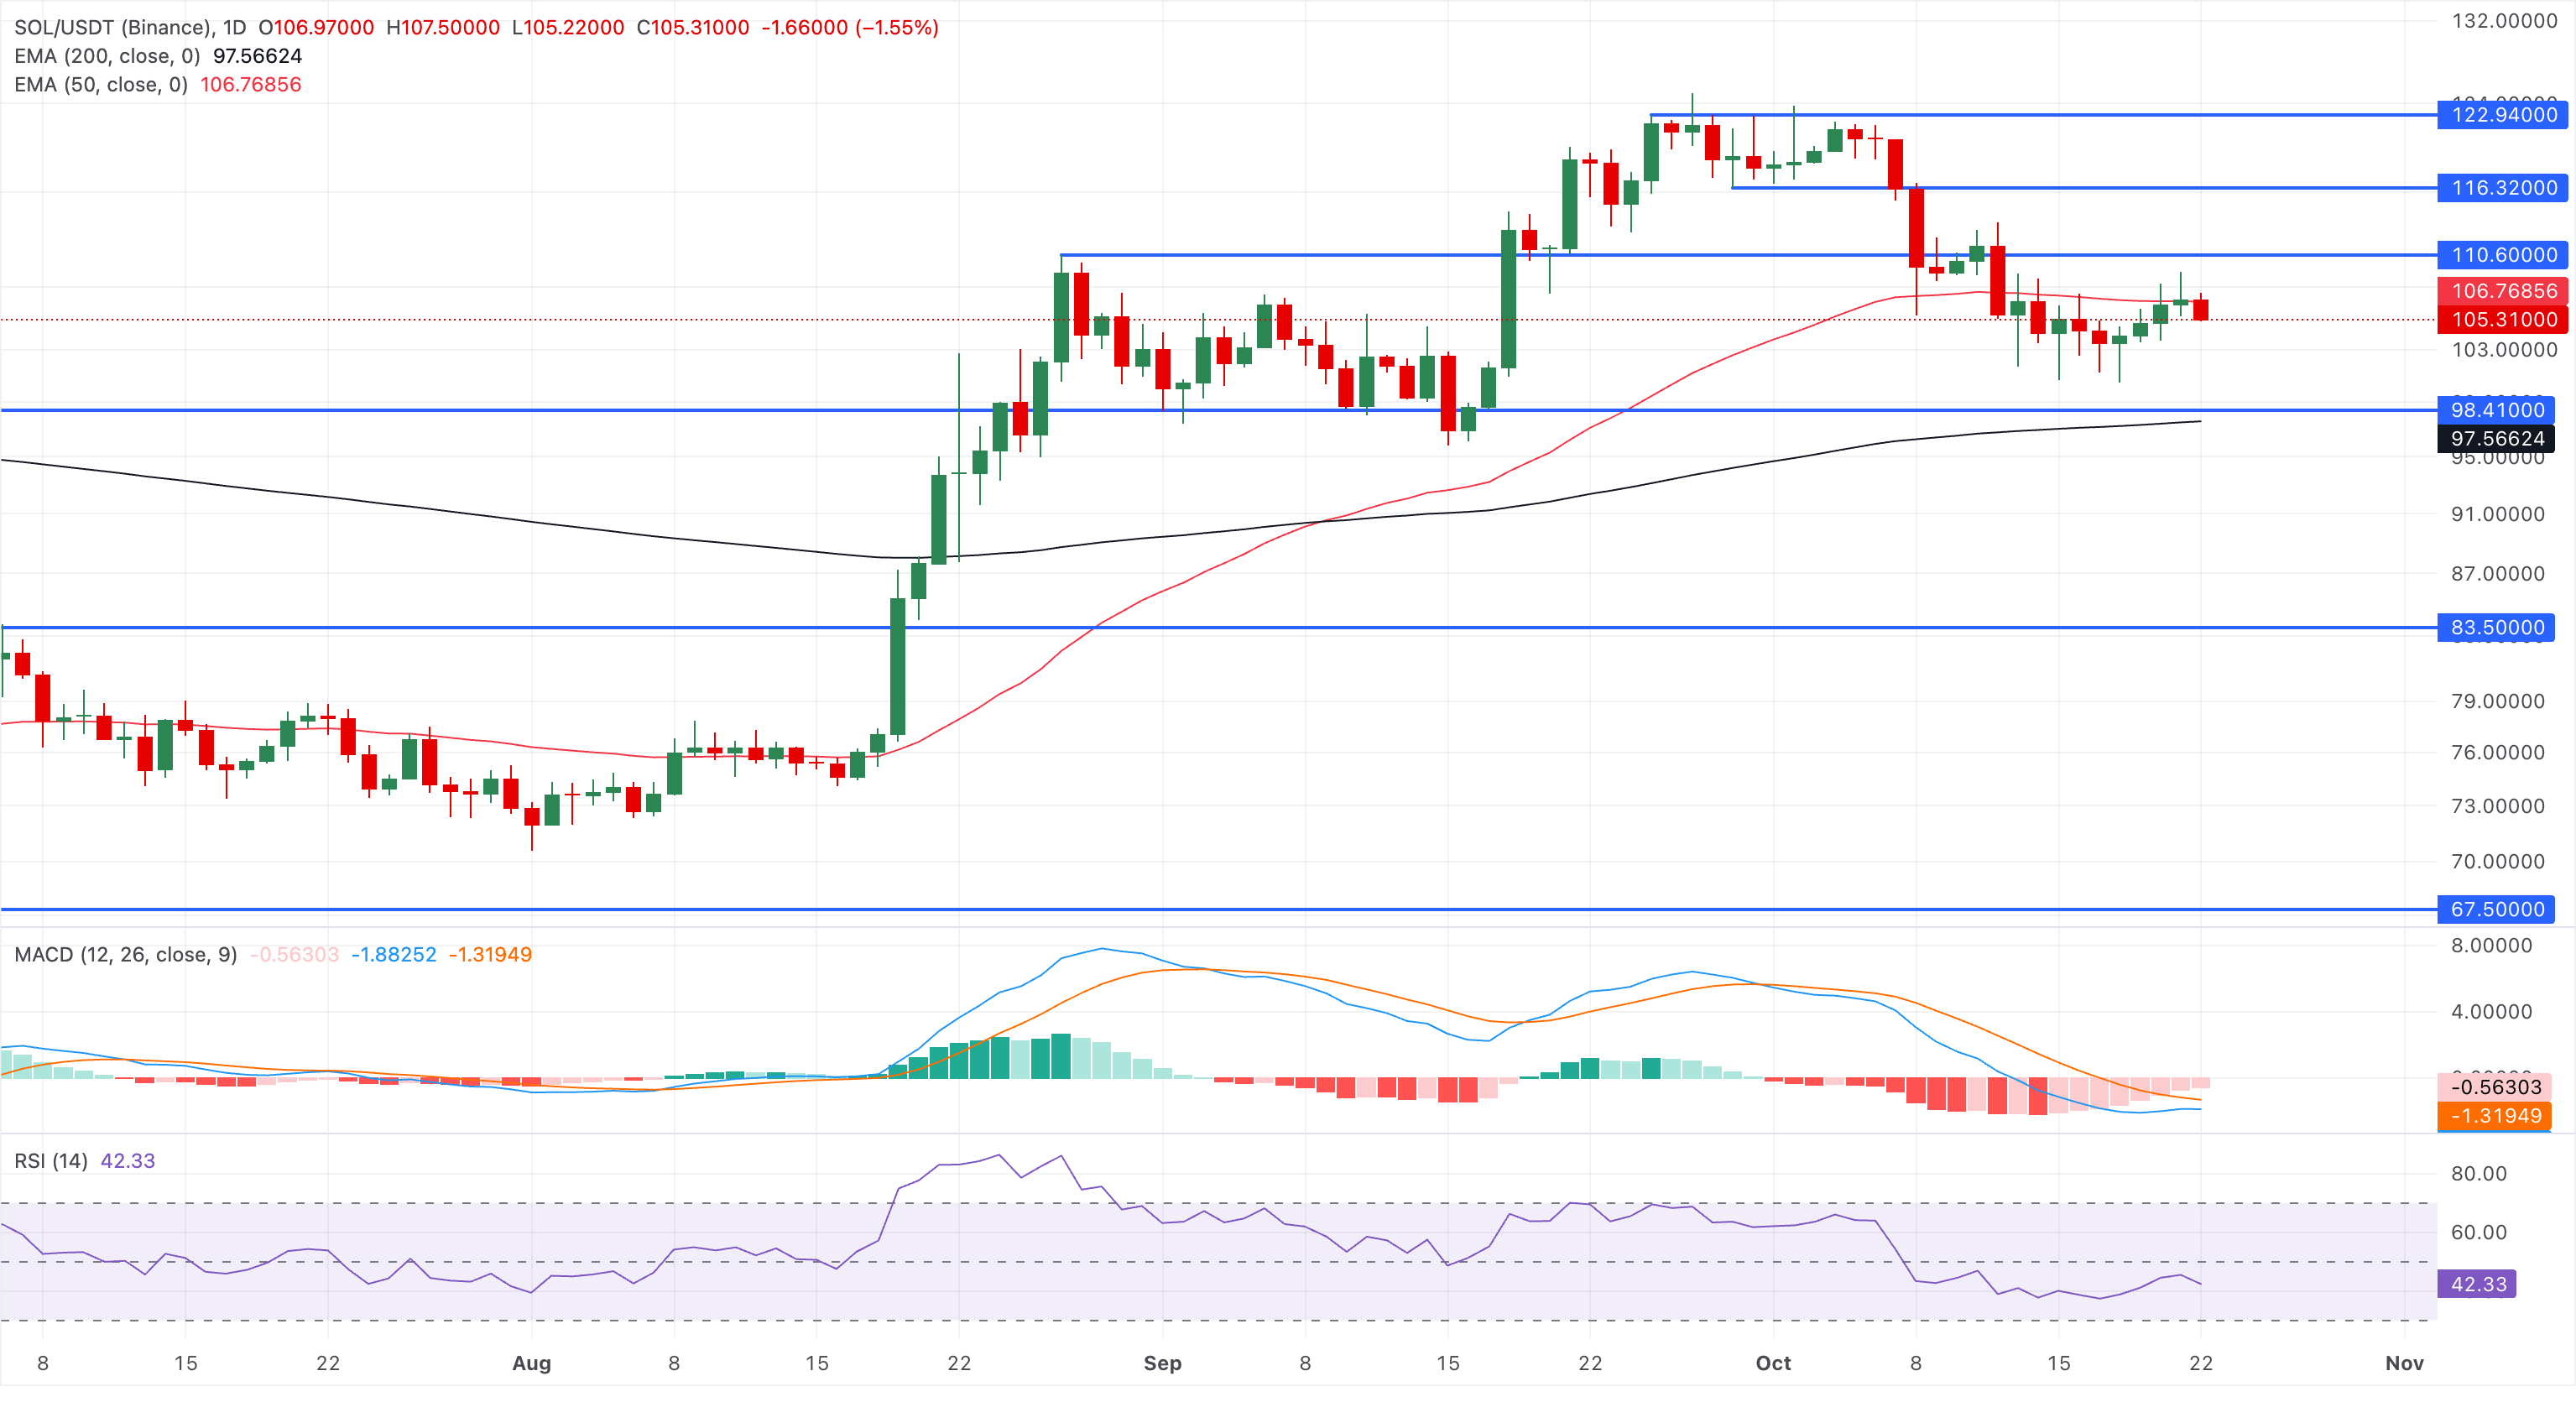
On the flip side, Initial resistance is seen at the 50-day EMA near $106.76, and a daily close above this barrier would ease immediate downside pressure. Still, SOL could face multiple overhead resistances, including the August 27 high of $110.60 and the September 25 high of $122.94.
(The technical analysis of this story was written with the help of an AI tool. Know more.)
추천 기사


