


Bitcoin vs Gold Forecast: BTC builds momentum toward $84K as XAU springs above $4,100
- Bitcoin advances toward $83,000 after bulls vehemently defended support near $80,000 amid a macro-driven correction.
- Gold marginally rises above $4,100, but its recovery potential appears limited by overhanging major moving averages.
- The probability of the Fed maintaining current interest rates next week is at 85% even as macroeconomic uncertainty persists.
Bitcoin (BTC) edges higher on Wednesday as buyers appear to increase risk exposure. The largest cryptocurrency by market capitalization recently tested and confirmed support near $80,000, as investors adjusted their portfolios amid higher inflation in the United States (US) and persistent geopolitical pressures.
Gold (XAU/USD), meanwhile, remains above $4,100, rising marginally on the day. The metal trades within a broader bearish trend, with recovery potential seeming capped by structural levels.
Fed rate pause bets remain elevated ahead of October decision
Market participants are heavily pricing in a steady Federal Reserve (Fed) outcome in next week’s Federal Reserve Open Market Committee (FOMC) meeting. The CME Group’s FedWatch Tool shows 85% odds of no change, keeping rates in the 3.75%-4.00% range on October 28. The probability of a 25-basis-point hike to the 4.00-4.25% range stands at roughly 15%.
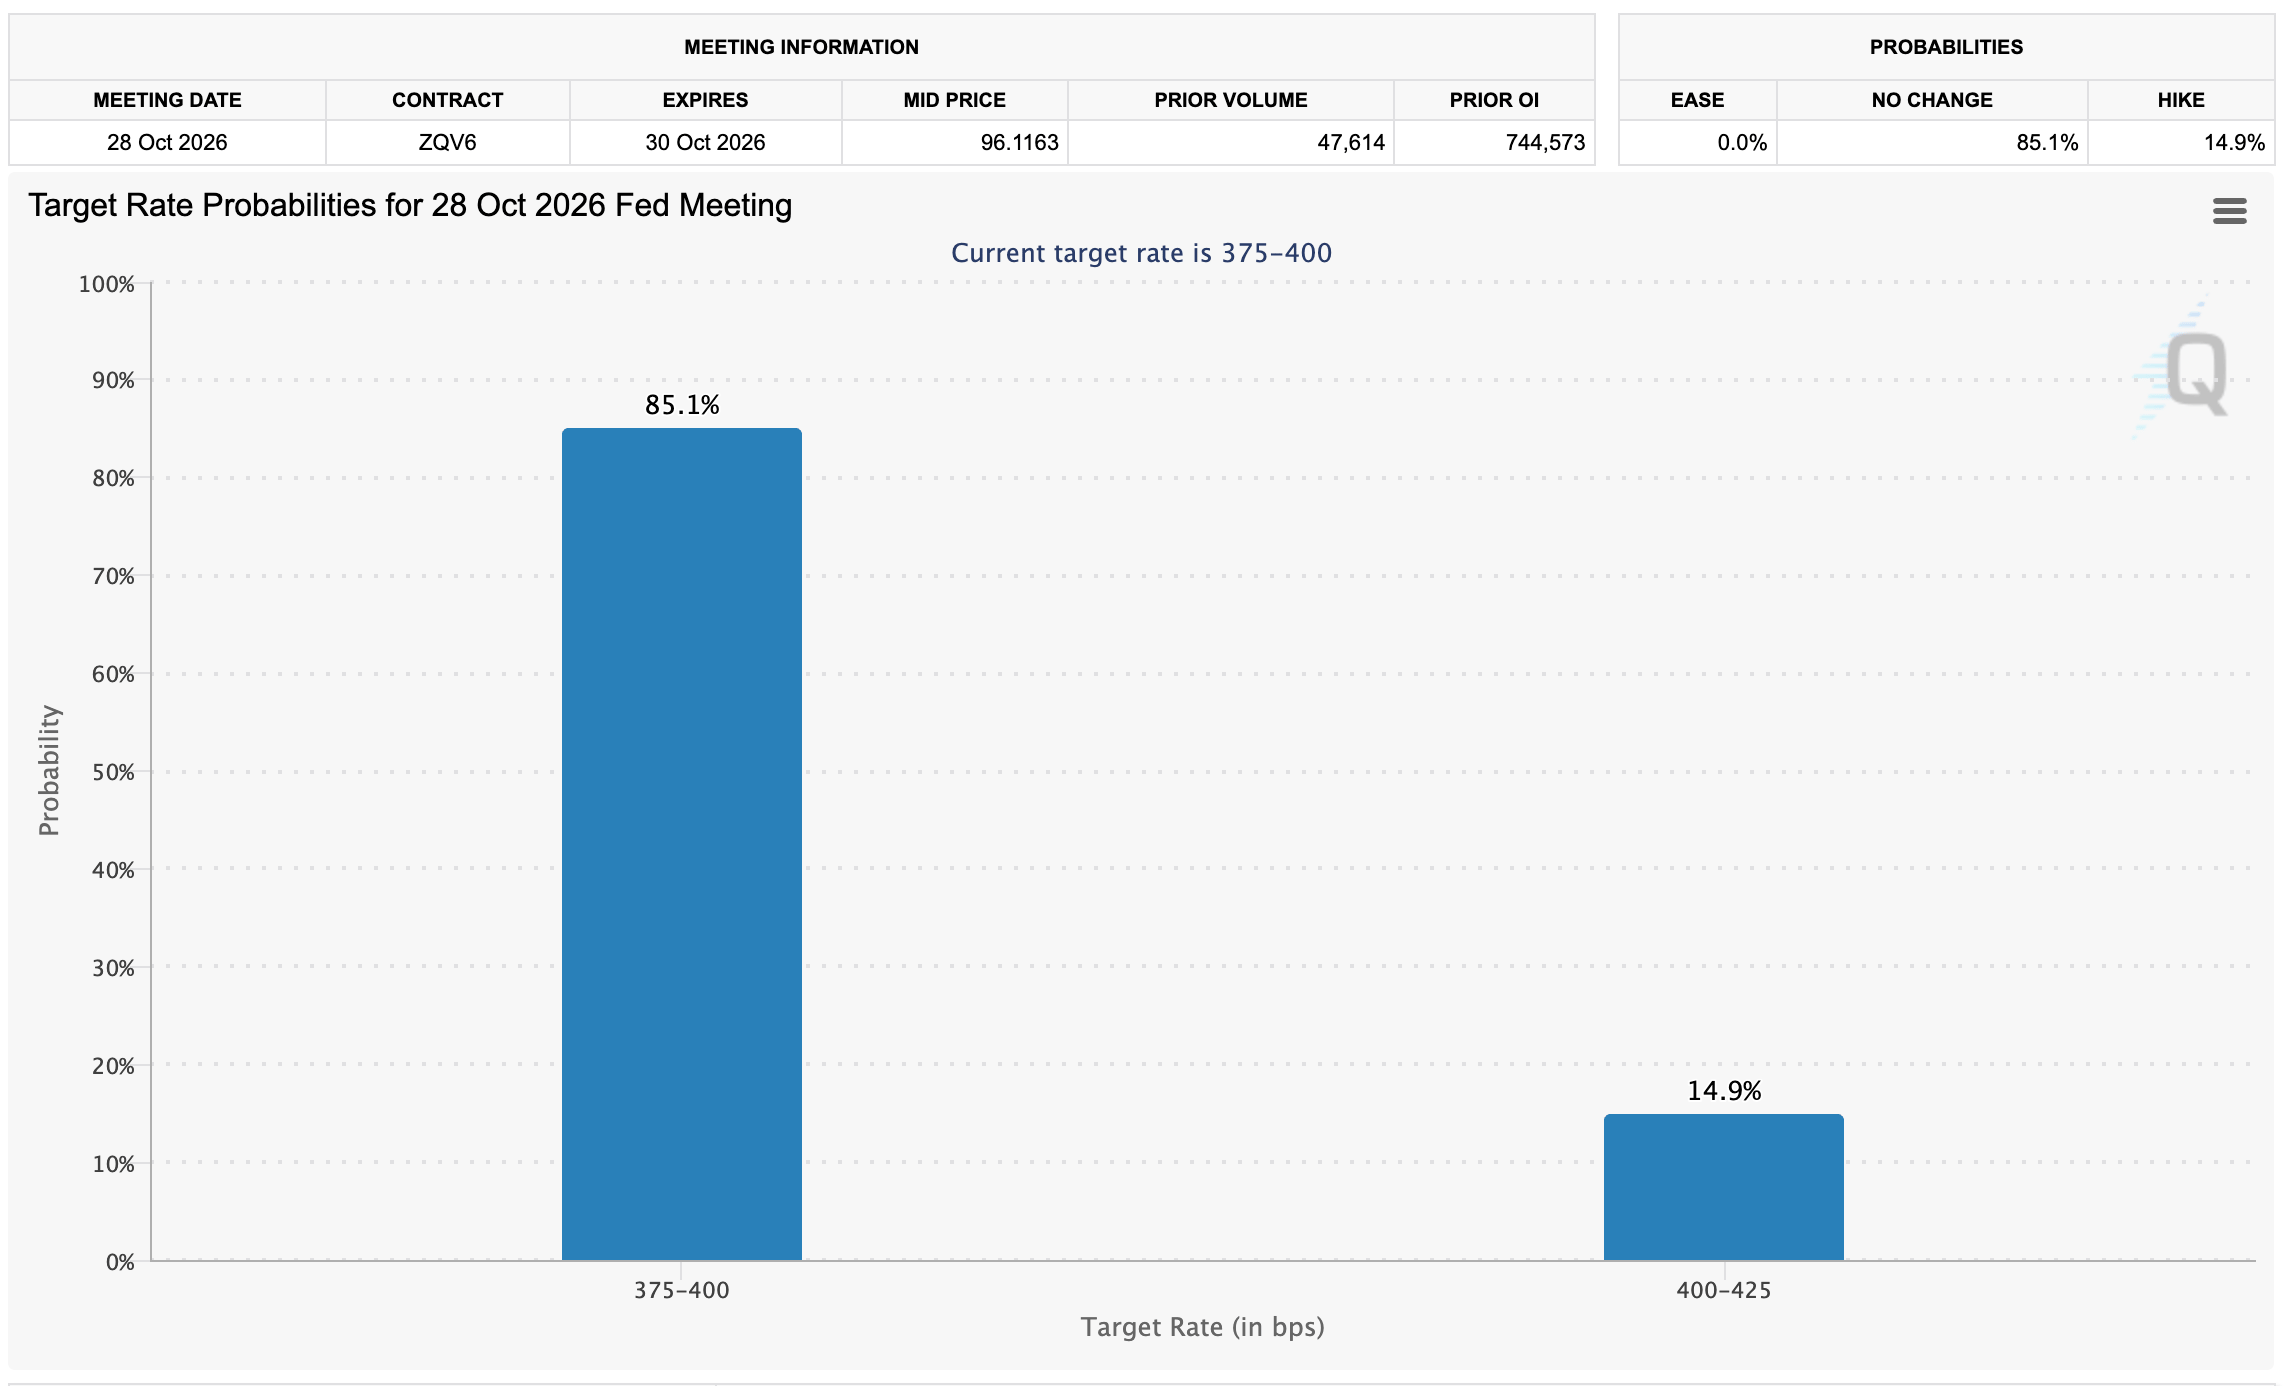
The elevated conviction for steady rates comes against the backdrop of sticky inflation in the US, as shown by last week’s Consumer Price Index (CPI) report. Interest rate traders are pricing in a higher probability of a December rate hike.
“Markets currently assign approximately an 85% probability to unchanged rates at the October 28 meeting, although expectations for another rate hike in December remain elevated,” Crypto Finance said in an emailed analysis report.
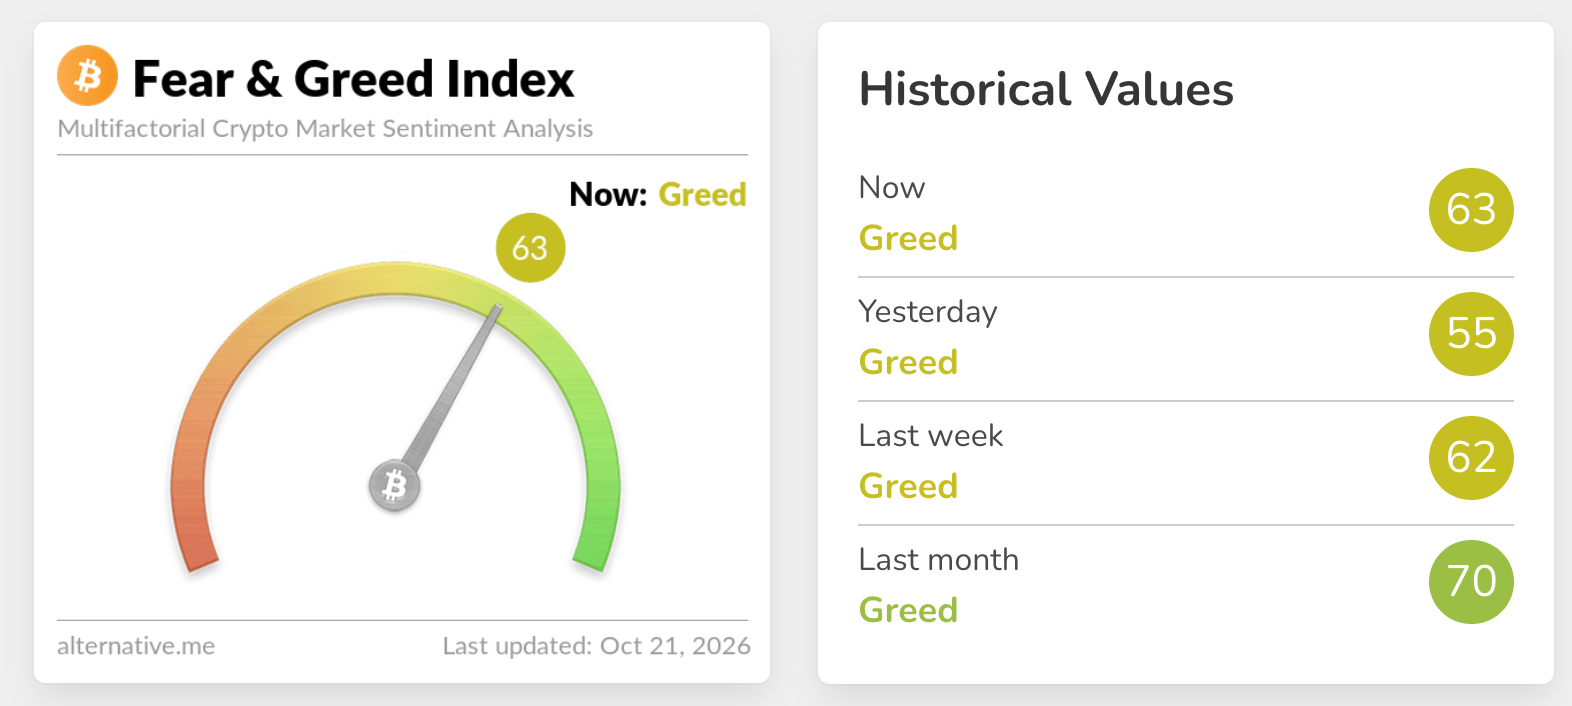
The prevailing macro setup continues to define risk appetite across the crypto market, as reflected in the Fear & Greed Index, which reads 63 in Greed territory on Wednesday, up from 55 the previous day. Despite the elevated market sentiment, a persistent restrictive Fed monetary policy continues to limit aggressive upside conviction.
Technical analysis: Bitcoin remains above critical support
Bitcoin trades at $83,564, holding a constructive bullish bias as price remains well above the short-, medium- and long-term Exponential Moving Averages (EMAs). The 50-day EMA at $80,795, together with the SuperTrend baseline around $79,664, reinforces an underlying demand zone beneath current levels, even as the Moving Average Convergence Divergence (MACD) stays negative, hinting at waning upside momentum.
The Relative Strength Index (RSI) near 55 is broadly neutral, suggesting a consolidation phase within an overall uptrend rather than a fully exhausted rally.
-1792592055731.png)
Immediate support lies at the 50-day EMA at $80,794, followed by the SuperTrend line at $79,664, where buyers could attempt to reassert control on any pullback. Deeper structural support emerges at the 100-day EMA at $77,352 and the 200-day EMA at $76,177, levels that should underpin the broader bullish structure as long as they remain intact.
Gold technical analysis: XAU holds support amid capped upside
Gold trades at $4,134 as bulls push for recovery above the $4,100 support. Despite that demand area, which prompts investors to consider reengaging, the metal remains under near-term pressure as price holds below the 50-day, 100-day, and 200-day EMAs, with the closest at $4,241 reinforcing a bearish bias despite a mildly positive MACD reading above zero. The RSI around 43 stays in neutral territory, hinting at subdued momentum rather than capitulation.
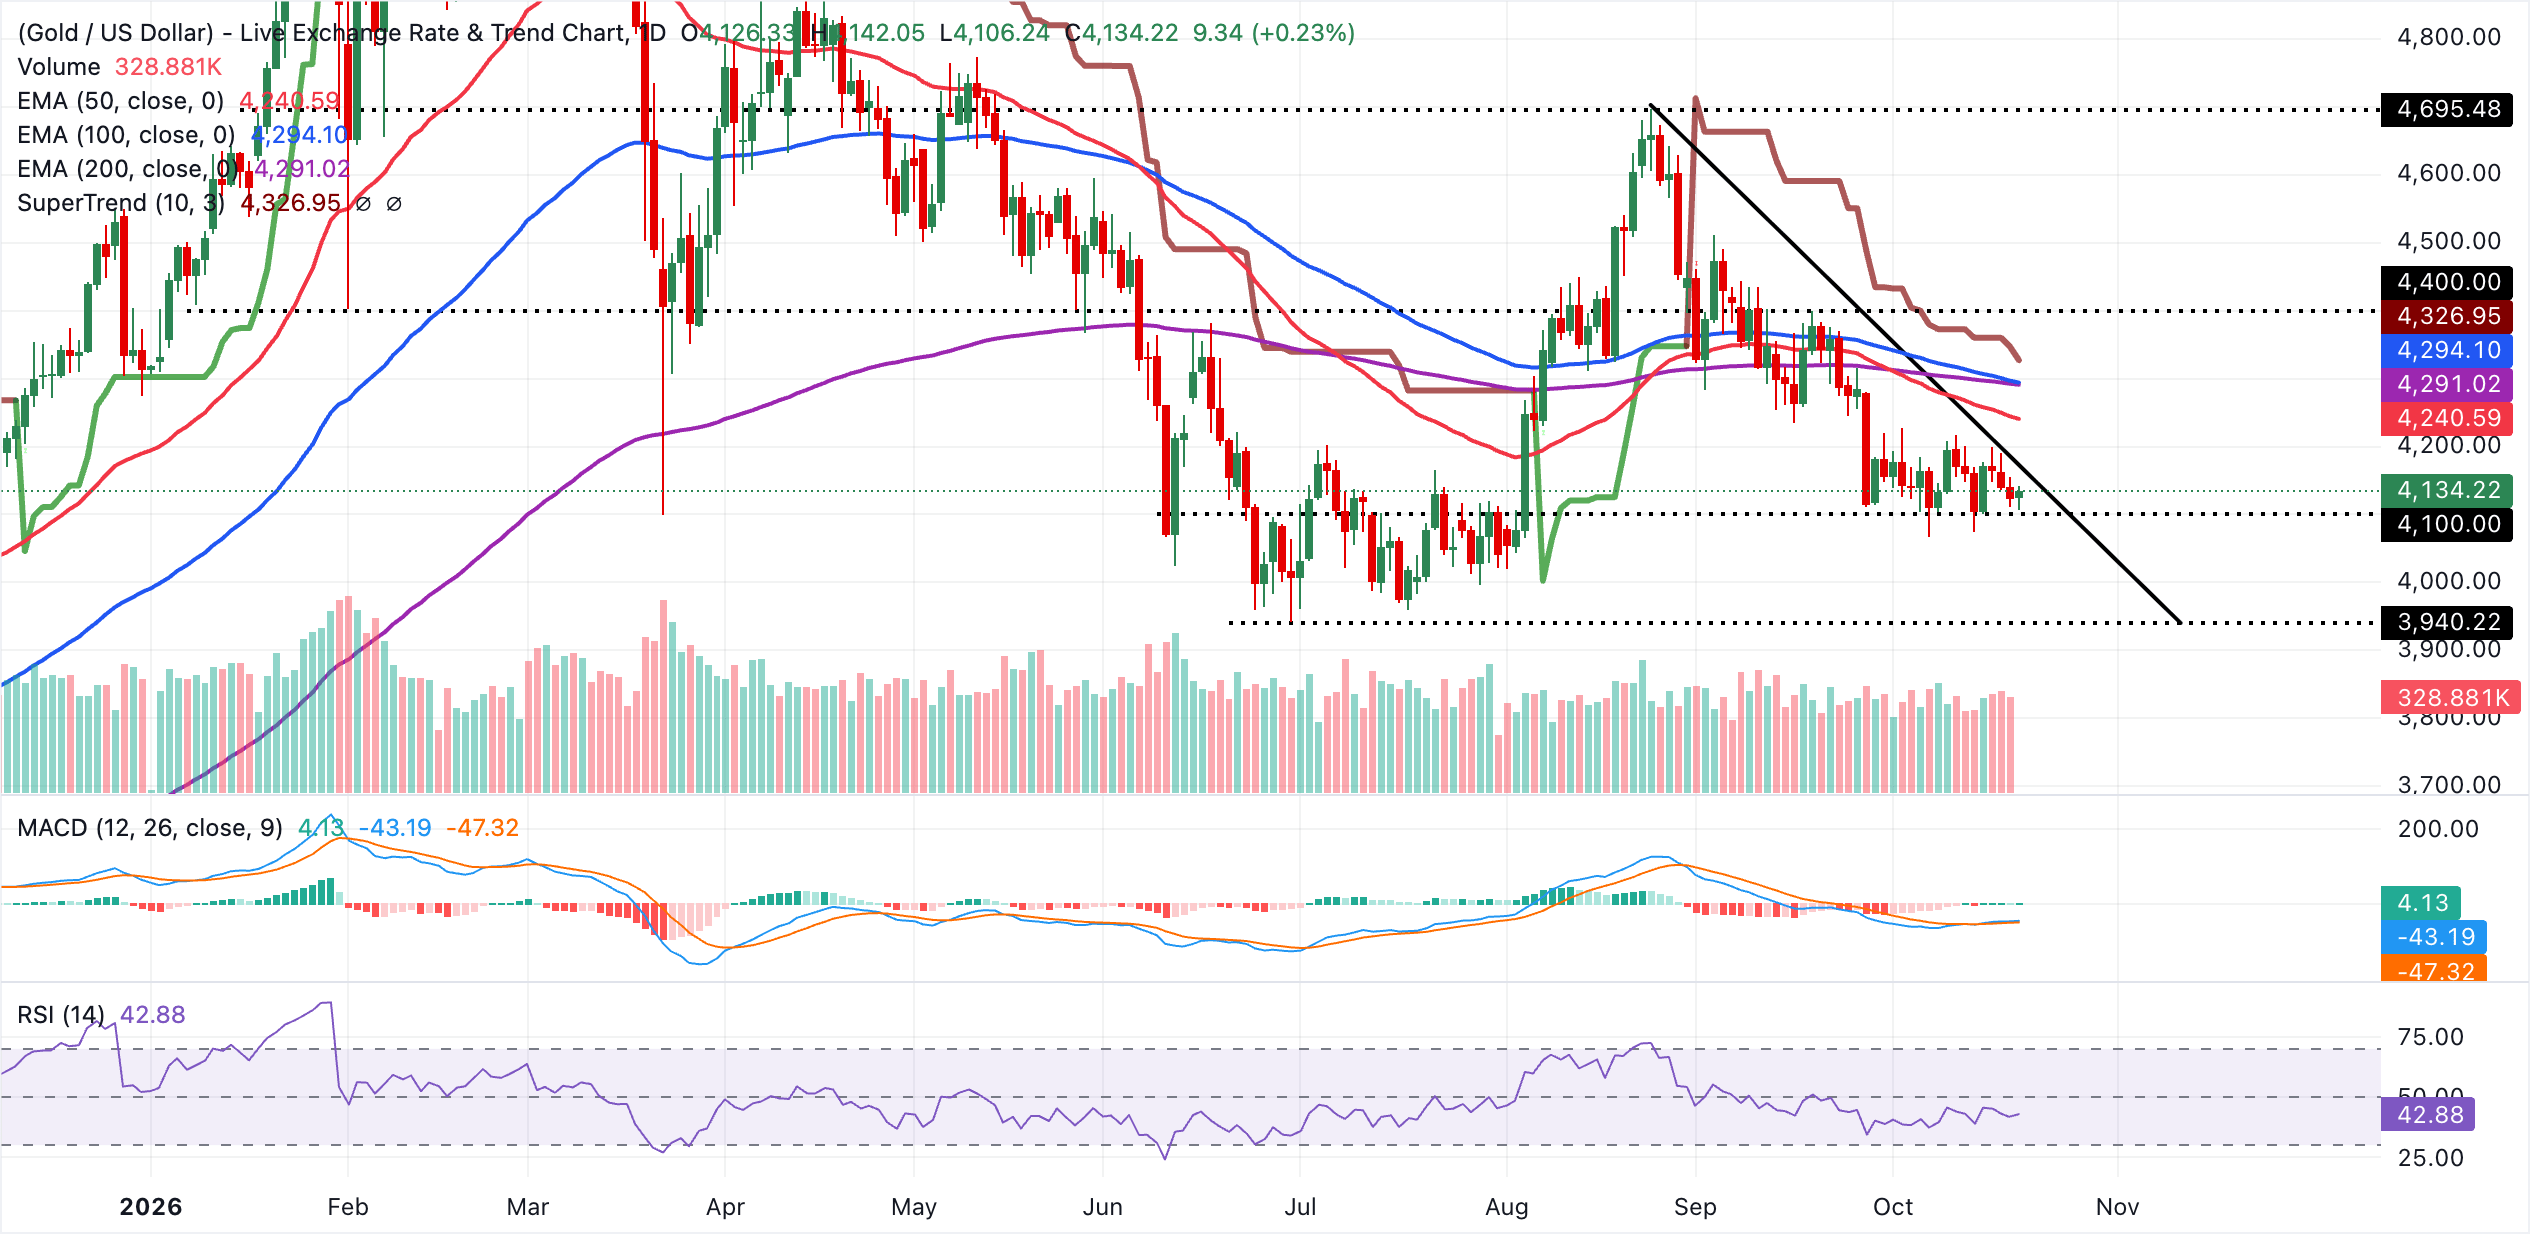
Initial resistance emerges at the 50-day EMA near $4,241, followed by the 200-day EMA at $4,291 and the 100-day EMA at $4,294, while the SuperTrend line at $4,327 defines a broader cap on recovery attempts. The lack of structural support levels on the daily chart forces traders to rely on psychological demand zones, including $4,100 and $4,000, respectively. A sustained break back below this support range would likely open the way for a deeper corrective leg.
(The technical analysis of this story was written with the help of an AI tool. Know more.)
Bitcoin, altcoins, stablecoins FAQs
Bitcoin is the largest cryptocurrency by market capitalization, a virtual currency designed to serve as money. This form of payment cannot be controlled by any one person, group, or entity, which eliminates the need for third-party participation during financial transactions.
Altcoins are any cryptocurrency apart from Bitcoin, but some also regard Ethereum as a non-altcoin because it is from these two cryptocurrencies that forking happens. If this is true, then Litecoin is the first altcoin, forked from the Bitcoin protocol and, therefore, an “improved” version of it.
Stablecoins are cryptocurrencies designed to have a stable price, with their value backed by a reserve of the asset it represents. To achieve this, the value of any one stablecoin is pegged to a commodity or financial instrument, such as the US Dollar (USD), with its supply regulated by an algorithm or demand. The main goal of stablecoins is to provide an on/off-ramp for investors willing to trade and invest in cryptocurrencies. Stablecoins also allow investors to store value since cryptocurrencies, in general, are subject to volatility.
Bitcoin dominance is the ratio of Bitcoin's market capitalization to the total market capitalization of all cryptocurrencies combined. It provides a clear picture of Bitcoin’s interest among investors. A high BTC dominance typically happens before and during a bull run, in which investors resort to investing in relatively stable and high market capitalization cryptocurrency like Bitcoin. A drop in BTC dominance usually means that investors are moving their capital and/or profits to altcoins in a quest for higher returns, which usually triggers an explosion of altcoin rallies.
추천 기사


