

Cardano Price Forecast: Weak momentum puts ADA recovery at risk

출처 Fxstreet
  • Cardano price trades below $0.222 on Thursday after failing to close above the 50-day EMA near $0.228 the previous day.
  • Weakening derivatives metrics continue to cap ADA recovery.
  • The technical outlook suggests fading momentum, with a close below the 100-day EMA support hinting at a deeper correction.

Cardano (ADA) is trading below $0.222 on Thursday after failing to sustain gains above the 50-day Exponential Moving Average (EMA) near $0.228 the previous day. Weakening derivatives metrics and fading bullish momentum continue to weigh on sentiment, while a break below the 100-day EMA could push ADA lower.

Weakening derivatives metrics cap Cardano

Derivatives data shows a cautious outlook for Cardano. CoinGlass’ long-to-short ratios for ADA read 0.79 on Thursday, nearing the lowest level over a month. A ratio below one indicates bearish sentiment, as traders bet that asset prices will fall.
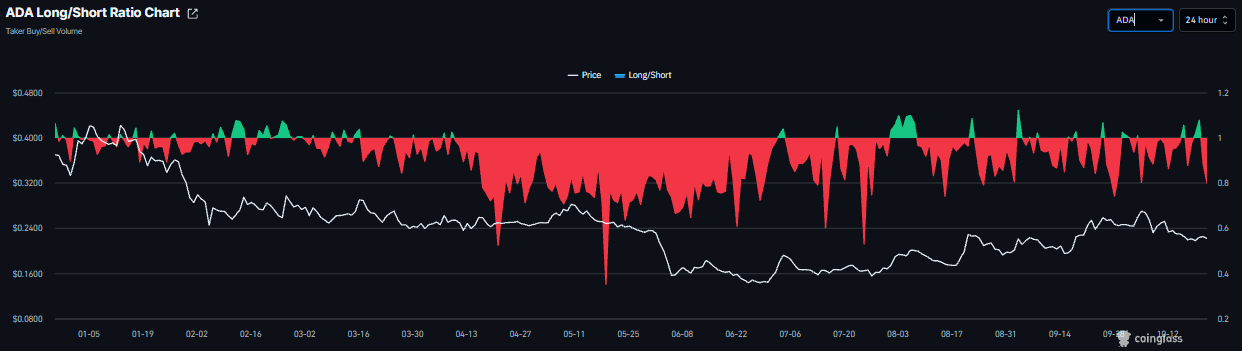
ADA long-to-short ratio chart. Source: Coinglass

In addition, Cardano’s funding rate flipped negative on Wednesday, reading -0.0025% on Thursday, indicating shorts are paying longs and suggesting a bearish outlook.
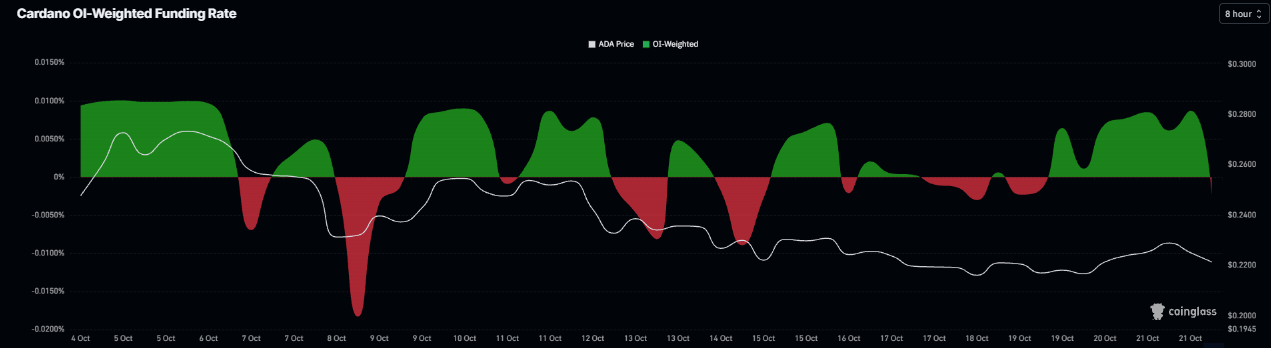
Cardano funding rates chart. Source: Coinglass

On-chain data shows bearish bias

CryptoQuant’s summary data shows a bearish outlook for Cardano. ADA’s futures markets show large whale orders alongside heating conditions. In addition, the spot and futures markets show sell-side dominance. These highlight a bearish, cautious sentiment bias among Cardano traders.
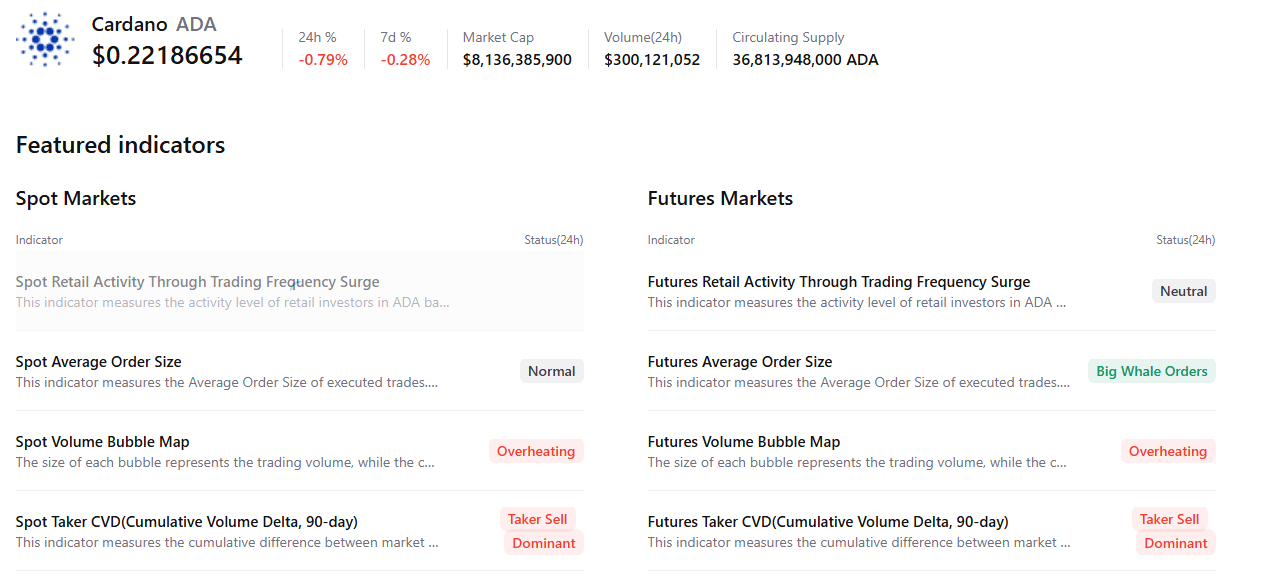
Cardano summary chart. Source: CryptoQuant

Cardano technical outlook: Weakening momentum indicators

Cardano price trades at $0.221 on Thursday, holding below its 50-day and 200-day Exponential Moving Averages (EMAs), which keeps the near-term bias tilted to the downside. ADA is hovering just above the 100-day EMA around $0.220, while the break of the rising support trend line near $0.210 hints that the broader corrective phase remains in play.

Momentum indicators back this cautious tone, with the Relative Strength Index (RSI) lingering in the low-40s and the Moving Average Convergence Divergence (MACD) still negative, suggesting downside pressure is fading but not yet reversed.

On the topside, initial resistance appears at the 50-day EMA near $0.230, followed by a horizontal barrier around $0.236 and the 200-day EMA near $0.240, with a stronger cap toward $0.250 and then $0.300.

On the downside, immediate support is reinforced by the 100-day EMA around $0.220, ahead of the former uptrend line-break region near $0.210; a sustained drop through that area would expose deeper trendline-memory support closer to $0.170.
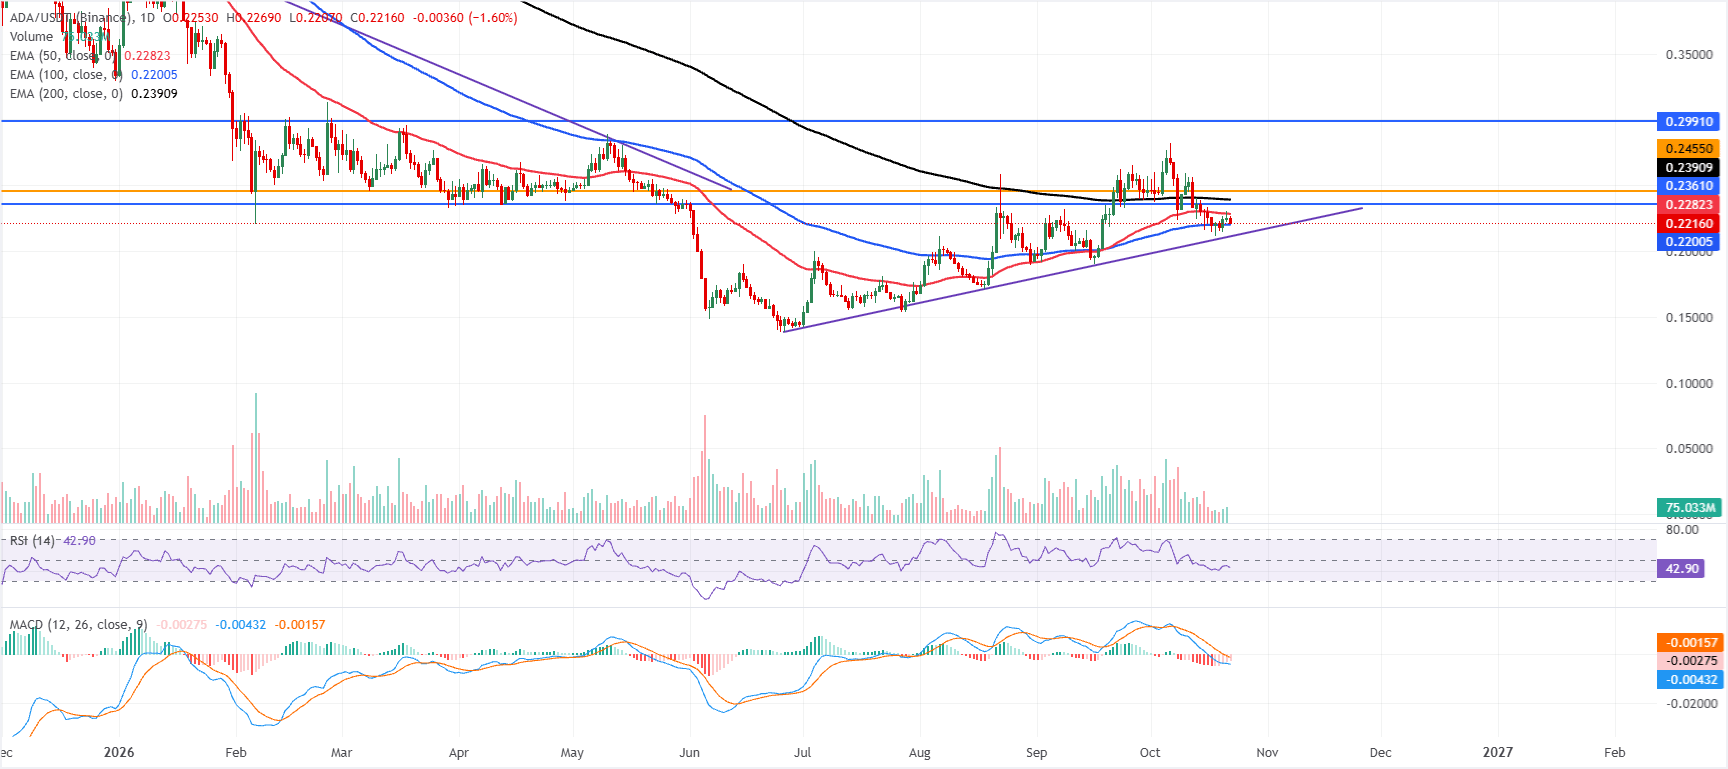
ADA/USDT daily chart

(The technical analysis of this story was written with the help of an AI tool. Know more.)

면책 조항: 정보 제공 목적으로만 사용됩니다. 과거 성과가 미래 결과를 보장하지 않습니다.
placeholder
메이플 파이낸스(MPL) 가격 전망: 업비트 상장 및 2분기 실적 발표에 힘입어 SYRUP 급등, 상승 모멘텀 본격화메이플 파이낸스(Maple Finance)의 토큰 SYRUP은 금요일 기준 30% 이상 급등하며, 시장 전반의 하락세에도 불구하고 강세 흐름을 이어가고 있다. 이는 한국 최대 암호화폐 거래소 업비트(Upbit) 상장 소식과 2분기 실적 발표가 촉매 역할을 한 것으로 풀이된다.
저자  FXStreet
2025 년 7 월 25 일
메이플 파이낸스(Maple Finance)의 토큰 SYRUP은 금요일 기준 30% 이상 급등하며, 시장 전반의 하락세에도 불구하고 강세 흐름을 이어가고 있다. 이는 한국 최대 암호화폐 거래소 업비트(Upbit) 상장 소식과 2분기 실적 발표가 촉매 역할을 한 것으로 풀이된다.
placeholder
TradingKey 월가 주간 리포트: 인플레이션 상승으로 금리 압박 심화; 나스닥 4.48% 하락, 6월 이후 최대 주간 낙폭지난주 시장 리뷰 및 분석TradingKey - 2026년 10월 12일부터 2026년 10월 18일까지의 기간 동안 미국 거시경제 환경은 지속적인 인플레이션 압력과 높은 글로벌 에너지 비용의 지배를 받았습니다. 10월 14일에 발표된 9월 헤드라인 소비자물가지수(CPI) 데이터는 휘발유 가격의 9.1% 급등에 힘입어 연간 인플레이션 상승률이 3.7%로 가
저자  Mitrade팀
10 월 19 일 월요일
지난주 시장 리뷰 및 분석TradingKey - 2026년 10월 12일부터 2026년 10월 18일까지의 기간 동안 미국 거시경제 환경은 지속적인 인플레이션 압력과 높은 글로벌 에너지 비용의 지배를 받았습니다. 10월 14일에 발표된 9월 헤드라인 소비자물가지수(CPI) 데이터는 휘발유 가격의 9.1% 급등에 힘입어 연간 인플레이션 상승률이 3.7%로 가
placeholder
일본·한국 증시 하락 출발; 코스피 2% 이상 하락, SK하이닉스 4% 이상 하락, 소프트뱅크 3% 이상 하락TradingKey - 10월 20일 오전 거래에서 일본과 한국 증시가 모두 하락세를 보인 가운데, 한국 증시의 낙폭이 확대되었다. 한국 코스피(KOSPI) 지수는 0.60% 하락한 5,733.57포인트로 출발한 뒤 낙폭을 2.20%로 넓히며 5,641.21포인트를 기록했고, 일본 닛케이 225 지수(N225)는 0.25% 내린 64,755.49포인트로 개
저자  Mitrade팀
10 월 20 일 화요일
TradingKey - 10월 20일 오전 거래에서 일본과 한국 증시가 모두 하락세를 보인 가운데, 한국 증시의 낙폭이 확대되었다. 한국 코스피(KOSPI) 지수는 0.60% 하락한 5,733.57포인트로 출발한 뒤 낙폭을 2.20%로 넓히며 5,641.21포인트를 기록했고, 일본 닛케이 225 지수(N225)는 0.25% 내린 64,755.49포인트로 개
placeholder
브렌트 선물(UKOIL-F) 종목이 10월20일에 2.05% 상승한 이유를 확인해 보세요브렌트 선물 (UKOIL-F) 종목은 10월20일 05:05(UTC+0)에 2.05% 상승하여, 현재 가격은 $111.41이고, 최근 7일간 4.82% 상승했습니다.오늘 브렌트 선물(UKOIL-F) 주가 상승의 요인은 무엇인가요?중동 지역의 지정학적 긴장 고조와 주요 해상 수송로를 둘러싼 안보 위험 증대로 공급 차질 우려가 재점화되면서 브렌트유 선물이 상승했다.
저자  FXStreet
10 월 20 일 화요일
브렌트 선물 (UKOIL-F) 종목은 10월20일 05:05(UTC+0)에 2.05% 상승하여, 현재 가격은 $111.41이고, 최근 7일간 4.82% 상승했습니다.오늘 브렌트 선물(UKOIL-F) 주가 상승의 요인은 무엇인가요?중동 지역의 지정학적 긴장 고조와 주요 해상 수송로를 둘러싼 안보 위험 증대로 공급 차질 우려가 재점화되면서 브렌트유 선물이 상승했다.
placeholder
장 초반 일본 및 한국 증시 상승, 코스피 2% 이상 상승, SK하이닉스 4% 가까이 상승, 키옥시아 5% 이상 급등TradingKey - 10월 21일 장 초반 한국과 일본 증시가 일제히 상승 출발하며 반등세를 보였다. 코스피(KOSPI) 지수는 2.05% 오른 5,666.34포인트로 개장한 뒤 상승 폭을 2.10%로 확대하며 5,669.58포인트를 기록했으며, 일본 닛케이 225 지수는 1.26% 상승한 64,885.95포인트로 출발해 상승 폭을 1.41%로 넓히며
저자  Mitrade팀
어제 01: 17
TradingKey - 10월 21일 장 초반 한국과 일본 증시가 일제히 상승 출발하며 반등세를 보였다. 코스피(KOSPI) 지수는 2.05% 오른 5,666.34포인트로 개장한 뒤 상승 폭을 2.10%로 확대하며 5,669.58포인트를 기록했으며, 일본 닛케이 225 지수는 1.26% 상승한 64,885.95포인트로 출발해 상승 폭을 1.41%로 넓히며
goTop
quote