

Bitcoin Weekly Forecast: The Fed kills the vibe
- Bitcoin price slips nearly 3% so far this week, snapping two consecutive weeks of mild recovery.
- The Fed’s hawkish tone dampens hopes of rate cuts this year, hurting overall risk appetite.
- Institutional demand remains indecisive, with US-listed ETFs alternating inflows and outflows.
Bitcoin (BTC) clings to $70,000 at the time of writing on Friday, slipping nearly 3% so far this week and snapping two consecutive weeks of recovery. Market sentiment has weakened following the Federal Reserve’s (Fed) hawkish tone in its March monetary policy decision, weighing on the Crypto King’s price. Meanwhile, mixed spot Exchange Traded Fund (ETF) flows signal growing indecision among institutional investors, suggesting BTC may remain in a range-bound scenario.
Hawkish Fed hold weighs on risk sentiment
Bitcoin began the week on a positive note, extending its gains to a high of $76,000 on Tuesday (levels not seen since early February), then came down, with a net loss of nearly 3% as of Friday.
The price correction was fueled by the Fed’s hawkish tone on Wednesday, as the US central bank kept the interest rates unchanged at 3.50%–3.75% at its March meeting.
In fact, the US central bank raised the year-end Personal Expenditures Price (PCE) inflation outlook to 2.7% from 2.4% in December, citing risks from higher energy prices due to the Iran war. The Fed also upgraded its 2026 growth projection and projected only one rate reduction this year, and one in 2027.
This hawkish tone damped risk appetite and weighed on risky assets such as Bitcoin, which declined slightly this week.
Aurelie Barthere, Principal Research Analyst at Nansen, told FXStreet that, “The Fed did not change its interest rate projection but revised up its inflation and growth projections for 2026. The press conference time was allocated to questions around inflation rather than the labor market, and the tone was rather hawkish.”
Barthere continued, “The new Fed Chair will inherit a Committee that is reluctant to cut unless the unemployment rate moves up significantly. BTC started to sell off on Tuesday around noon CET, following the escalation of the war between Iran and Israel and the attack on gas infrastructure in Qatar. The FOMC’s press conference led to further sell-off. Importantly, BTC is holding its 70K support so far.”
Institutional demand shows mixed sentiment
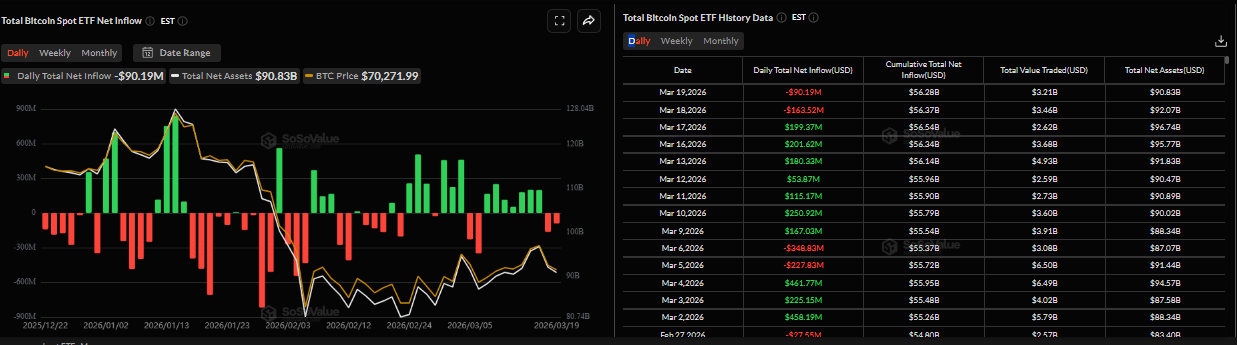
Institutional flows reflect a mixed sentiment so far this week, as SoSoValue data show that Bitcoin spot ETFs have seen alternating inflows and outflows. The week began with positive flows of $201.62 million on Monday and $199.37 million on Tuesday, followed by an outflow of $163.52 million on Wednesday and another of $90.19 million on Thursday. This highlights the indecisiveness among institutional investors, as fluctuating ETF flows suggest a cautious approach amid prevailing market uncertainty.
However, on the corporate side, Michael Saylor announced on X on Monday that Strategy had purchased another 22,337 BTC following its purchase of 17,994 BTC the previous week. Monday’s purchase brings the firm’s total holdings to 761,068 BTC, highlighting its continued aggressive accumulation strategy. Strategy’s average purchase price for all its holdings is $75,696, above current market prices.
BTC has still outperformed other assets since beginning of war
Despite the slight decline in BTC price so far this week, the Crypto King has still outperformed other assets since the beginning of the war in Middle East. The same started on February 28, when BTC was trading near $65,800, and has gained over 6% to date, standing out against negative returns in both equities and Gold.
A K33 Research report on Tuesday stated that “Bitcoin’s performance remains the key divergence. Historically, risk-off environments tend to hit BTC hardest, yet that has not been the case here. Context is important. Unlike Gold, BTC had already underperformed for months, experiencing a 50% drawdown prior to the war.”
The analyst at K33 Research concluded, “We have argued that BTC was underowned, overshorted, and oversold, indicating it was already heavily de-risked. With positioning washed out, existing holders were less inclined to sell into weakness, and the post-war price action may be reinforcing a narrative of Bitcoin as a scarce alternative asset with improving relative momentum.”
Morgan Stanley moves closer to BTC ETF
Morgan Stanley has filed a second amended S-1 for its spot Bitcoin ETF with the US Securities and Exchange Commission (SEC) on Tuesday, confirming the Morgan Stanley Bitcoin Trust will list on the New York Stock Exchange (NYSE) Arca under the ticker MSBT.
The filing outlines a basket size of 10,000 shares and an initial seed basket of 50,000 shares, with an expected raise of about $1 million.
The filing marks another step forward for Morgan Stanley’s Bitcoin ETF application, first submitted in January, though it does not guarantee SEC approval.
If approved, Morgan Stanley would become the first major US bank to issue a spot Bitcoin ETF directly.
Technical outlook: BTC holds above key support
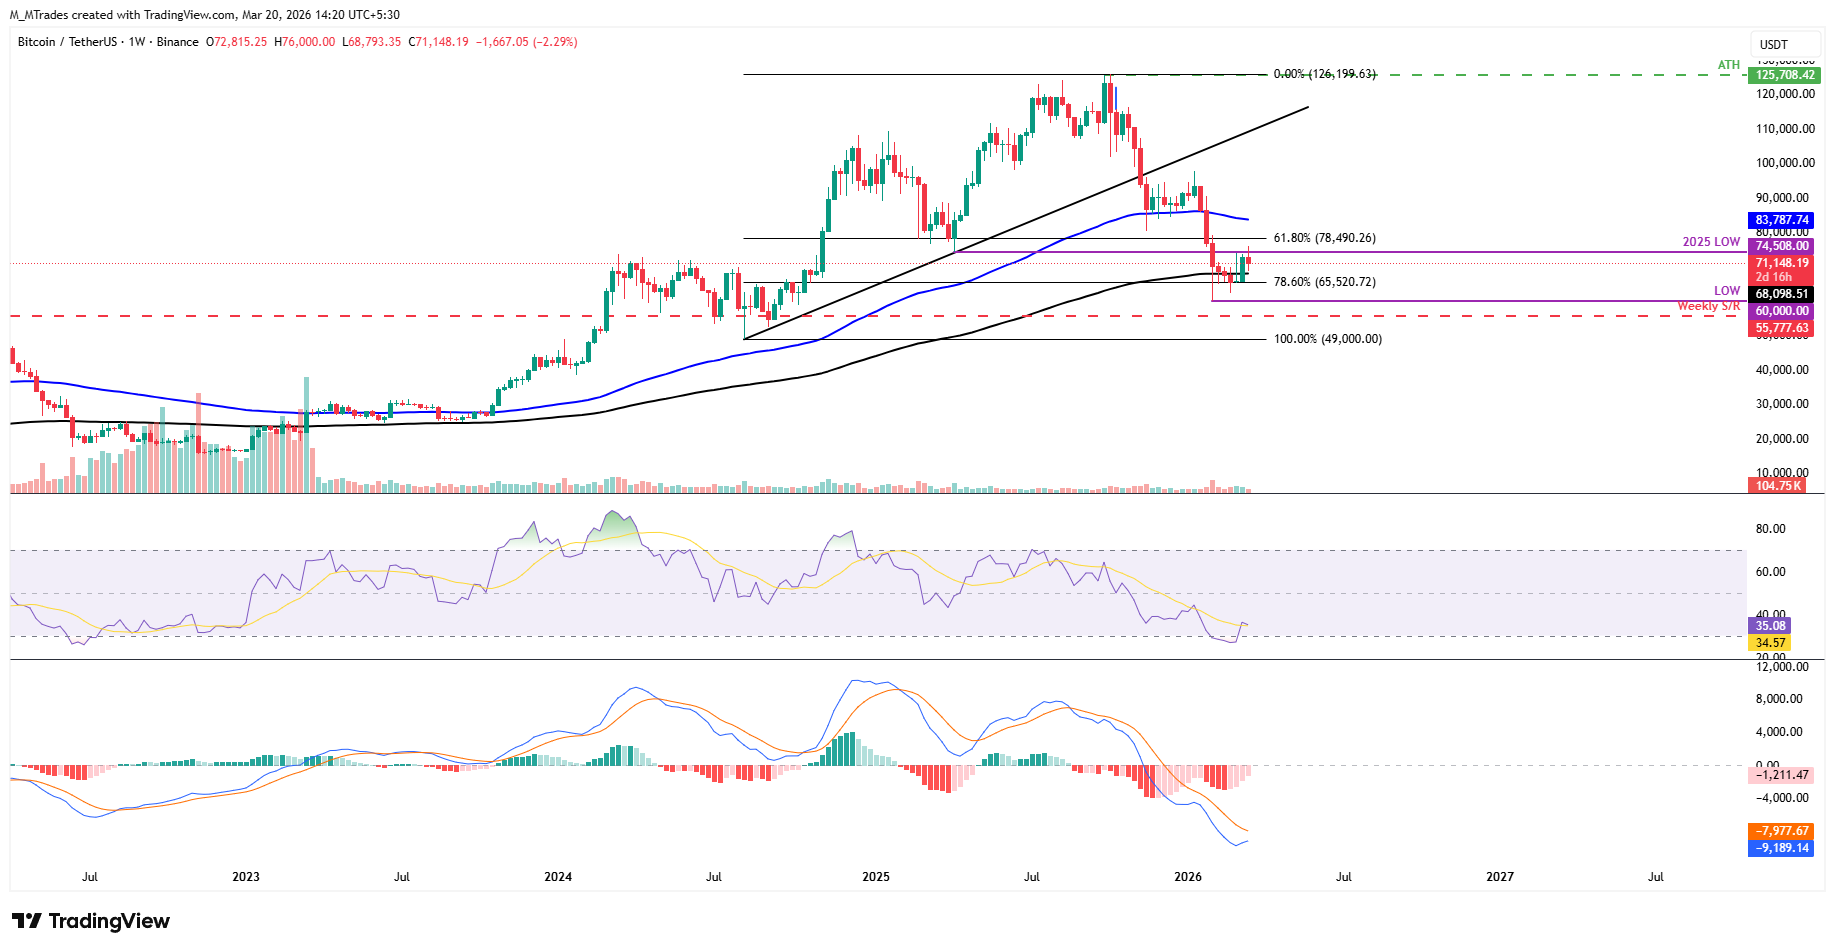
On the weekly chart, the largest cryptocurrency faced rejection around the 2025 yearly low at $74,508 and has declined slightly so far this week. However, BTC has still remained above its 200-week Exponential Moving Average (EMA) at $68,098 as of Friday.
If the 200-week EMA at $60,098 holds as support, Bitcoin could extend the recovery toward the next psychological resistance at $75,000, nearly the 2025 yearly low. A close above this level could extend further gains toward the 61.80 % Fibonacci retracement level at $78,490 (drawn from the August 2024 low of $49,000 to the October 2025 all-time high of $126,199).
The Relative Strength Index (RSI) reads 35 on the weekly chart, rebounding from oversold territory, indicating a fading bearish tone. However, the Moving Average Convergence Divergence (MACD) indicator on the same chart also showed a bearish crossover in mid-August, which remains intact, supporting the negative outlook.
On the daily chart, the near-term bias is neutral, with a slight downside tilt, as price holds within a parallel channel, trading slightly above the channel midpoint at $69,200. Daily closes remain well below the 50-day and 100-day Exponential Moving Averages (EMAs), which are clustered between roughly $72,600 and $78,800, respectively, keeping the broader trend upward, but the short-term structure reflects a corrective phase within that uptrend.
The RSI on the daily chart around 51 shows balanced momentum after recovering from prior weakness, while the MACD indicator has cooled from its earlier peak yet remains in positive territory, suggesting fading but still positive underlying momentum inside the channel.
Initial resistance aligns with the channel top around $72,600, and the 50-day EMA is nearly converging there, forming a stronger barrier. A daily close above this confluence would open the way toward the 100-day EMA near $78,800.
On the downside, immediate support stands at the channel mid-area around $69,200, with stronger support at the channel floor near $65,900, which also coincides with the recent swing low. A decisive break below $65,900 would expose a deeper correction, while holding above it would keep BTC in a range-bound pullback phase against the broader uptrend.
-1773999240192-1773999240194.png)
(The technical analysis of this story was written with the help of an AI tool.)
Bitcoin, altcoins, stablecoins FAQs
Bitcoin is the largest cryptocurrency by market capitalization, a virtual currency designed to serve as money. This form of payment cannot be controlled by any one person, group, or entity, which eliminates the need for third-party participation during financial transactions.
Altcoins are any cryptocurrency apart from Bitcoin, but some also regard Ethereum as a non-altcoin because it is from these two cryptocurrencies that forking happens. If this is true, then Litecoin is the first altcoin, forked from the Bitcoin protocol and, therefore, an “improved” version of it.
Stablecoins are cryptocurrencies designed to have a stable price, with their value backed by a reserve of the asset it represents. To achieve this, the value of any one stablecoin is pegged to a commodity or financial instrument, such as the US Dollar (USD), with its supply regulated by an algorithm or demand. The main goal of stablecoins is to provide an on/off-ramp for investors willing to trade and invest in cryptocurrencies. Stablecoins also allow investors to store value since cryptocurrencies, in general, are subject to volatility.
Bitcoin dominance is the ratio of Bitcoin's market capitalization to the total market capitalization of all cryptocurrencies combined. It provides a clear picture of Bitcoin’s interest among investors. A high BTC dominance typically happens before and during a bull run, in which investors resort to investing in relatively stable and high market capitalization cryptocurrency like Bitcoin. A drop in BTC dominance usually means that investors are moving their capital and/or profits to altcoins in a quest for higher returns, which usually triggers an explosion of altcoin rallies.
추천 기사


