

Bitcoin Price Forecast: Safe-haven narrative gains traction as BTC holds up gains despite rising uncertainty
- Bitcoin price eases slightly on Tuesday after breaking above the consolidation range it had been trading in since early February.
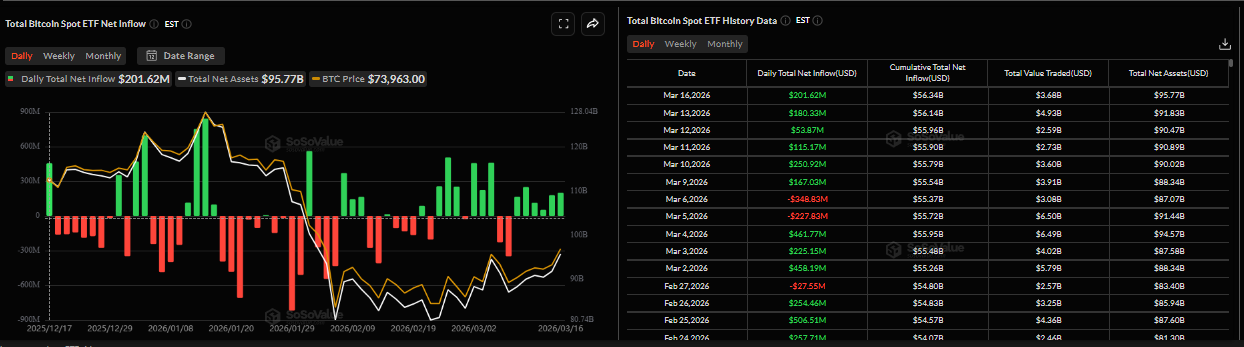
- US-listed spot ETFs recorded an inflow of over $200 million, while Strategy added 22,337 BTC to its reserve on Monday.
- BTC price action since the beginning of the Iran war suggests the “digital safe haven” or “geopolitical hedge” narrative is reviving.
Bitcoin (BTC) is falling slightly, trading near $74,300 on Tuesday and revisiting the upper boundary of a previously broken sideways channel. Institutional and corporate demand remains strong amid the ongoing Iran war, with spot Exchange Traded Funds (ETFs) recording inflows while Strategy (MSTR) added 22,337 BTC to its reserve on Monday. The Crypto King’s price action is reviving its “digital safe haven” narrative amid rising uncertainty.
Institutional and corporate demand remains strong
Institutional demand for Bitcoin started the week on a positive note. According to SoSoValue data, spot Bitcoin ETFs recorded inflows of $201.62 million on Monday, following a third consecutive week of inflows. If these inflows continue and intensify, BTC could see a rally in the upcoming weeks.
On the corporate front, Michael Saylor announced on X on Monday that Strategy had purchased another 22,337 BTC following its purchase of 17,994 BTC the previous week. Monday’s purchase brings the firm’s total holdings to 761,068 BTC, highlighting its continued aggressive accumulation strategy. Strategy’s average purchase price for all its holdings is $75,696, slightly above current market prices.
Bitcoin safe-haven narrative in play amid the Iran war
Bitcoin price remained resilient, reaching a high of $76,000 during the early Asian trading session on Tuesday, levels not seen since early February. The ongoing Iran war continues to escalate, keeping the global markets on edge, with Equities and Gold facing sustained pressure.
QCP Capital reported on Monday that BTC’s recent price action suggests the narrative of BTC as a “digital safe haven” or “geopolitical hedge” may be resurfacing, with markets stress-testing that thesis in real time.
The report explained that the rising tensions around Iran appear to be pushing more users on-chain in search of cross-border liquidity and capital mobility. This could be seen in the USDC stablecoin supply reaching a record $81.1 billion last week, lifting overall stablecoin supply and signalling fresh liquidity entering crypto amid global uncertainty.
“Interestingly, crypto has decoupled from equities and Gold to the upside before. During the earliest phase of the Russia-Ukraine war in 2022, BTC rallied 37% (from $35k to $48k) within a month before reversing following the collapses of Terra/Luna and FTX. The industry has matured considerably since, and with the potential passage of the Clarity Act, a similar recovery could play out, this time without the same brand of systemic shock,” noted QCP’s analyst.
Bitcoin Price Forecast: BTC bulls aiming for the $78,000 target
Bitcoin price edges slightly down, trading at $74,300 as of writing on Tuesday, after nearly 3% gains in the previous day. The near-term bias turns bullish as price breaks above a parallel channel that had capped advances at roughly $72,600 since early February, signalling a shift away from the prior sequence of lower highs. This upside break unfolds as BTC pushes further above the 50-day Exponential Moving Average (EMA) around $72,900.
The Relative Strength Index (RSI) on the daily chart is at 60, staying above its midline without reaching overbought territory, aligning with firm but not overstretched bullish momentum, while the Moving Average Convergence Divergence (MACD) line extends above the signal line in positive territory, with a positive histogram that reflects strengthening buying pressure.
Immediate support is seen near $72,900, where the broken channel top roughly converges with the 50-day EMA. A break below this area would expose secondary support around $70,900 (Sunday's low), ahead of the lower band of the parallel channel near $65,900.
On the topside, the technical target for the channel breakout is above $78,000, based on the channel’s width. A sustained close above this area would open the way to the 100-day EMA near $79,400.
As long as price holds above 72,900, the technical structure favors continuation of the nascent uptrend, with pullbacks viewed as corrective within the broader bullish bias.
-1773741506665-1773741506666.png)
(The technical analysis of this story was written with the help of an AI tool.)
Bitcoin, altcoins, stablecoins FAQs
Bitcoin is the largest cryptocurrency by market capitalization, a virtual currency designed to serve as money. This form of payment cannot be controlled by any one person, group, or entity, which eliminates the need for third-party participation during financial transactions.
Altcoins are any cryptocurrency apart from Bitcoin, but some also regard Ethereum as a non-altcoin because it is from these two cryptocurrencies that forking happens. If this is true, then Litecoin is the first altcoin, forked from the Bitcoin protocol and, therefore, an “improved” version of it.
Stablecoins are cryptocurrencies designed to have a stable price, with their value backed by a reserve of the asset it represents. To achieve this, the value of any one stablecoin is pegged to a commodity or financial instrument, such as the US Dollar (USD), with its supply regulated by an algorithm or demand. The main goal of stablecoins is to provide an on/off-ramp for investors willing to trade and invest in cryptocurrencies. Stablecoins also allow investors to store value since cryptocurrencies, in general, are subject to volatility.
Bitcoin dominance is the ratio of Bitcoin's market capitalization to the total market capitalization of all cryptocurrencies combined. It provides a clear picture of Bitcoin’s interest among investors. A high BTC dominance typically happens before and during a bull run, in which investors resort to investing in relatively stable and high market capitalization cryptocurrency like Bitcoin. A drop in BTC dominance usually means that investors are moving their capital and/or profits to altcoins in a quest for higher returns, which usually triggers an explosion of altcoin rallies.
추천 기사


