

Bitcoin Price Forecast: BTC struggles to regain $90K as bearish pressure persists
- Bitcoin price steadies above $89,000 on Monday after failing to break above a descending trendline in the previous week.
- Commodity trader Peter Brandt said BTC could fall to $25,240 after breaking below its parabolic support line, which historically signals deeper corrections.
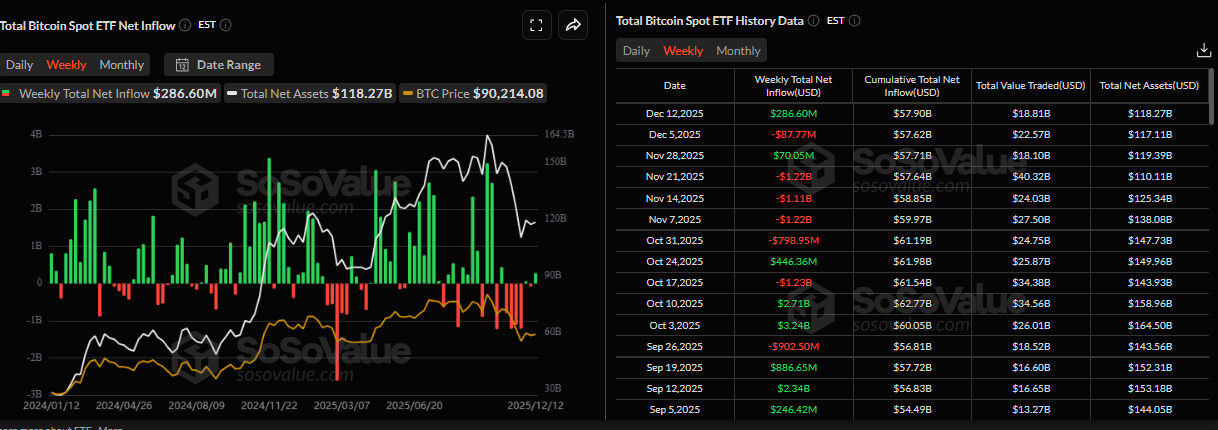
- US-listed spot Bitcoin ETFs recorded a mild weekly inflow of $286.60 million, indicating a slight increase in institutional participation.
Bitcoin (BTC) steadies above $89,000 at the time of writing on Monday, after failing to break above a descending trendline last week. Meanwhile, modest inflows into US-listed spot Bitcoin Exchange Traded Funds (ETFs) suggest improving institutional interest. However, traders should remain cautious, as bearish technical outlook and warnings from veteran trader Peter Brandt keep downside risks firmly in focus.
Why BTC could fall toward $25,000?
Peter Brandt, a veteran commodity trader, posted on his X account on Monday that BTC could fall toward $25,240.
Brandt explained that Bitcoin bull cycles have experienced exponential decay, indicating that the explosive move in BTC is slowing over time and signaling the asset’s maturity. Historically, all previous bull cycles have gone through a parabolic move, as shown in the chart below.
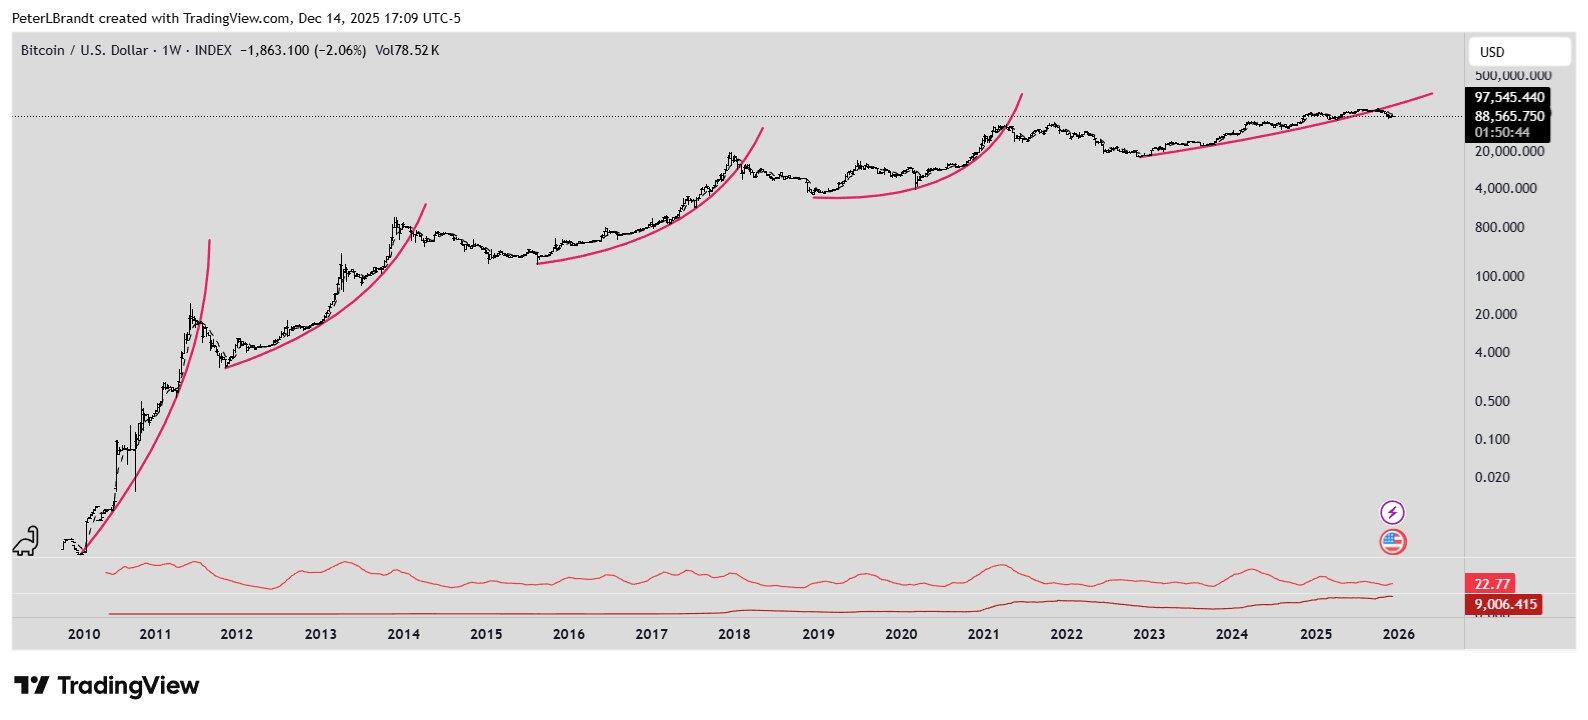
However, in each cycle, when BTC broke below the parabolic support line, it declined by at least 80%. As BTC’s current price hovers around $89,000, the parabolic advance has been violated and Brandt suggests it could lead to a correction to $25,240.
Some other signs of concern
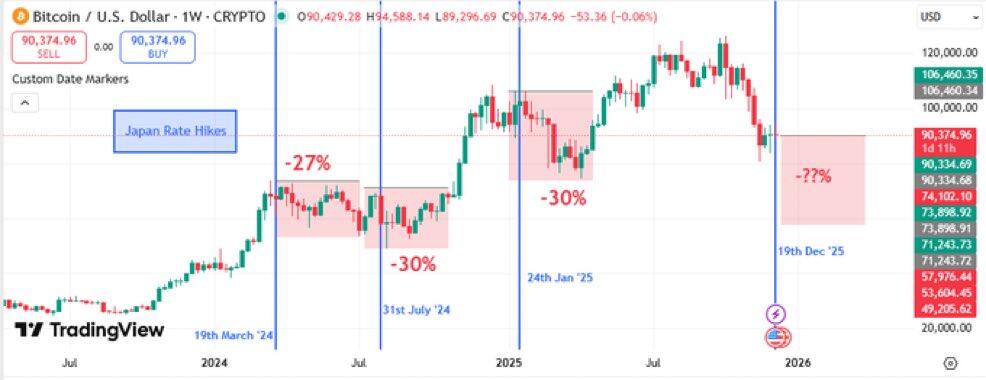
In addition to the veteran traders’ bearish outlook, another sign to watch for is the Bank of Japan’s (BoJ) interest rate decision on Friday, in which the central bank is expected to raise borrowing costs by 25 basis points (bps).
As shown in the chart below, Bitcoin has historically declined following BoJ rate hikes, falling 27% after the March 2024 decision, 30% after the July 2024 hike, and 30% after January 2025, showing a consistent pattern of sharp pullbacks after BoJ policy tightening.
If history repeats after Friday’s rate decision, Bitcoin could mirror past reactions, potentially undergoing a roughly 30% correction that would drag the price toward $63,000.
Mild improvement in institutional demand
Institutional demand for Bitcoin shows mild signs of improvement. According to SoSoValue data, US-listed spot Bitcoin ETFs recorded a weekly inflow of $286.60 million, following a mild outflow of $87.77 million in the previous week, suggesting that institutional investor interest improved slightly. However, these weekly inflows remain small relative to those observed in mid-September. For BTC to continue its recovery, the ETF inflows should intensify.
Bitcoin Price Forecast: BTC struggles below $90,000
Bitcoin price was rejected from a descending trendline (drawn by connecting multiple highs since early October) last week. This trendline coincided with the 61.8% Fibonacci retracement level at $94,253 (drawn from the April low of $74,508 to the all-time high of $126,199 set in October), making it a key resistance zone. As of Monday, BTC hovers above $89,000.
If BTC continues its pullback, it could extend the decline toward the next key support at $85,569, which aligns with the 78.6% Fibonacci retracement level.
The Relative Strength Index (RSI) on the daily chart is at 44, below its neutral level of 50, indicating slight bearish momentum. Moreover, the Moving Average Convergence Divergence (MACD) lines are converging, and a flip to a bearish crossover would further support the bearish outlook.
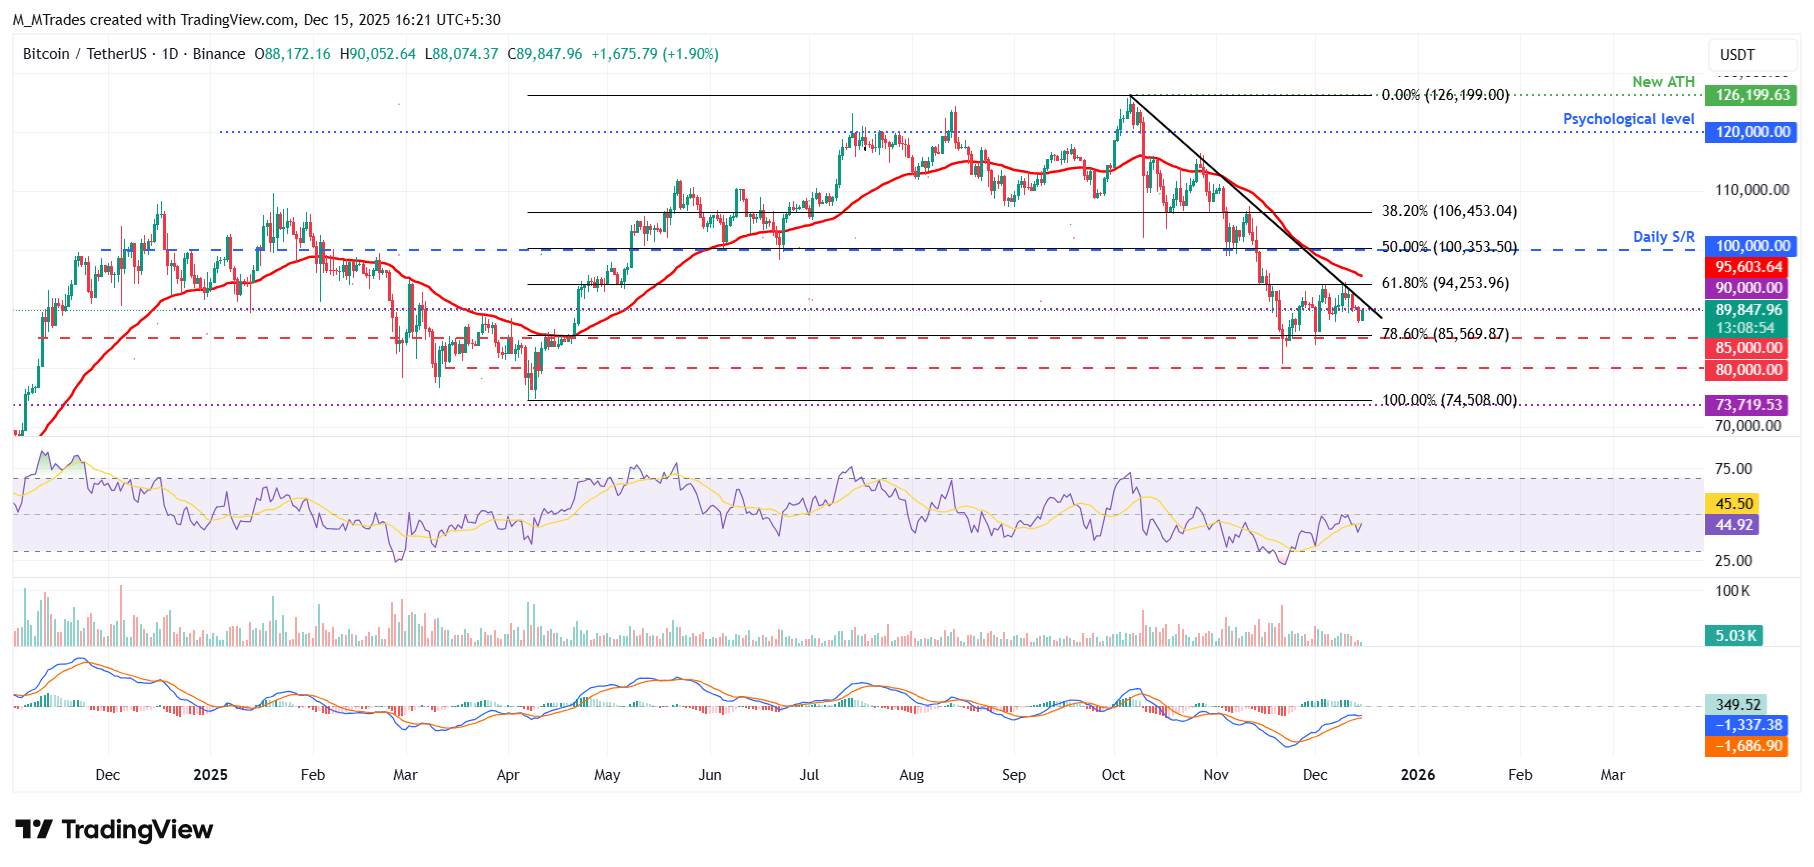
Looking up, if BTC breaks above the descending trendline and closes above the $94,253 resistance level, it could extend the rally toward the $100,000 psychological level.
Bitcoin, altcoins, stablecoins FAQs
Bitcoin is the largest cryptocurrency by market capitalization, a virtual currency designed to serve as money. This form of payment cannot be controlled by any one person, group, or entity, which eliminates the need for third-party participation during financial transactions.
Altcoins are any cryptocurrency apart from Bitcoin, but some also regard Ethereum as a non-altcoin because it is from these two cryptocurrencies that forking happens. If this is true, then Litecoin is the first altcoin, forked from the Bitcoin protocol and, therefore, an “improved” version of it.
Stablecoins are cryptocurrencies designed to have a stable price, with their value backed by a reserve of the asset it represents. To achieve this, the value of any one stablecoin is pegged to a commodity or financial instrument, such as the US Dollar (USD), with its supply regulated by an algorithm or demand. The main goal of stablecoins is to provide an on/off-ramp for investors willing to trade and invest in cryptocurrencies. Stablecoins also allow investors to store value since cryptocurrencies, in general, are subject to volatility.
Bitcoin dominance is the ratio of Bitcoin's market capitalization to the total market capitalization of all cryptocurrencies combined. It provides a clear picture of Bitcoin’s interest among investors. A high BTC dominance typically happens before and during a bull run, in which investors resort to investing in relatively stable and high market capitalization cryptocurrency like Bitcoin. A drop in BTC dominance usually means that investors are moving their capital and/or profits to altcoins in a quest for higher returns, which usually triggers an explosion of altcoin rallies.
추천 기사


