

Bitcoin Price Forecast: BTC holds $92,000, primed for volatility as Fed decision looms
- Bitcoin price approaches key resistance at $94,253, a breakout above this level could trigger further upside momentum.
- BTC may see heightened volatility as the Fed is set to announce its monetary policy decision and forward guidance.
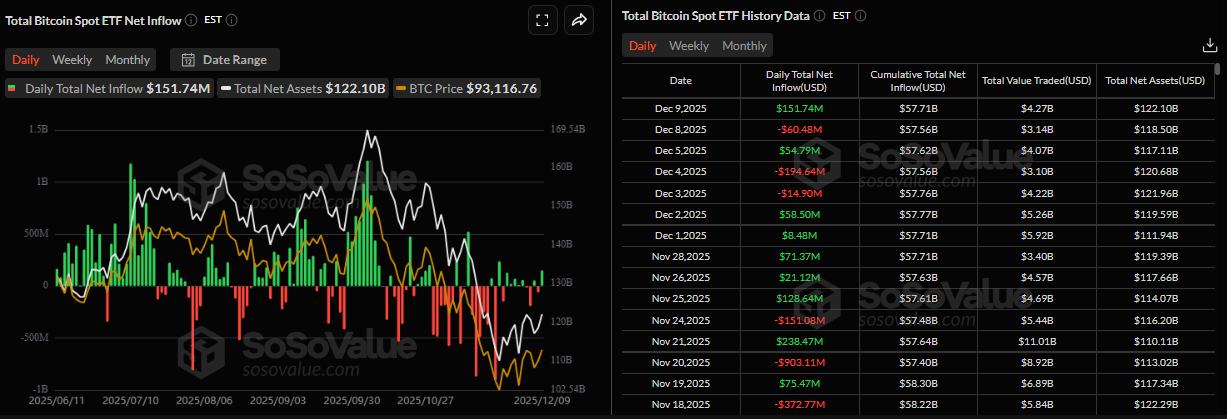
- US-listed spot Bitcoin ETFs record $151.74 million in inflows on Tuesday, signaling a slight improvement in institutional appetite.
Bitcoin (BTC) price enters a pivotal week as traders position themselves ahead of the US Federal Reserve’s monetary policy decision. With BTC hovering near a key resistance zone, Wednesday’s Federal Open Market Committee (FOMC) meeting stands out as the most important market-moving event of the week. The Fed’s forward guidance, inflation outlook, and interest-rate path will likely dictate market volatility, making the announcement a decisive catalyst for the next move in the largest cryptocurrency by market capitalization.
Bitcoin eyes volatility as Fed decision nears
Bitcoin started the week on a positive note, extending its weekend recovery, rising slightly and holding above $92,000 at the time of writing on Wednesday. The largest cryptocurrency could experience heightened volatility as the US Federal Reserve (Fed) is scheduled to announce its monetary policy decision later in the day, and is widely expected to cut interest rates by 25 basis points despite sticky inflation.
“Wednesday’s FOMC marks the most critical known market-moving event this week,” says K33 Research analyst.
The analyst noted that the market is currently positioned for a rate cut, pricing in an 89.4% chance of a 25 bps cut. While the market broadly expects lower rates, the current odds reflect the lowest pre-FOMC certainty in the market this year. The uncertainty stems from Fed Chairman Jerome Powell’s ambiguity at the October meeting regarding the central bank's next steps, and leaves significant room for volatility in Wednesday’s trading session.
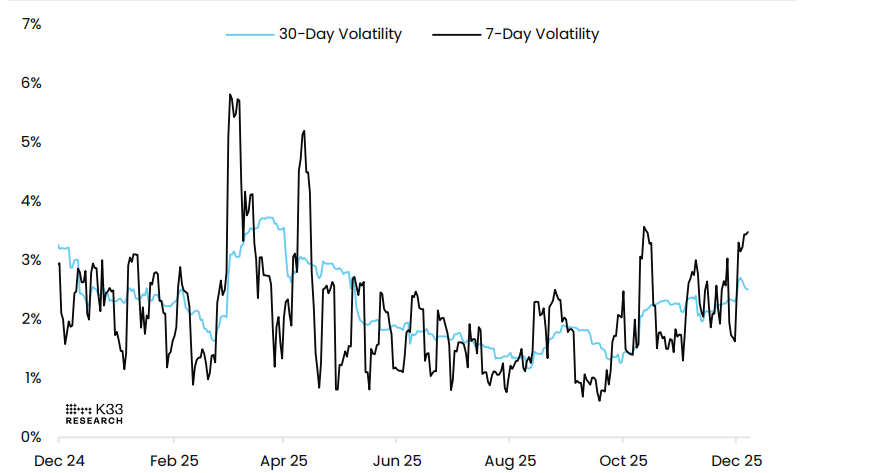
The chart below shows BTC/USD volatility is trending higher. Bitcoin is currently trading in a choppy structure with frequent substantial daily price moves, a symptom of low liquidity and relatively inactive buyers and sellers. Additionally, the 7-day volatility rose to 3.4% last week, its highest since October 14.
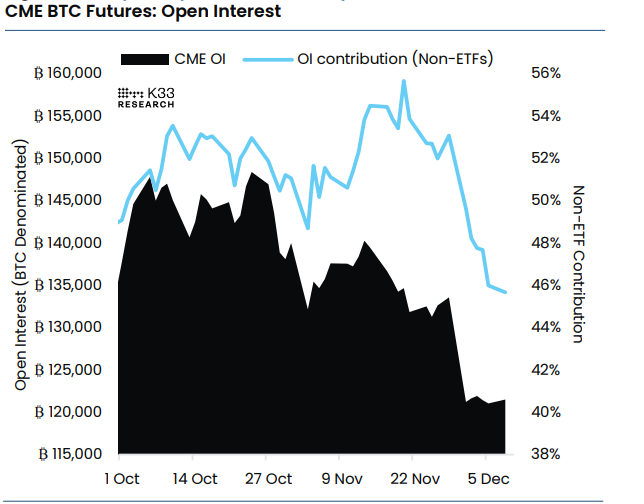
The K33 Research report further notes that inactivity is the most notable observation from CME over the past seven-day period. BTC annualized futures premiums stayed flat throughout the week, alongside a mildly expanding term structure. The Open Interest (OI) has shown minimal daily fluctuations, ranging from 121,000 to 122,000 BTC over the past five trading days. This marks the eighth-lowest OI volatility ever recorded on CME’s BTC futures. Historically, similarly muted OI readings have appeared before major market moves.
“We view the current stasis as a product of weak momentum and a lack of clear near-term signals. Any break from this equilibrium, particularly if accompanied by rising CME participation, would offer a stronger read on the market’s next directional move,” writes the analyst.
Mild improvement in institutional demand
Institutional demand for Bitcoin shows a slight improvement. According to SoSoValue data, US-listed spot Bitcoin ETFs recorded a mild inflow of $151.74 million on Tuesday, following an outflow of $60.48 million on Monday. For BTC to continue its recovery, the ETF inflows should remain and intensify.
Bitcoin Price Forecast: BTC could extend its rally if it closes above $94,253
Bitcoin price recovered slightly over the weekend and rose 2.82% so far this week, retesting the 61.80% Fibonacci retracement level at $94,253 (from the April low of $74,508 to the all-time high of $126,199 set in October) on Tuesday, but failed to close above it. As of Wednesday, BTC is trading higher, approaching this resistance level.
If BTC closes above the $94,253 resistance level, it could extend its rally toward the next key resistance at $100,000 round level.
The Relative Strength Index (RSI) on the daily chart is moving above the neutral level of 50, suggesting bearish strength is fading and giving early signs of bullish momentum. Moreover, the Moving Average Convergence Divergence (MACD) showed a bullish crossover at the end of November, which remains intact, supporting the bullish thesis.
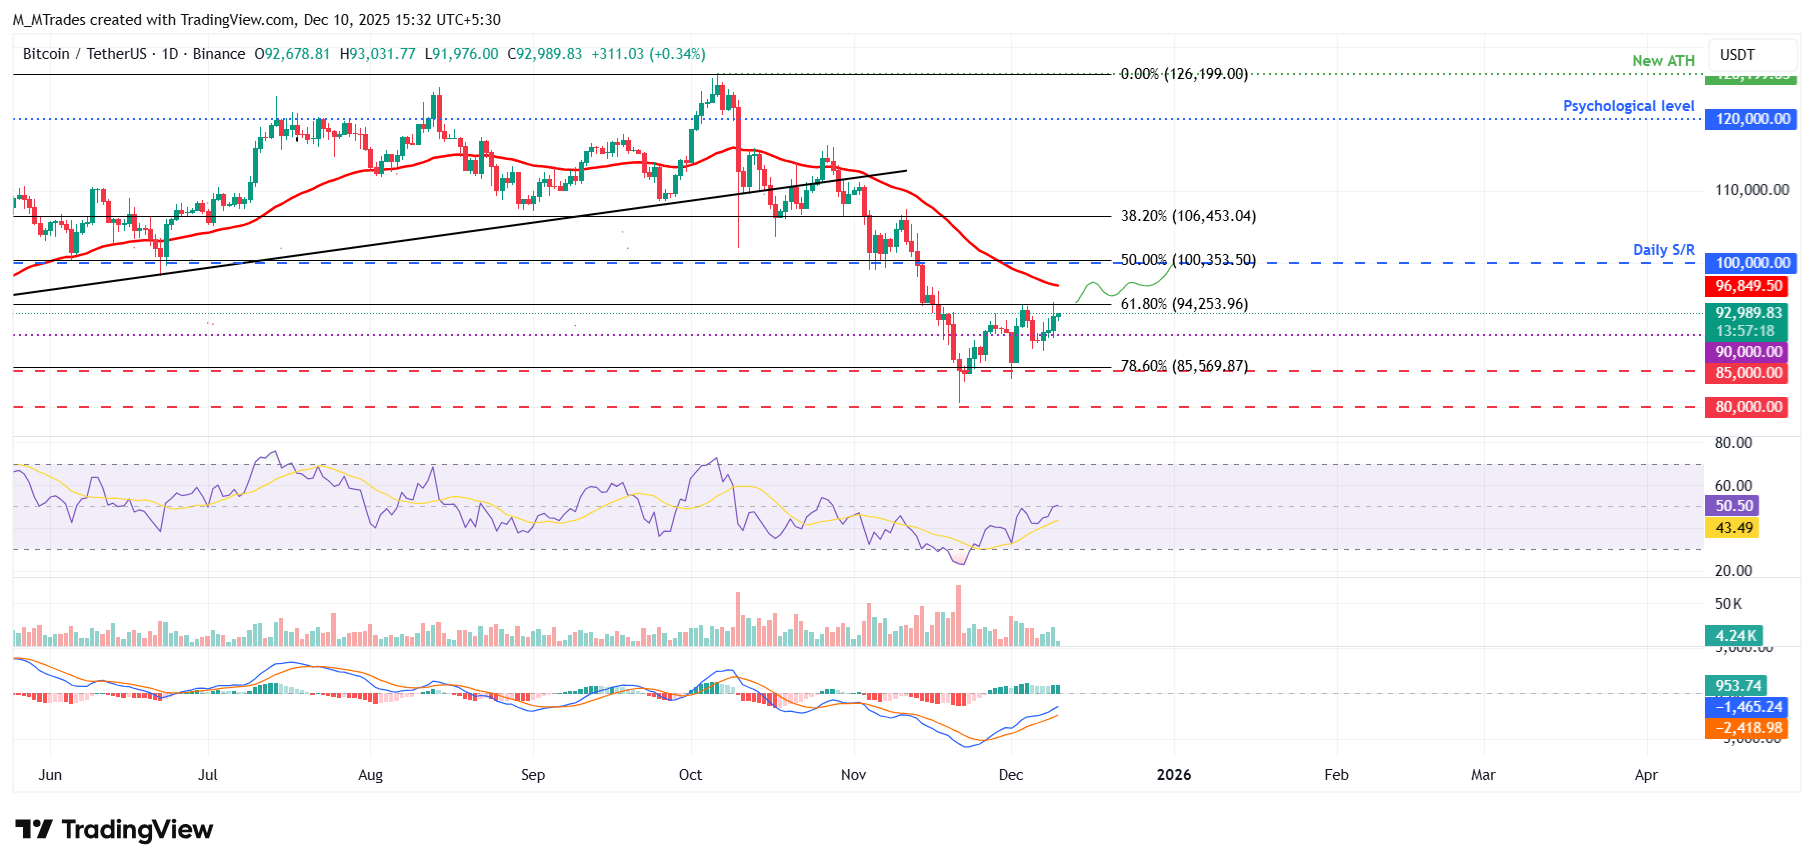
However, if BTC corrects, it could extend the decline toward the next key support at $85,569, its 78.60% Fibonacci retracement level.
Bitcoin, altcoins, stablecoins FAQs
Bitcoin is the largest cryptocurrency by market capitalization, a virtual currency designed to serve as money. This form of payment cannot be controlled by any one person, group, or entity, which eliminates the need for third-party participation during financial transactions.
Altcoins are any cryptocurrency apart from Bitcoin, but some also regard Ethereum as a non-altcoin because it is from these two cryptocurrencies that forking happens. If this is true, then Litecoin is the first altcoin, forked from the Bitcoin protocol and, therefore, an “improved” version of it.
Stablecoins are cryptocurrencies designed to have a stable price, with their value backed by a reserve of the asset it represents. To achieve this, the value of any one stablecoin is pegged to a commodity or financial instrument, such as the US Dollar (USD), with its supply regulated by an algorithm or demand. The main goal of stablecoins is to provide an on/off-ramp for investors willing to trade and invest in cryptocurrencies. Stablecoins also allow investors to store value since cryptocurrencies, in general, are subject to volatility.
Bitcoin dominance is the ratio of Bitcoin's market capitalization to the total market capitalization of all cryptocurrencies combined. It provides a clear picture of Bitcoin’s interest among investors. A high BTC dominance typically happens before and during a bull run, in which investors resort to investing in relatively stable and high market capitalization cryptocurrency like Bitcoin. A drop in BTC dominance usually means that investors are moving their capital and/or profits to altcoins in a quest for higher returns, which usually triggers an explosion of altcoin rallies.
추천 기사


