

Crypto Today: Bitcoin, Ethereum, XRP hold support despite steady selling pressure
- Bitcoin steadies above $92,000, supported by mild ETF inflows.
- Ethereum struggles above $3,000 amid ETF outflows and low retail demand.
- XRP holds above $2.00 support, but recovery remains a pipe dream amid lagging retail interest.
Bitcoin (BTC) is seeking stability above $92,000 at the time of writing on Thursday. Mild inflows into BTC spot Exchange Traded Funds (ETFs) back a slight bullish outlook. However, sell-off risks could prevail due to a weak technical structure.
Meanwhile, Ethereum (ETH) and Ripple (XRP) are holding key support levels at $3,000 and $2.00, respectively, which signals potential seller exhaustion.
Data spotlight: Bitcoin ETF inflows return, Ethereum outflows persist
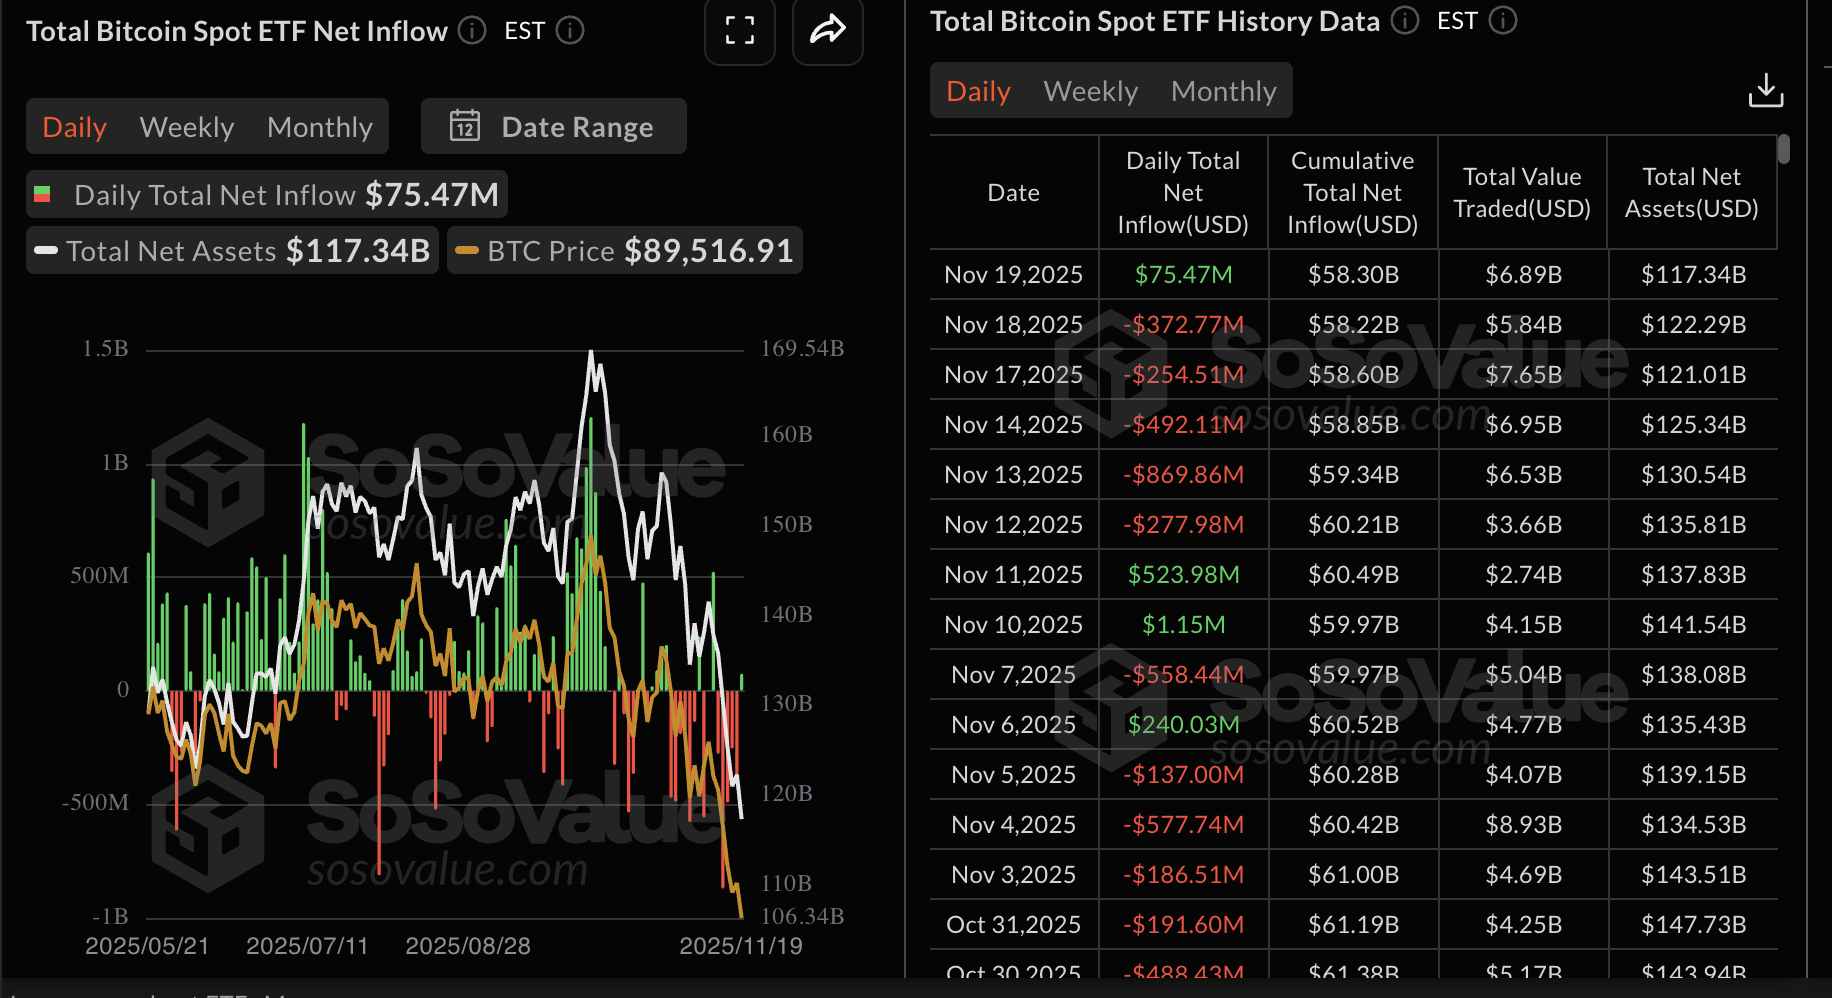
Bitcoin US-listed ETFs experienced mild inflows of approximately $74 million on Wednesday, after five consecutive days of outflows. SoSoValue data shows a cumulative net inflow of $58 billion, with net assets of $117 billion.
ETF inflows signal a potential return to positive market sentiment, with institutional investors showing interest. Steady inflows are required to sustain a recovery in Bitcoin's price toward $100,000.
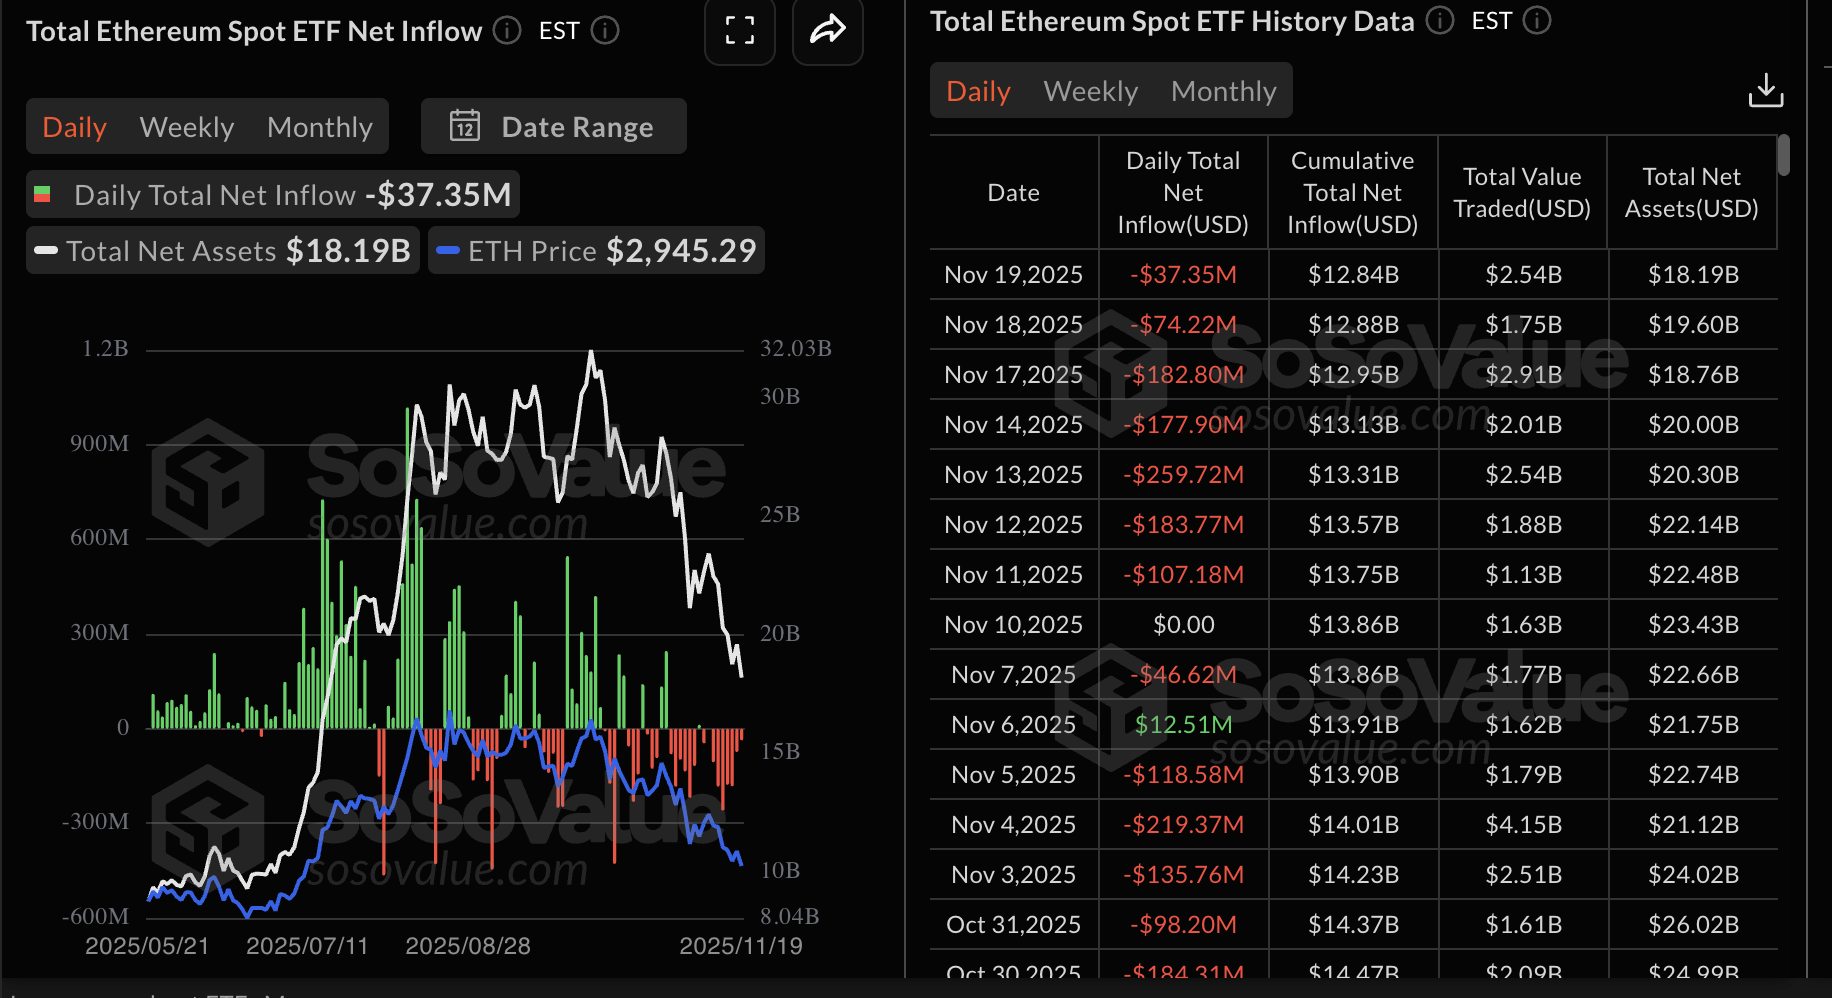
US-listed Ethereum ETFs continue to experience outflows, with approximately $37 million recorded on Wednesday. The cumulative net inflow volume stands at $12.84 billion with net assets of $18.19 billion.
If ETF outflows extend, sentiment will likely weaken, making it hard for Ethereum to sustain recovery above $3,000.
Meanwhile, the XRP derivatives market has stayed quiet since the October 10 flash crash. The futures Open Interest (OI) averages $3.79 billion on Thursday, down from Wednesday's $3.85 billion.
Since OI reflects the notional value of outstanding futures contracts, a steady rise is needed to support an XRP rebound in the near term. Nonetheless, if risk-off sentiment persists and OI continues to decline in the coming days, the odds of a drop below $2.00 will increase.
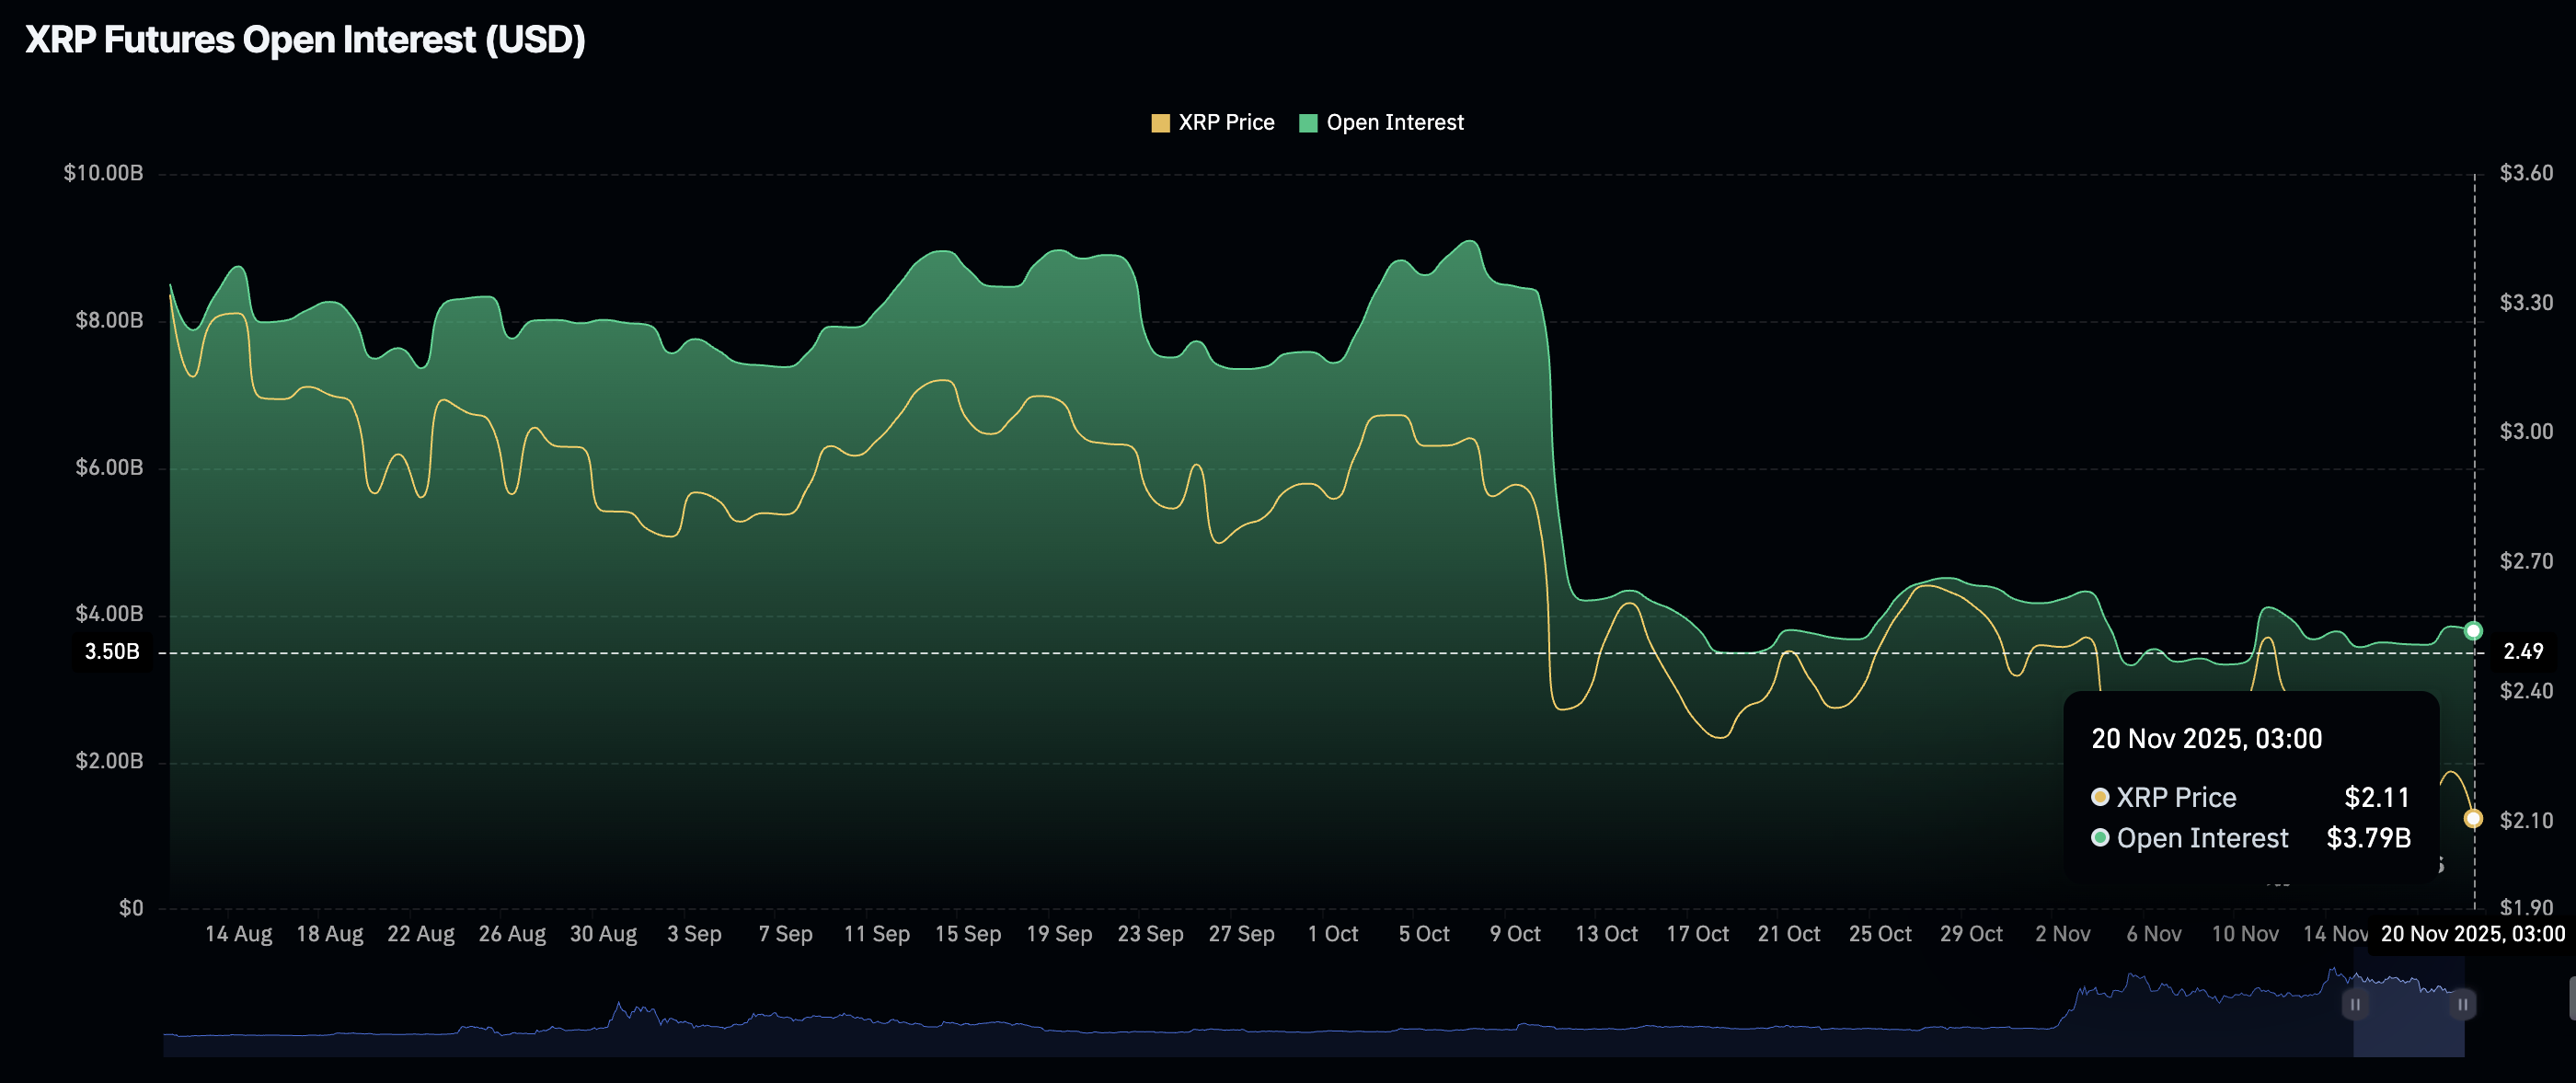
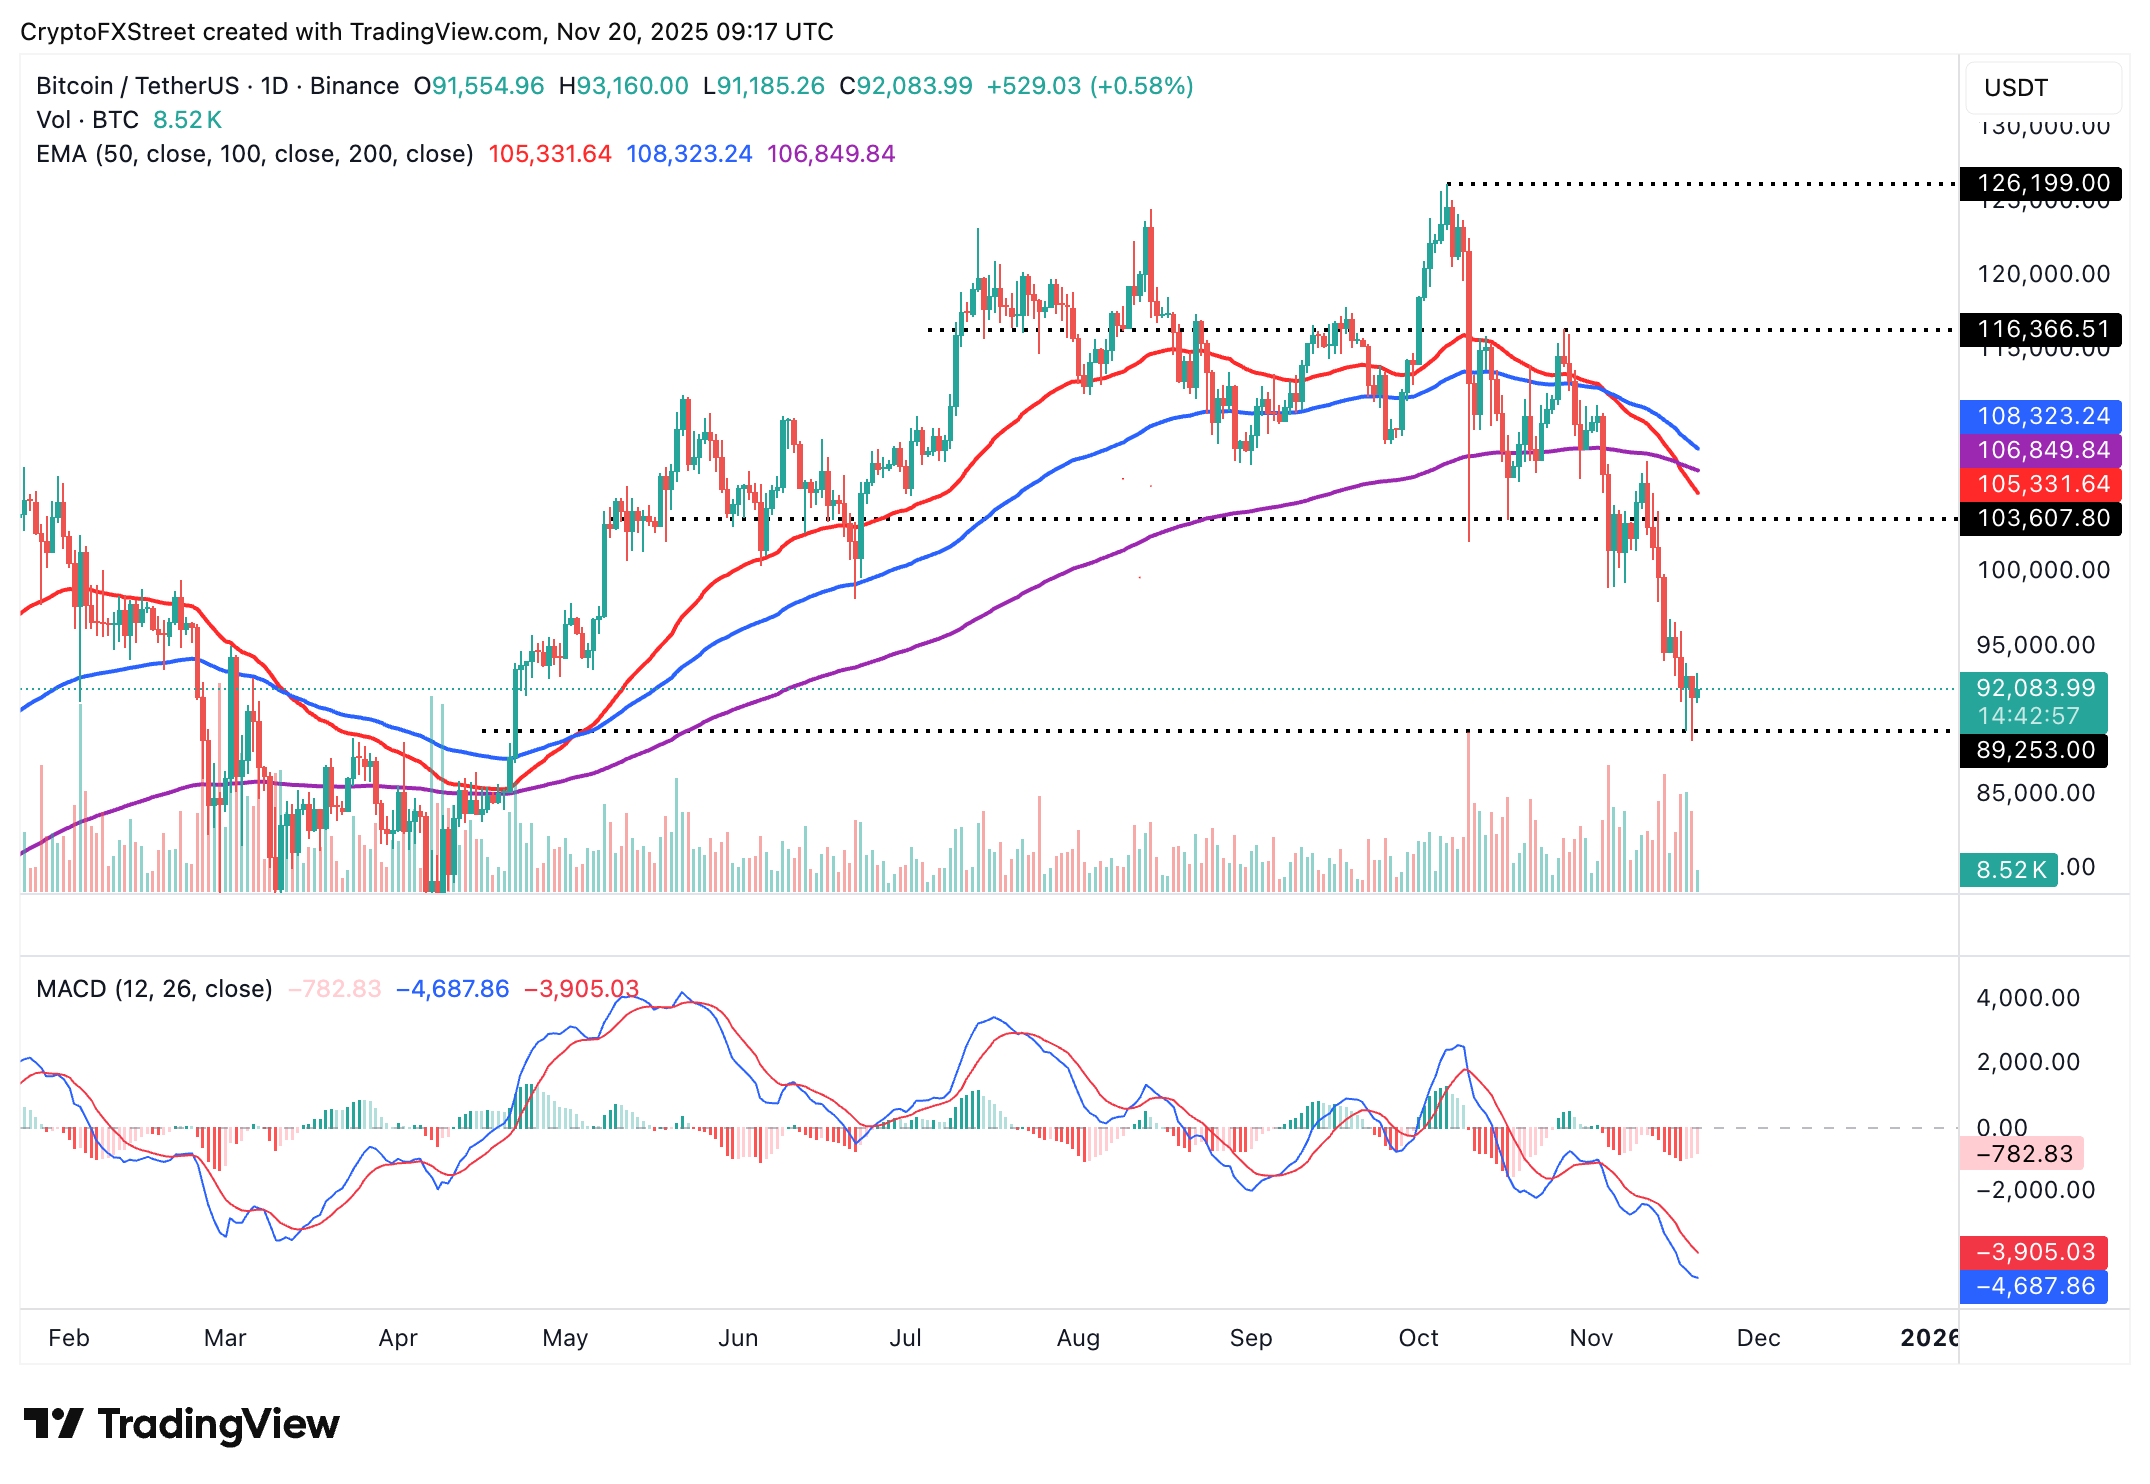
Chart of the day: Bitcoin eyes short-term rebound
Bitcoin is trading above $92,000 at the time of writing on Thursday, after rising from its previous day's low of $88,608. Traders will watch for a daily close above $92,000 or the critical $90,000 level to ascertain Bitcoin's short-term recovery potential.
Still, the Moving Average Convergence Divergence (MACD) indicator on the same chart has upheld a sell signal since November 3. As long as the blue MACD line stays below the red signal line, investors are likely to keep trimming their risk exposure.
Bitcoin is at risk of extending its decline by nearly 10% to $83,111, a level tested as support on April 16, if supply continues to overwhelm demand.
Altcoins update: Can Ethereum, XRP defend key support?
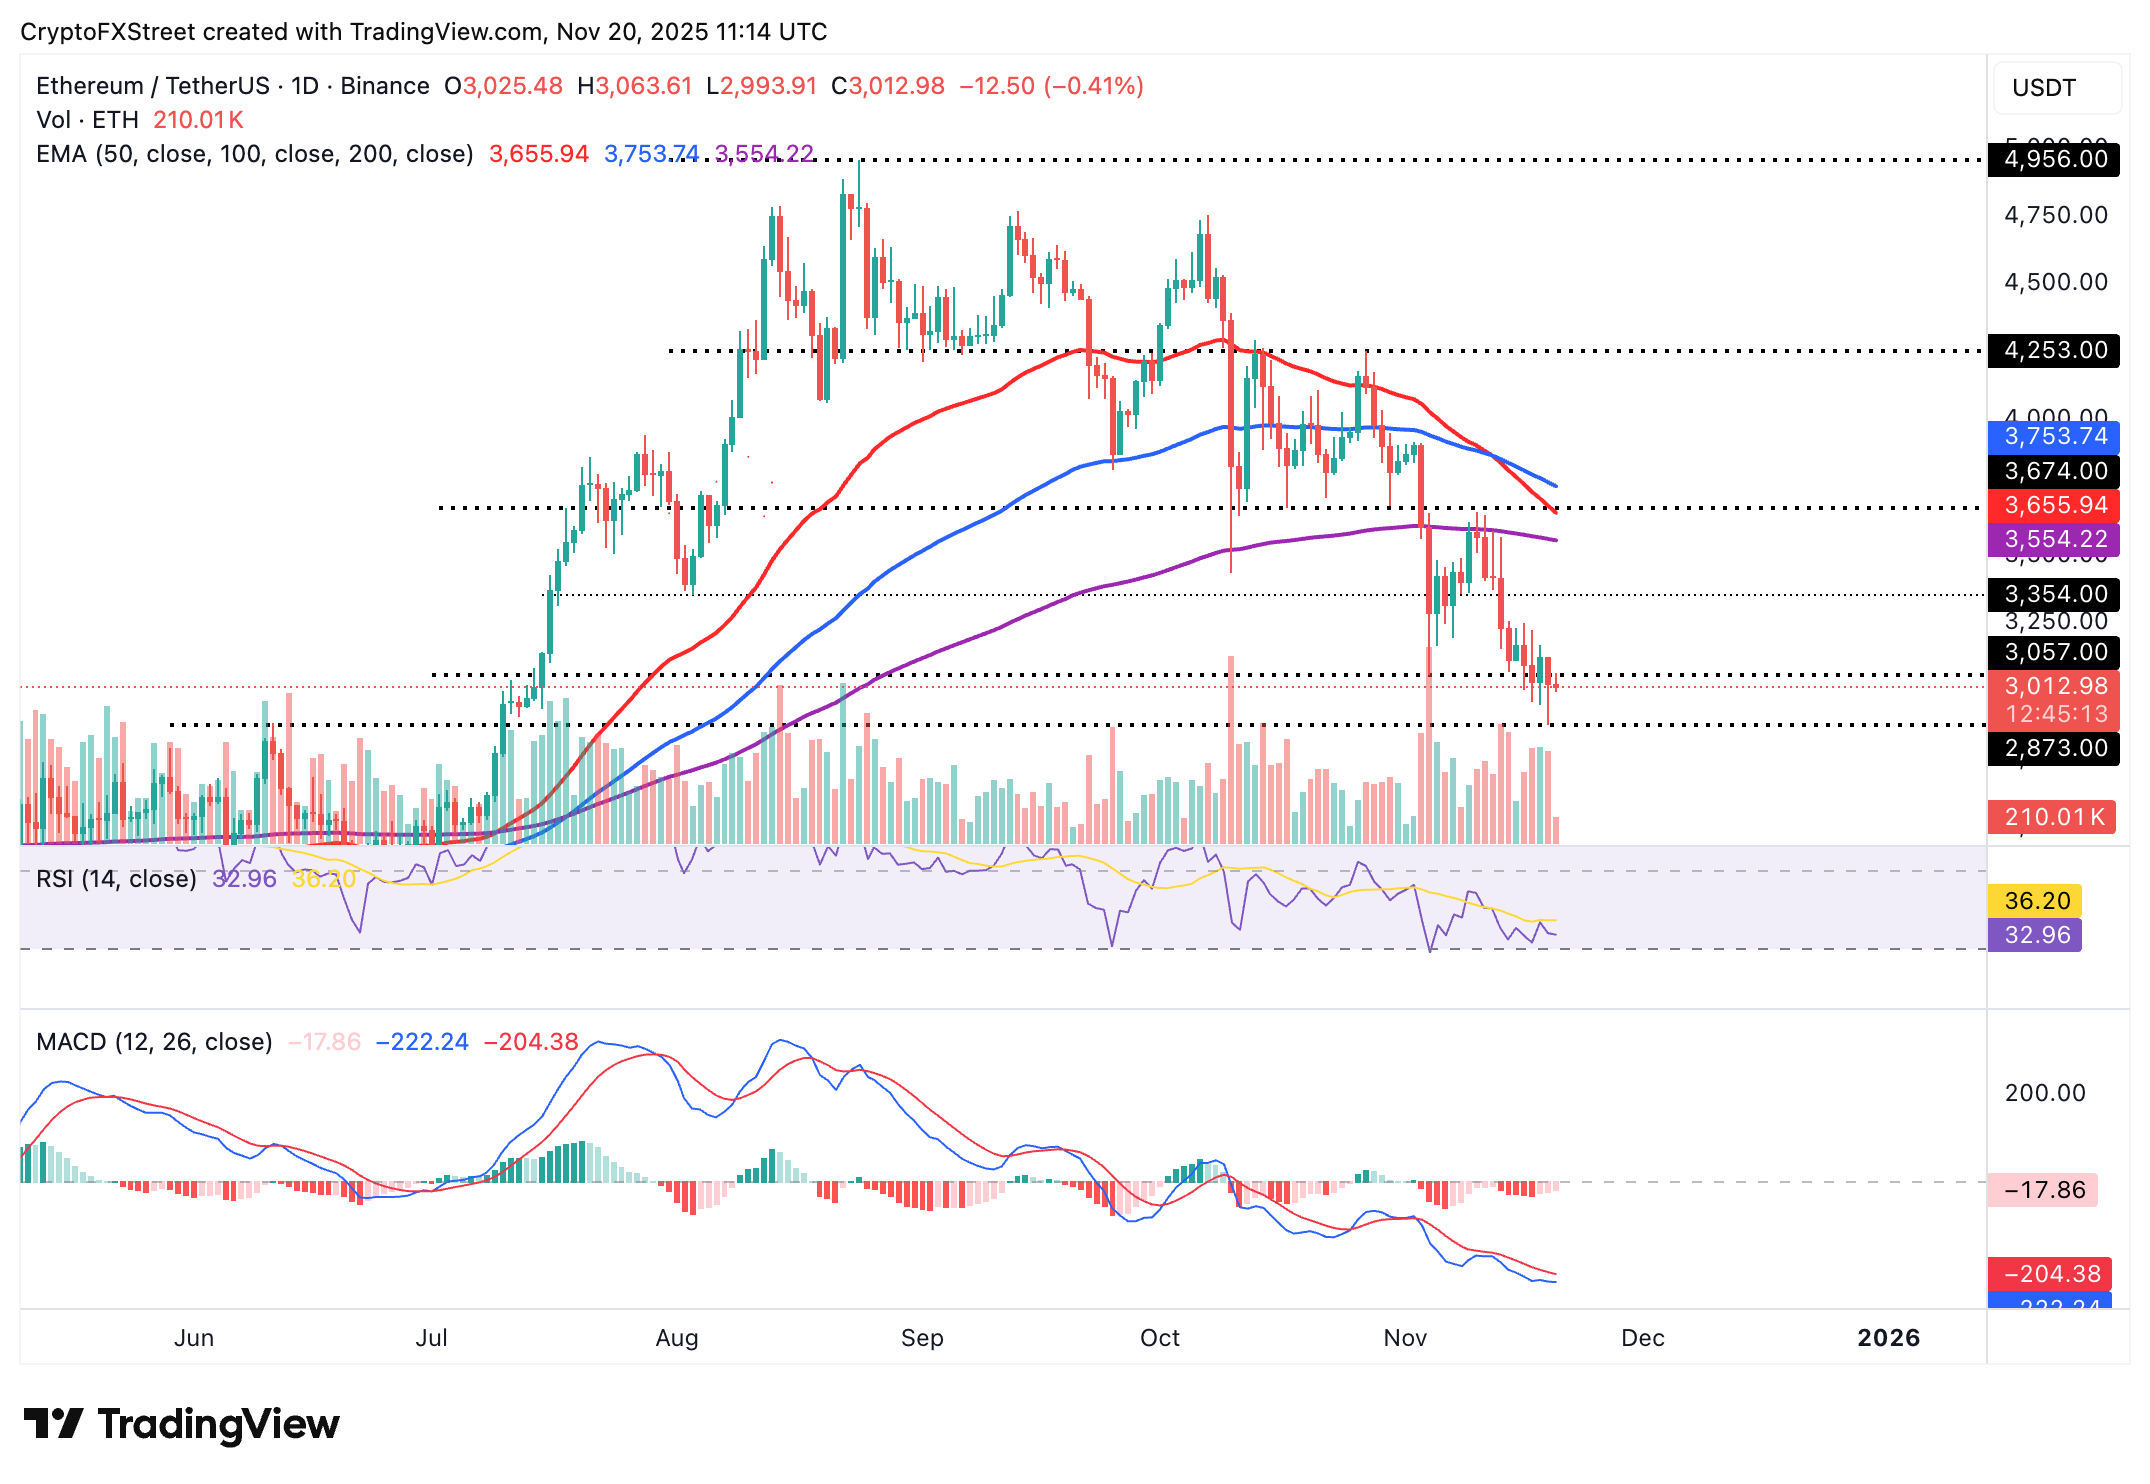
Ethereum is trading above its short-term support at $3,000 but remains below key moving averages, including the 200-day Exponential Moving Average (EMA) at $3,554, the 50-day EMA at $3,655, and the 100-day EMA at $3,753, all of which point to a bearish outlook and a weak technical structure.
The RSI on the daily chart reads 32 and is approaching oversold territory, signaling increasing bearish momentum. A continued decline in the RSI would imply a strong bearish grip, likely bolstering the chances of an extended decline below $3,000.
Traders should not lose sight of the support at $2,873, last tested on Wednesday. Still, a knee-jerk recovery could occur if investors buy the dip, while anticipating a steady uptrend toward the 200-day EMA at $3,554.
On the other hand, XRP teeters above its $2.00 support at the time of writing on Thursday as bulls battle to regain control. The RSI is at 37, indicating stability. Higher RSI readings would assert the bullish momentum. However, a decline into the oversold region would indicate increasing bearish momentum.
Similarly, the MACD indicator has maintained a sell signal since Sunday. If the blue line remains below the red signal line, it would call for risk-averse action for investors.
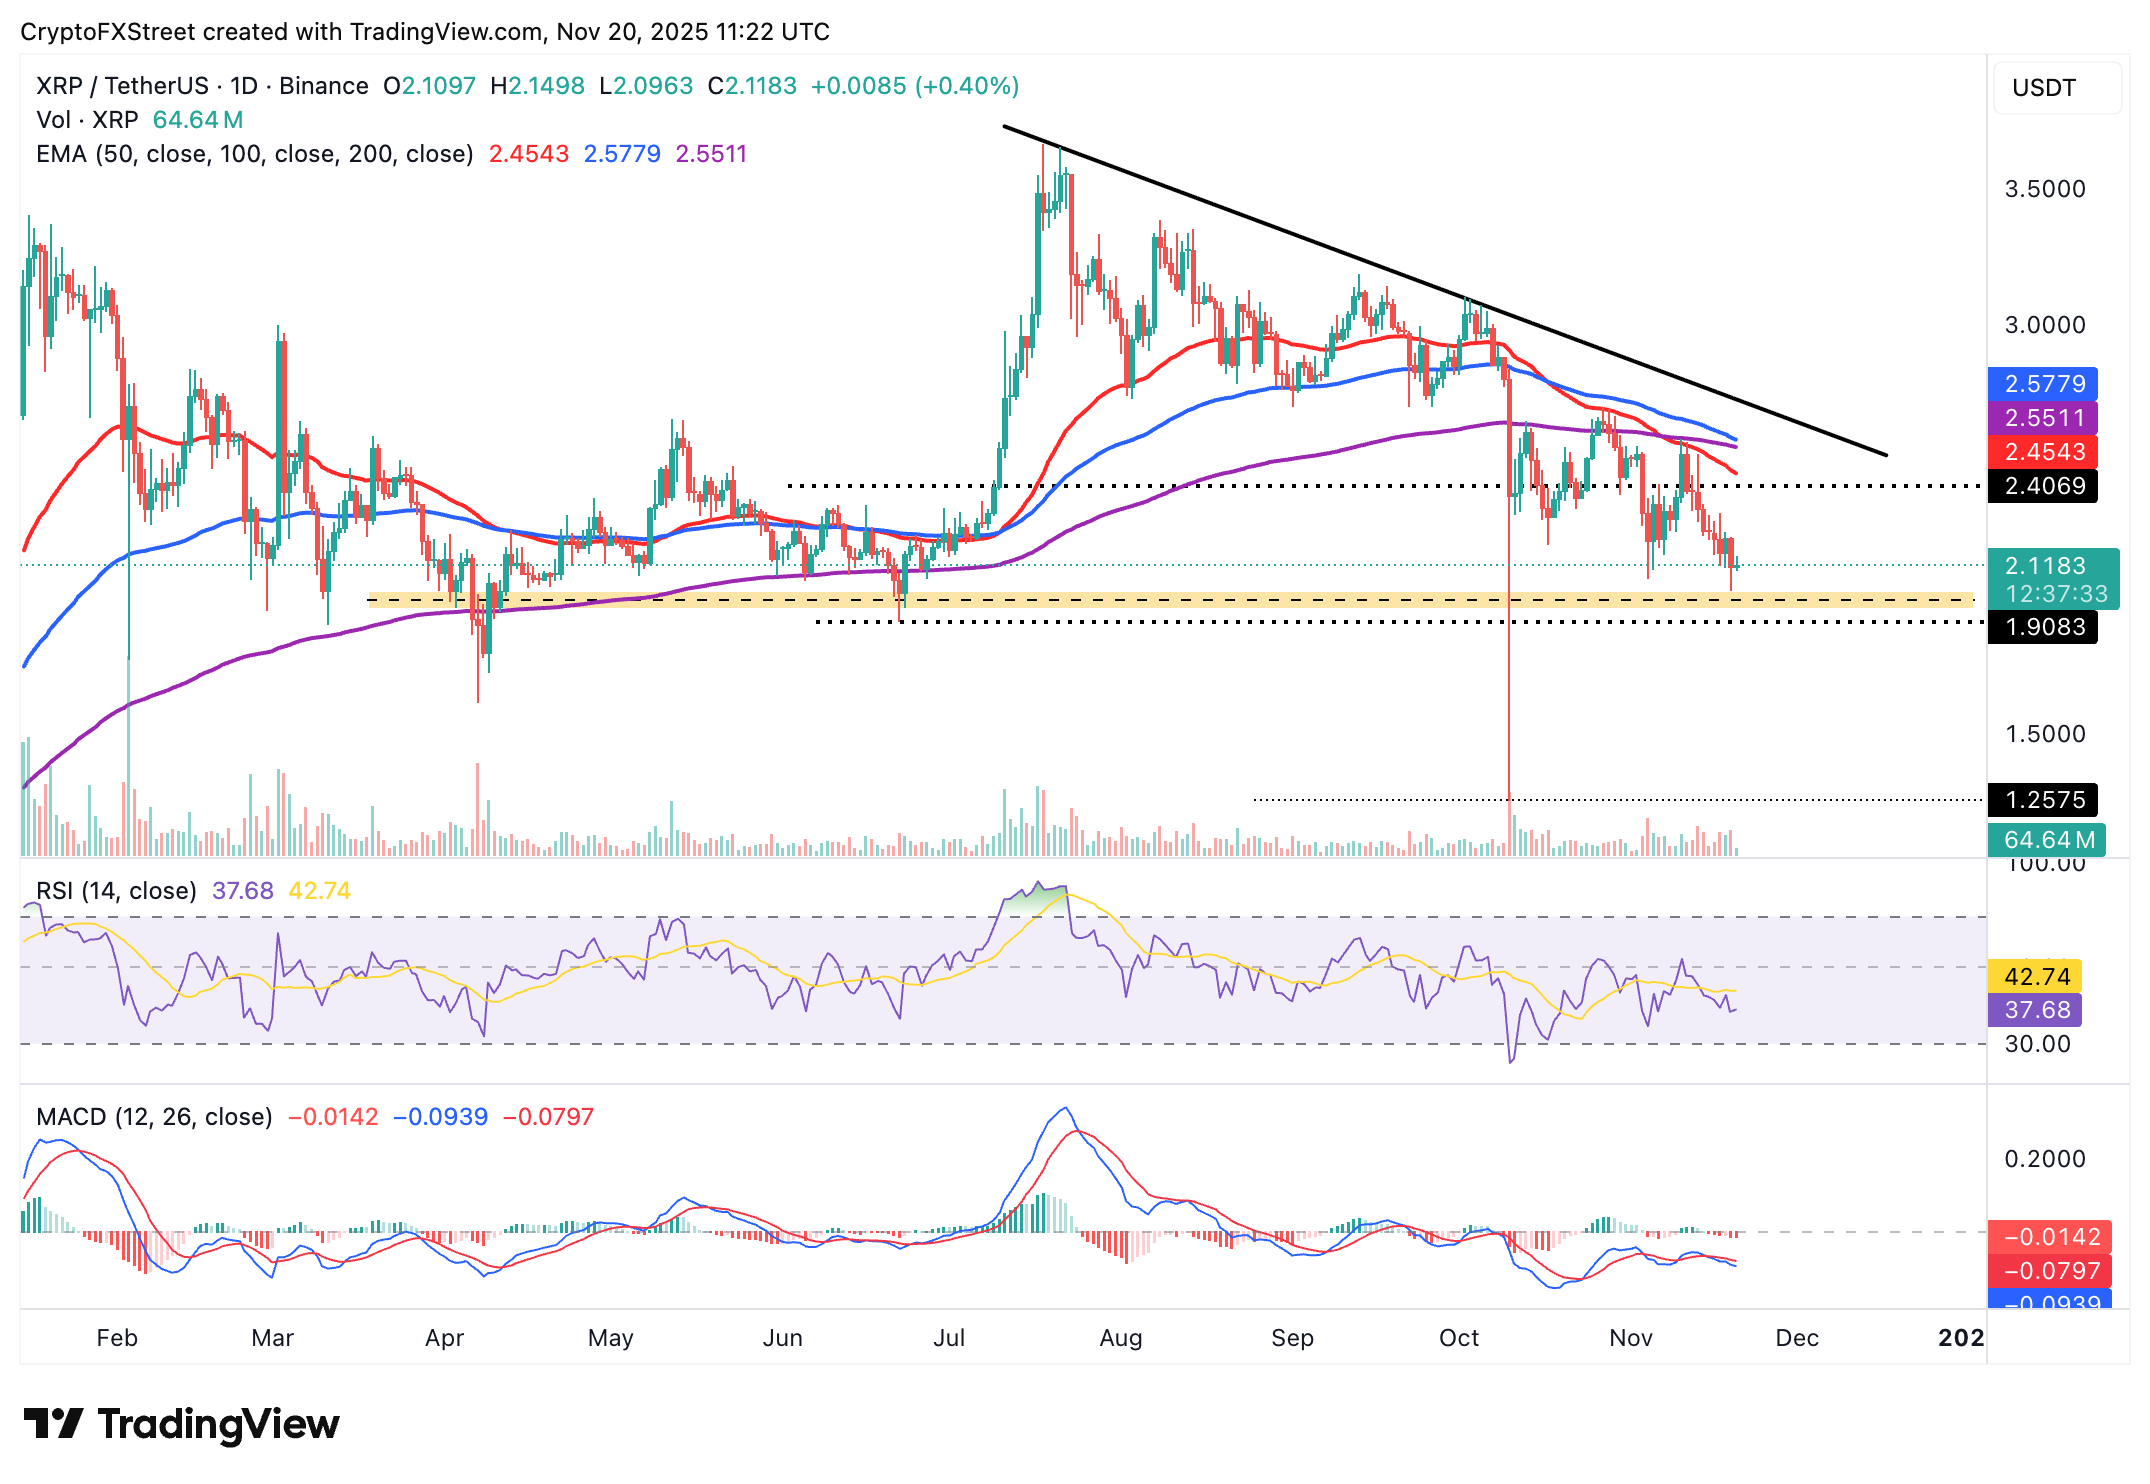
A break below XRP's immediate support at $2.00 could validate an extended correction to the next key area at $1.90, which was last tested in June. Conversely, a trend reversal is possible from the current $2.00 support if investors increase their exposure while anticipating a steady rebound toward the 50-day EMA at $2.45.
Crypto ETF FAQs
An Exchange-Traded Fund (ETF) is an investment vehicle or an index that tracks the price of an underlying asset. ETFs can not only track a single asset, but a group of assets and sectors. For example, a Bitcoin ETF tracks Bitcoin’s price. ETF is a tool used by investors to gain exposure to a certain asset.
Yes. The first Bitcoin futures ETF in the US was approved by the US Securities & Exchange Commission in October 2021. A total of seven Bitcoin futures ETFs have been approved, with more than 20 still waiting for the regulator’s permission. The SEC says that the cryptocurrency industry is new and subject to manipulation, which is why it has been delaying crypto-related futures ETFs for the last few years.
Yes. The SEC approved in January 2024 the listing and trading of several Bitcoin spot Exchange-Traded Funds, opening the door to institutional capital and mainstream investors to trade the main crypto currency. The decision was hailed by the industry as a game changer.
The main advantage of crypto ETFs is the possibility of gaining exposure to a cryptocurrency without ownership, reducing the risk and cost of holding the asset. Other pros are a lower learning curve and higher security for investors since ETFs take charge of securing the underlying asset holdings. As for the main drawbacks, the main one is that as an investor you can’t have direct ownership of the asset, or, as they say in crypto, “not your keys, not your coins.” Other disadvantages are higher costs associated with holding crypto since ETFs charge fees for active management. Finally, even though investing in ETFs reduces the risk of holding an asset, price swings in the underlying cryptocurrency are likely to be reflected in the investment vehicle too.
추천 기사


