

Bitcoin Price Forecast: BTC risks further losses on a break below $90,000 support
- Bitcoin price hovers around $90,000 key support level, a close below would suggest a deeper correction.
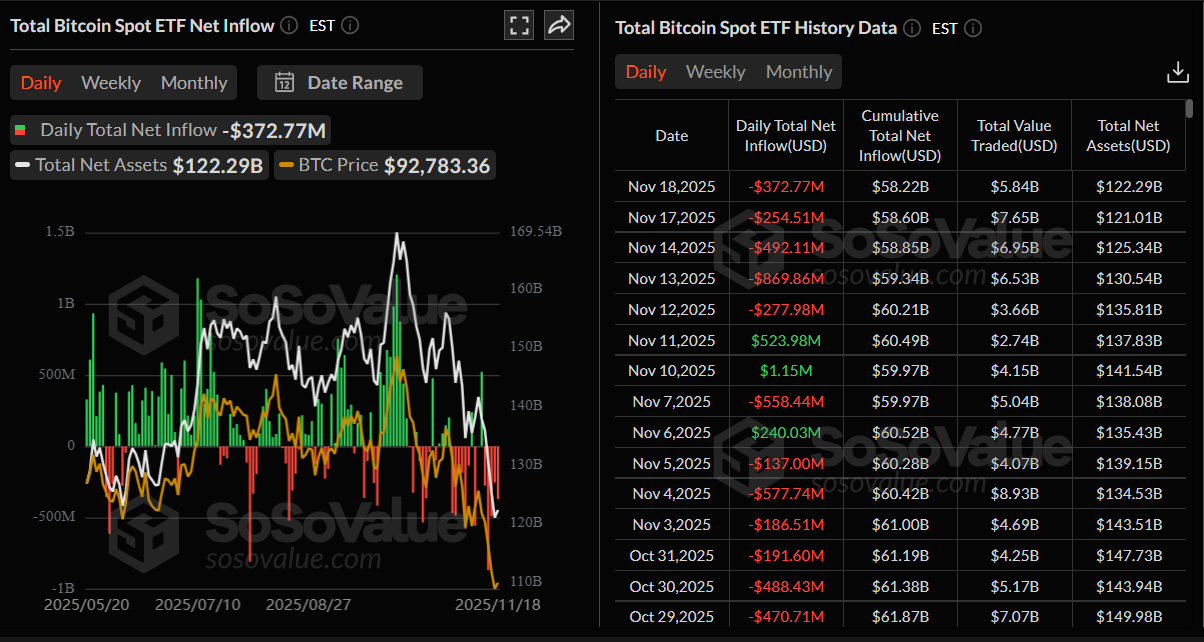
- US-listed spot ETFs recorded an outflow of $372.77 million on Tuesday, extending withdrawals since November 12.
- A report shows heavy sell-side pressure, with long-term holders cutting exposure for months, and ETF investors recently accelerating their selling.
Bitcoin (BTC) trades near the crucial $90,000 support level at the time of writing on Wednesday, and a close beneath it could open the door to further downside. The institutional demand also supports a bearish outlook as US-listed spot Bitcoin Exchange Traded Funds (ETFs) recorded over $370 million in outflows on Tuesday, extending withdrawals since November 12. The report also highlights mounting sell-side pressure, with long-term holders reducing exposure for months and ETF investors now accelerating their selling.
Bitcoin weakens as outflows continue to intensify
Bitcoin price continued to weaken as institutional demand showed further signs of fading. SoSoValue data shows that spot Bitcoin ETFs recorded $372.77 million in outflows on Tuesday, following $254.51 million on Monday, extending a five-day streak of withdrawals since November 12. If this outflow pace persists or intensifies, BTC’s ongoing price correction could deepen, signaling a continued decline in institutional confidence.
Analyst warns of rising sell pressure and dangerous leverage build-up in BTC
A K33 Research report on Tuesday indicates that Bitcoin has been facing intense sell-side pressure from various cohorts. While long-term holders have been steadily reducing their positions for months, the past few weeks have also seen ETF investors unloading significant exposure.
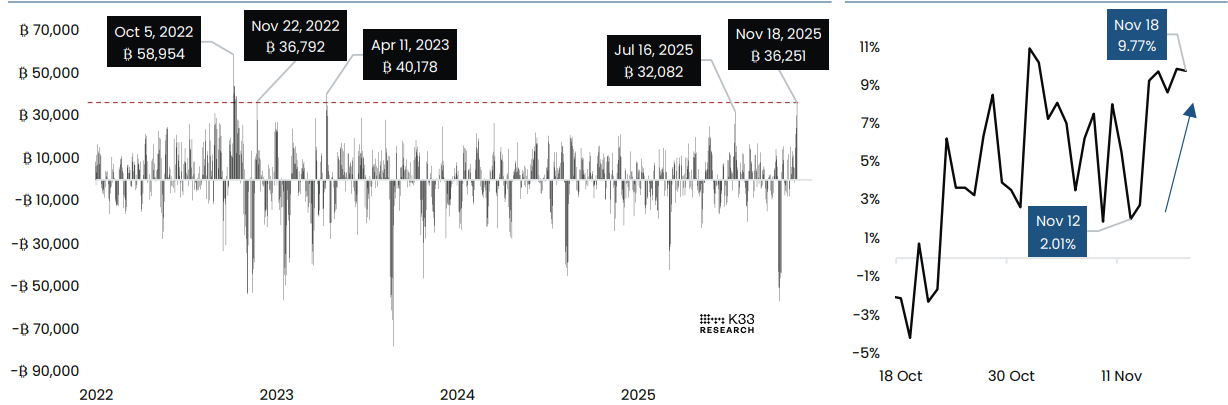
The report warns that a structurally dangerous setup has emerged in the Bitcoin derivatives market. The graph below shows that the leverage has surged rapidly alongside rising funding rates, with the past week showing the largest increase in notional perpetual open interest (right chart) since April 2023. This spike in open interest appears to be driven by traders placing resting limit orders in anticipation of a quick rebound as BTC slipped to six-month lows. However, with no recovery materializing, this accumulated leverage now hangs as excess overhang, heightening the risk of sharp, liquidation-driven volatility.
“Every long position is balanced out with a short position taking the other side. Thus, squeeze risks are present in either direction. That said, per the clear upward trend in funding rates, long aggression is evident,” said the K33 analyst.
How low can BTC go?
Historical data show that in March 2024, BTC fell 33.57% from its all-time high, while the tariff-driven sell-off in Q1 resulted in a 31.95% drawdown. A decline of similar magnitude today would place BTC in the $84,000–$86,000 range. K33 analysts warn that the resurgence of leverage in the derivatives market could be the catalyst that drags prices toward these levels—or even deeper.
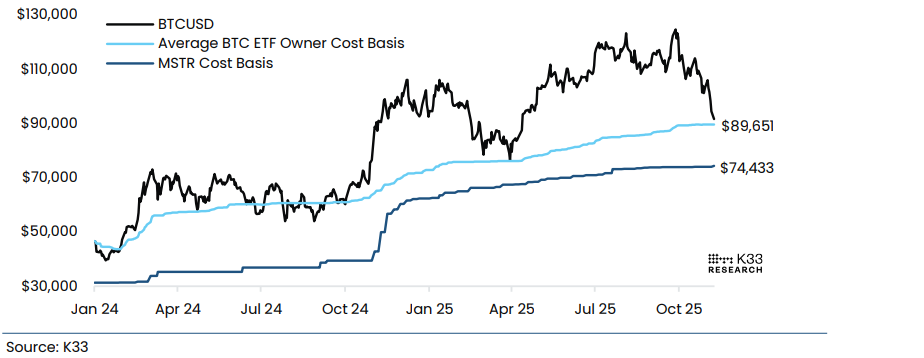
The graph below shows that the average cost basis of BTC ETF holders is $89,651, a threshold Bitcoin briefly broke at its Tuesday low of $89,183. During the Q1 downturn, BTC bottomed exactly around this average ETF entry level before staging a recovery, making it a key area to watch once again.
Another widely watched level is MicroStrategy’s cost basis at $74,433, which aligns with Bitcoin’s April 7, 2025, low. While some traders mistakenly believe that a break below this level would force MicroStrategy to sell, the price zone itself remains a significant psychological target that market participants may attempt to chase in a deeper drawdown.
Bitcoin Price Forecast: BTC finds support around a key psychological level at $90,000
Bitcoin started the week on a negative note and extended its decline by 2%, closing below the 61.8% Fibonacci retracement level at $94,253 (drawn from the April 7 low of $74,508 to the all-time high of $126,299 set on October 6). On Tuesday, BTC dipped to $89,253 but rebounded from the key psychological $90,000 level, ultimately closing the day higher at $92,960. At the time of writing on Wednesday, BTC hovers at around $91,300.
If the psychological level at $90,000 continues to hold, BTC could extend the recovery toward the 61.8% Fibonacci retracement at $94,253.
The Relative Strength Index (RSI) on the daily chart is hovering near oversold territory, suggesting bearish momentum may be slowing and a potential short-term rebound could emerge.
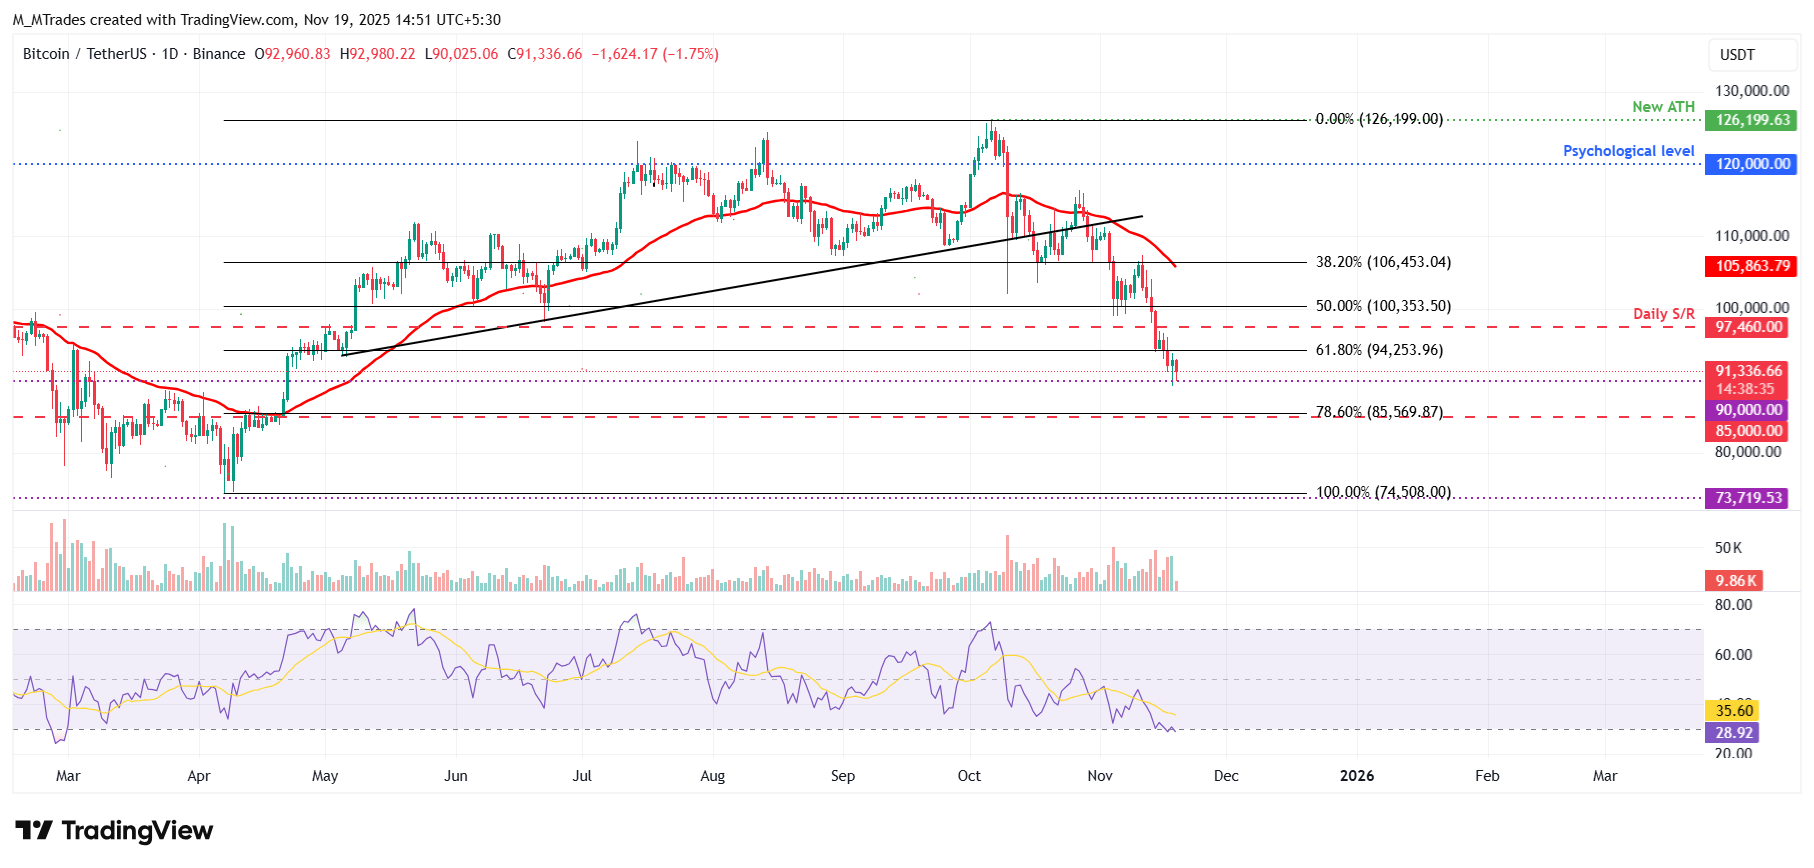
On the other hand, if BTC closes below $90,000, it could extend the correction toward the next daily support at $85,000.
Bitcoin, altcoins, stablecoins FAQs
Bitcoin is the largest cryptocurrency by market capitalization, a virtual currency designed to serve as money. This form of payment cannot be controlled by any one person, group, or entity, which eliminates the need for third-party participation during financial transactions.
Altcoins are any cryptocurrency apart from Bitcoin, but some also regard Ethereum as a non-altcoin because it is from these two cryptocurrencies that forking happens. If this is true, then Litecoin is the first altcoin, forked from the Bitcoin protocol and, therefore, an “improved” version of it.
Stablecoins are cryptocurrencies designed to have a stable price, with their value backed by a reserve of the asset it represents. To achieve this, the value of any one stablecoin is pegged to a commodity or financial instrument, such as the US Dollar (USD), with its supply regulated by an algorithm or demand. The main goal of stablecoins is to provide an on/off-ramp for investors willing to trade and invest in cryptocurrencies. Stablecoins also allow investors to store value since cryptocurrencies, in general, are subject to volatility.
Bitcoin dominance is the ratio of Bitcoin's market capitalization to the total market capitalization of all cryptocurrencies combined. It provides a clear picture of Bitcoin’s interest among investors. A high BTC dominance typically happens before and during a bull run, in which investors resort to investing in relatively stable and high market capitalization cryptocurrency like Bitcoin. A drop in BTC dominance usually means that investors are moving their capital and/or profits to altcoins in a quest for higher returns, which usually triggers an explosion of altcoin rallies.
추천 기사


