

Crypto Today: Bitcoin, Ethereum, XRP continue to struggle as bearish sentiment deepens
- Bitcoin holds above $91,000 amid a broader sell-off and a continued exodus of institutional investors.
- Ethereum rises above $3,000, but downside risks remain amid ETF outflows.
- XRP bulls battle to regain control despite relatively muted retail interest.
Bitcoin (BTC) is trading above $91,000 at the time of writing on Tuesday, down slightly on the day but trimming some earlier losses, weighed by risk-off sentiment in the broader cryptocurrency market. Altcoins, including Ethereum (ETH) and Ripple (XRP), are showing signs of mild recovery, hovering above $3,000 and around $2.18, but the broader trend remains bearish.
Data spotlight: BTC, ETH, XRP risk-off sentiment persists, shaking off weak hands
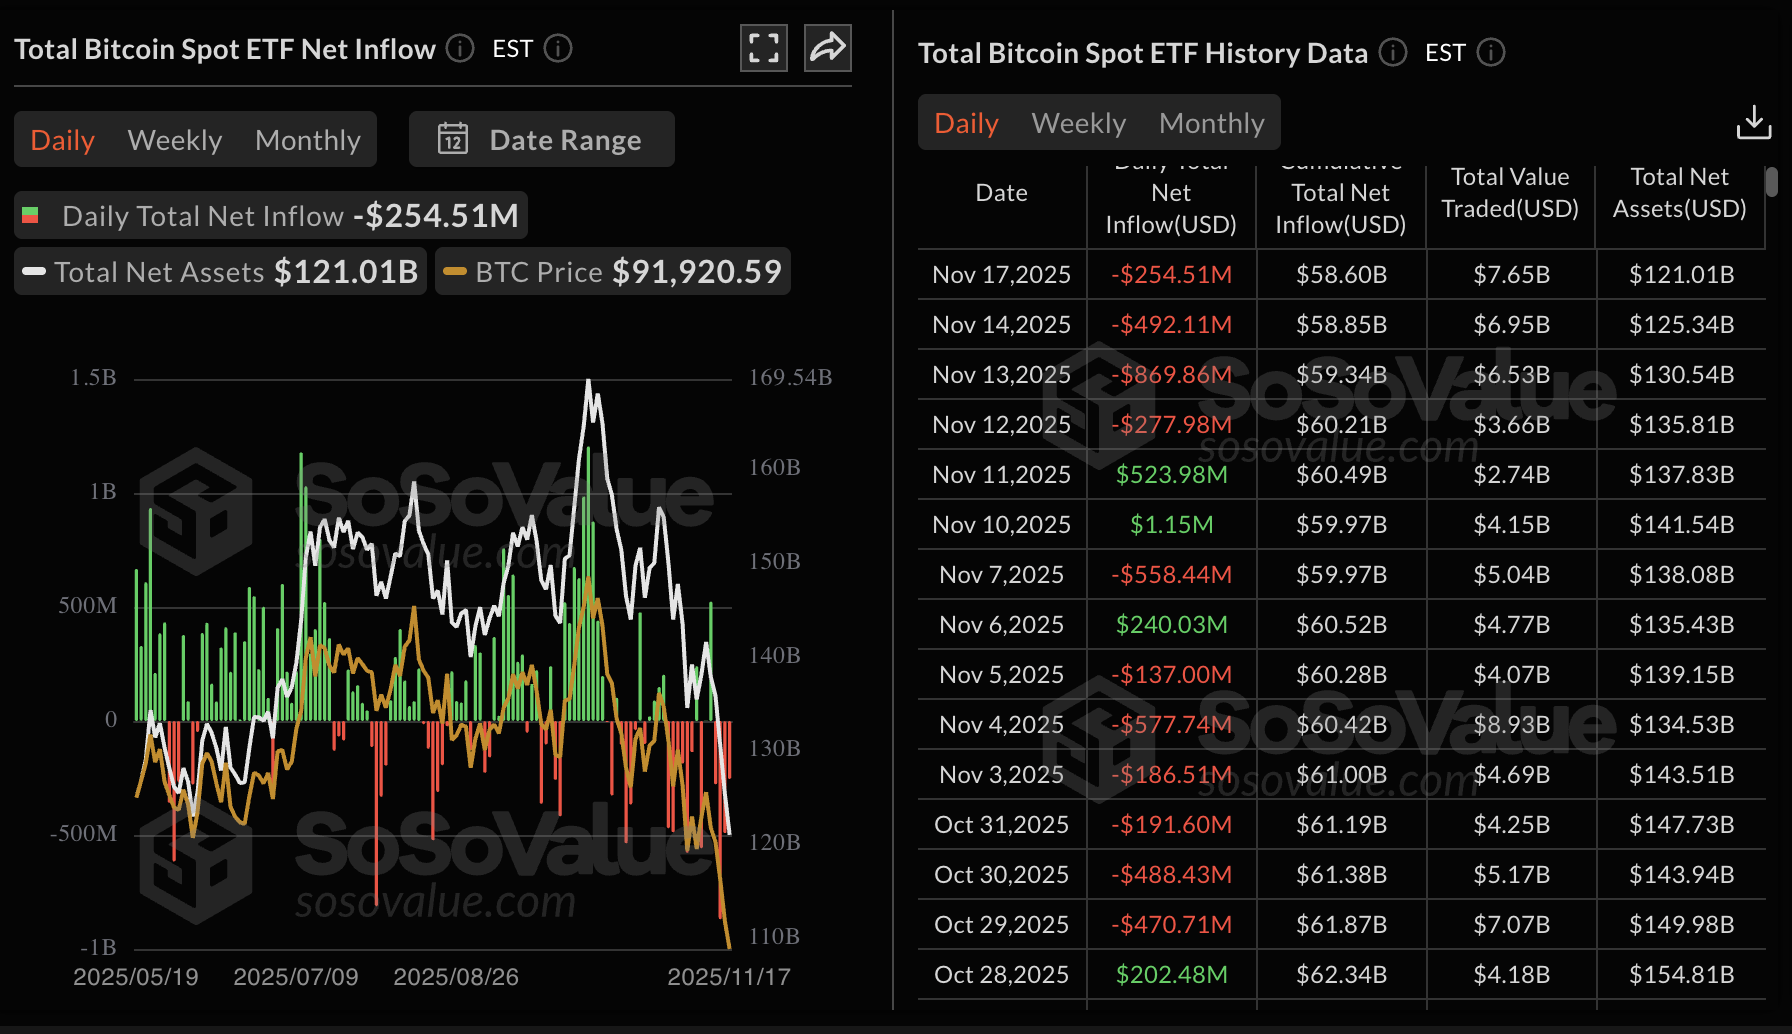
Institutional demand remains muted, as Bitcoin spot Exchange Traded Funds (ETFs) continue to experience steady outflows.
US-listed ETFs recorded approximately $255 million in outflows on Monday, extending the losses from last week and bringing the cumulative total net inflow volume to $58.6 billion and net assets to $121 billion.
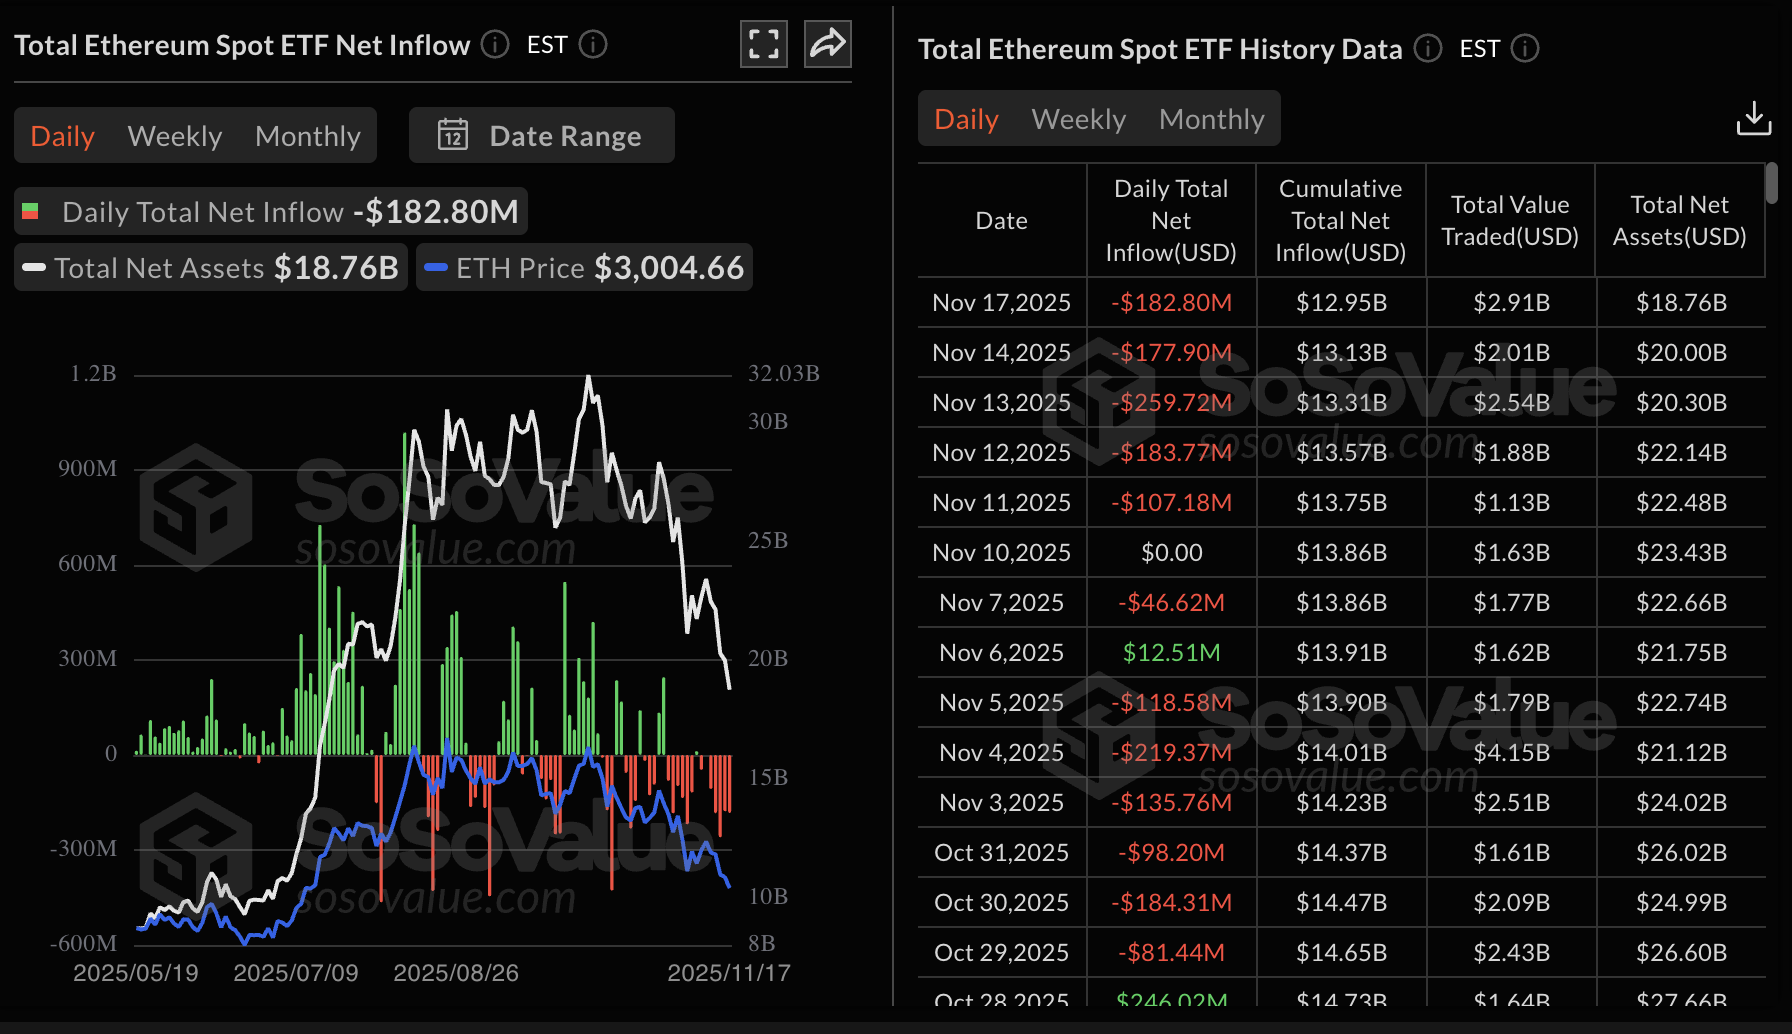
Ethereum ETFs listed in the US are also facing prolonged outflows, with nearly $183 million recorded on Monday. The last time ETH ETFs experienced inflows was on November 6.
SoSoValue data shows a cumulative inflow volume of $12.95 billion and net assets of $18.76 billion. If ETF outflows persist, sentiment will likely remain on the back foot, making it difficult for Ethereum to sustain recovery in the short to medium term.
On the other hand, XRP showcases a weak derivatives market, with futures Open Interest (OI) averaging $3.6 billion on Tuesday. Since OI represents the notional value of outstanding futures contracts, sideways movement suggests muted interest. Traders are less convinced that XRP can sustain its recovery in the short term and are reducing their risk exposure or staying on the sidelines.
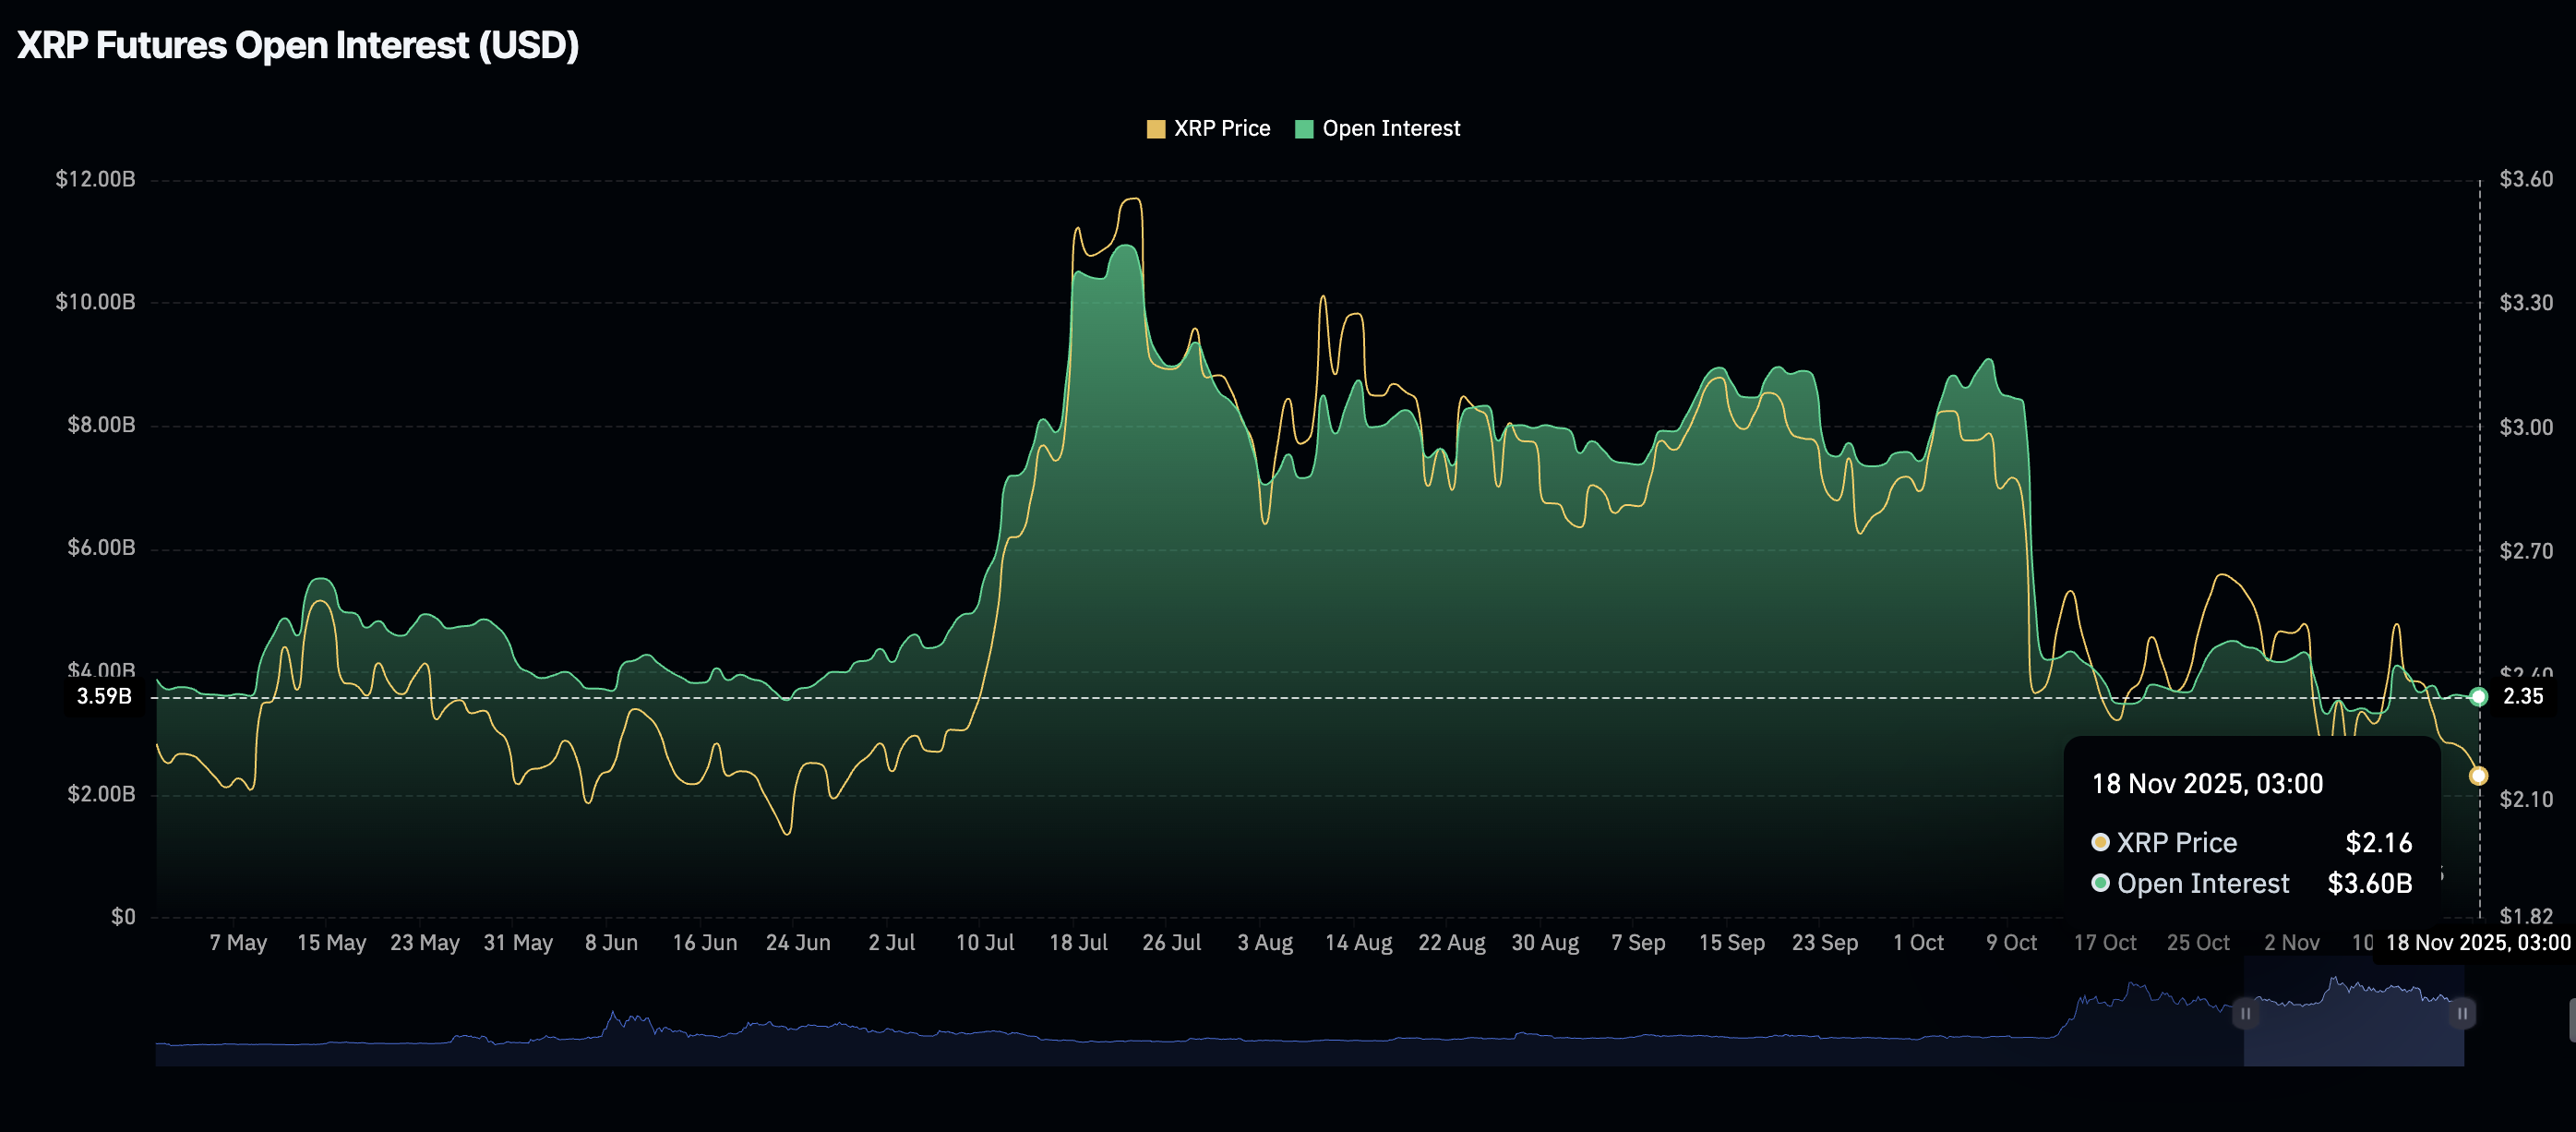
Chart of the day: Can Bitcoin bulls defend key support?
Bitcoin is trading above $91,000 at the time of writing on Monday, after rising from an intraday low of $89,253. Sellers have the upper hand, as evidenced by the 50-day Exponential Moving Average (EMA) at $106,383 crossing below the 200-day EMA at $107,134, forming a Death Cross pattern. This is a bearish pattern that reinforces negative market sentiment.
The Relative Strength Index (RSI) has entered oversold territory on the daily chart, holding at 27 as bearish pressure escalates. A sell signal from the Moving Average Convergence Divergence (MACD) indicator triggered on November 3 is encouraging investors to reduce their risk exposure, further contributing to selling pressure.
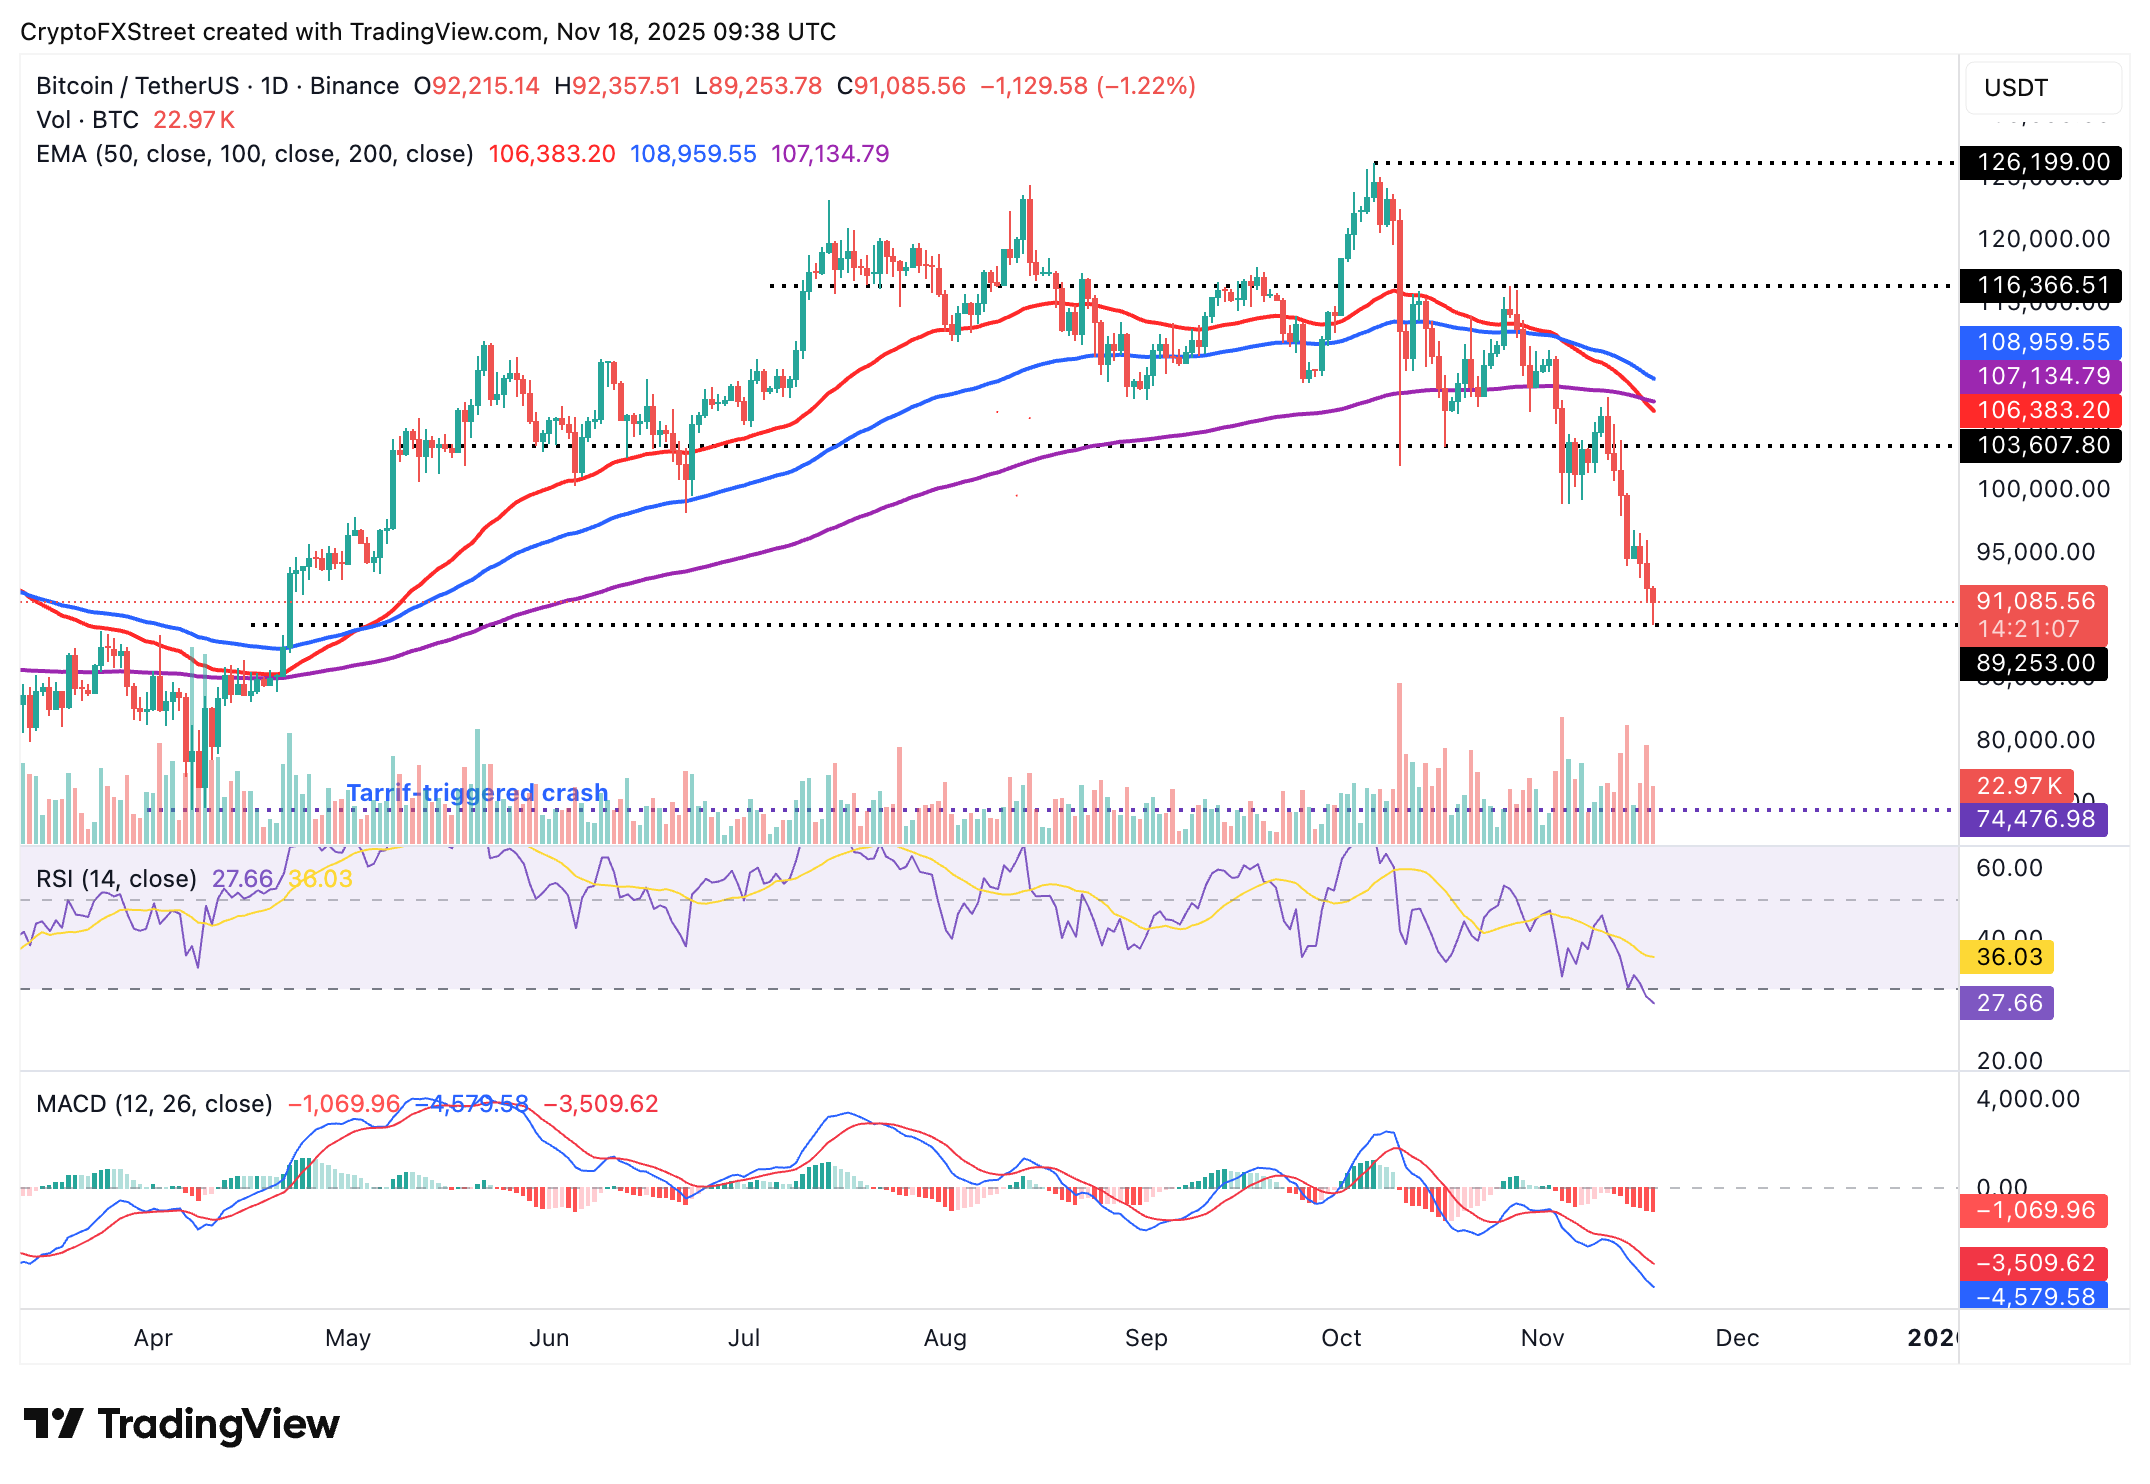
Bitcoin must confirm a daily close above $90,000 to stabilize from the recent declines ahead of a potential upswing eyeing $100,000. Still, Bitcoin could extend its down leg toward $80,000 if risk-off sentiment persists.
Altcoins update: Ethereum, XRP struggle to recover amid market weakness
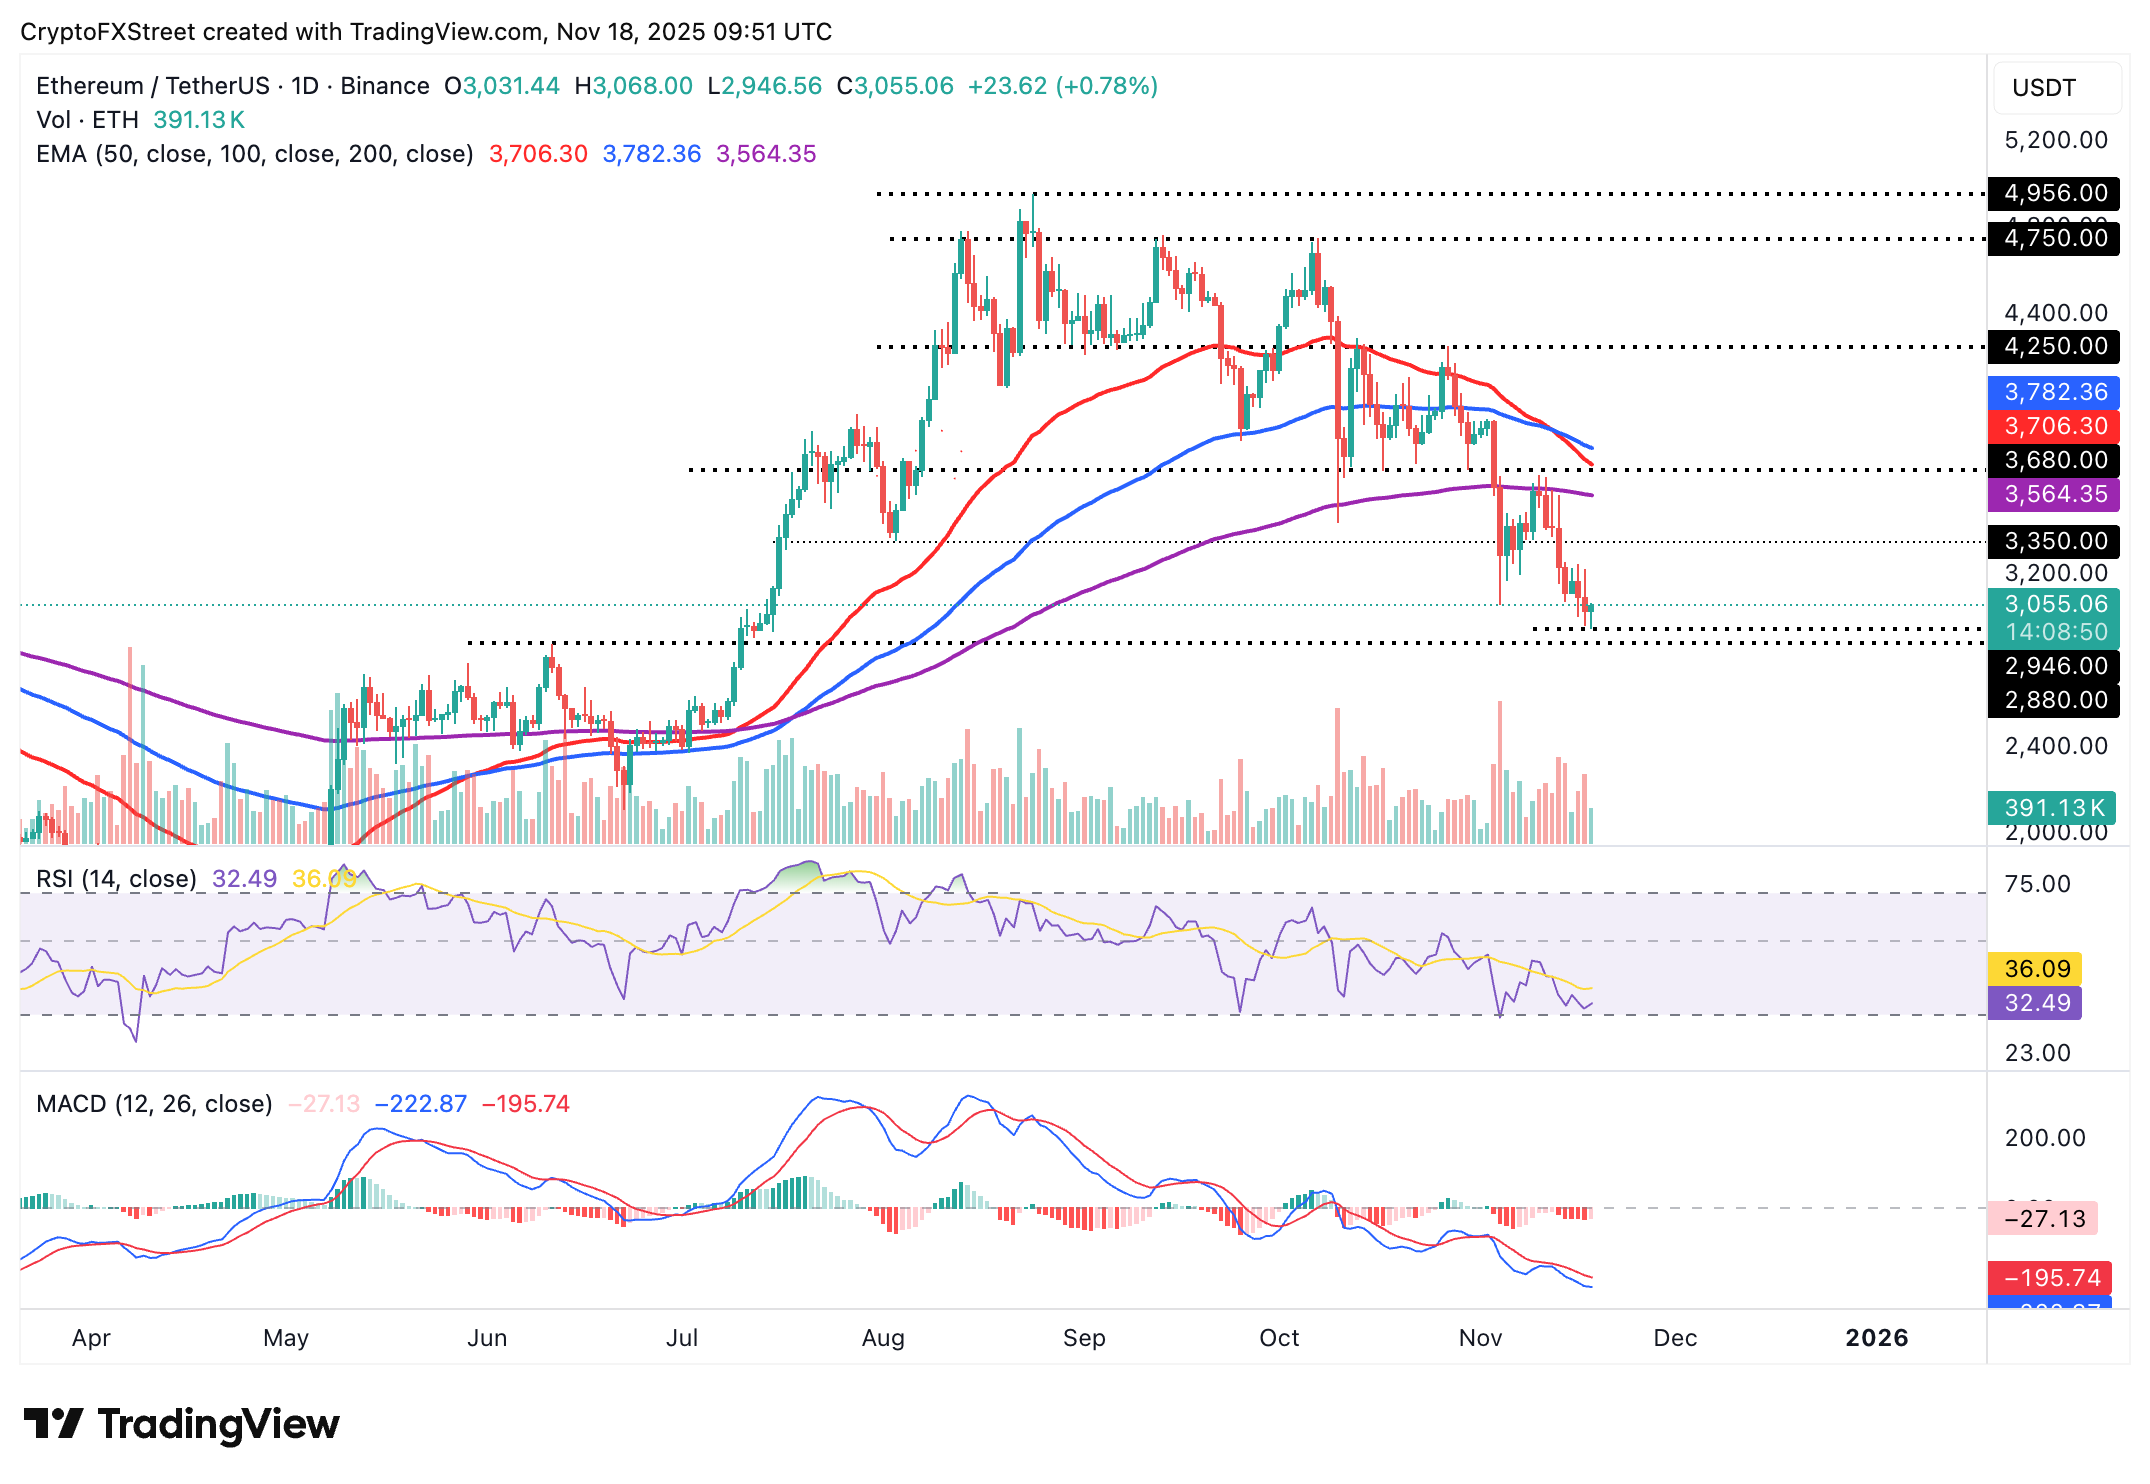
Ethereum is holding above $3,000 following a minor recovery from an intraday low of $2,946. The RSI remains near the oversold region on the daily chart, suggesting bearish pressure persists despite the mild recovery.
A sell signal from the MACD indicator since November 3 reinforces the bearish grip, encouraging investors to reduce their exposure.
Ethereum also sits below key moving averages, including the 50-day EMA at $3,706, the 100-day EMA at $3,782 and the 200-day EMA $3,564, all of which highlight a strong bearish inclination.
If the downtrend extends below the intraday low at $2,946, the next support level is at $2,880, which was tested as resistance in June. Looking up, a daily close above $3,000 may usher in the next recovery phase toward the 200-day EMA.
The cross-border remittance token XRP is attempting recovery after testing an intraday support at $2.10 on Tuesday, but fading investor confidence and low retail activity since the October 10 flash crash weigh on the token.
The RSI on the daily chart is broadly steady at 39. Crossing above the midline would increase the odds of a short-term uptrend.
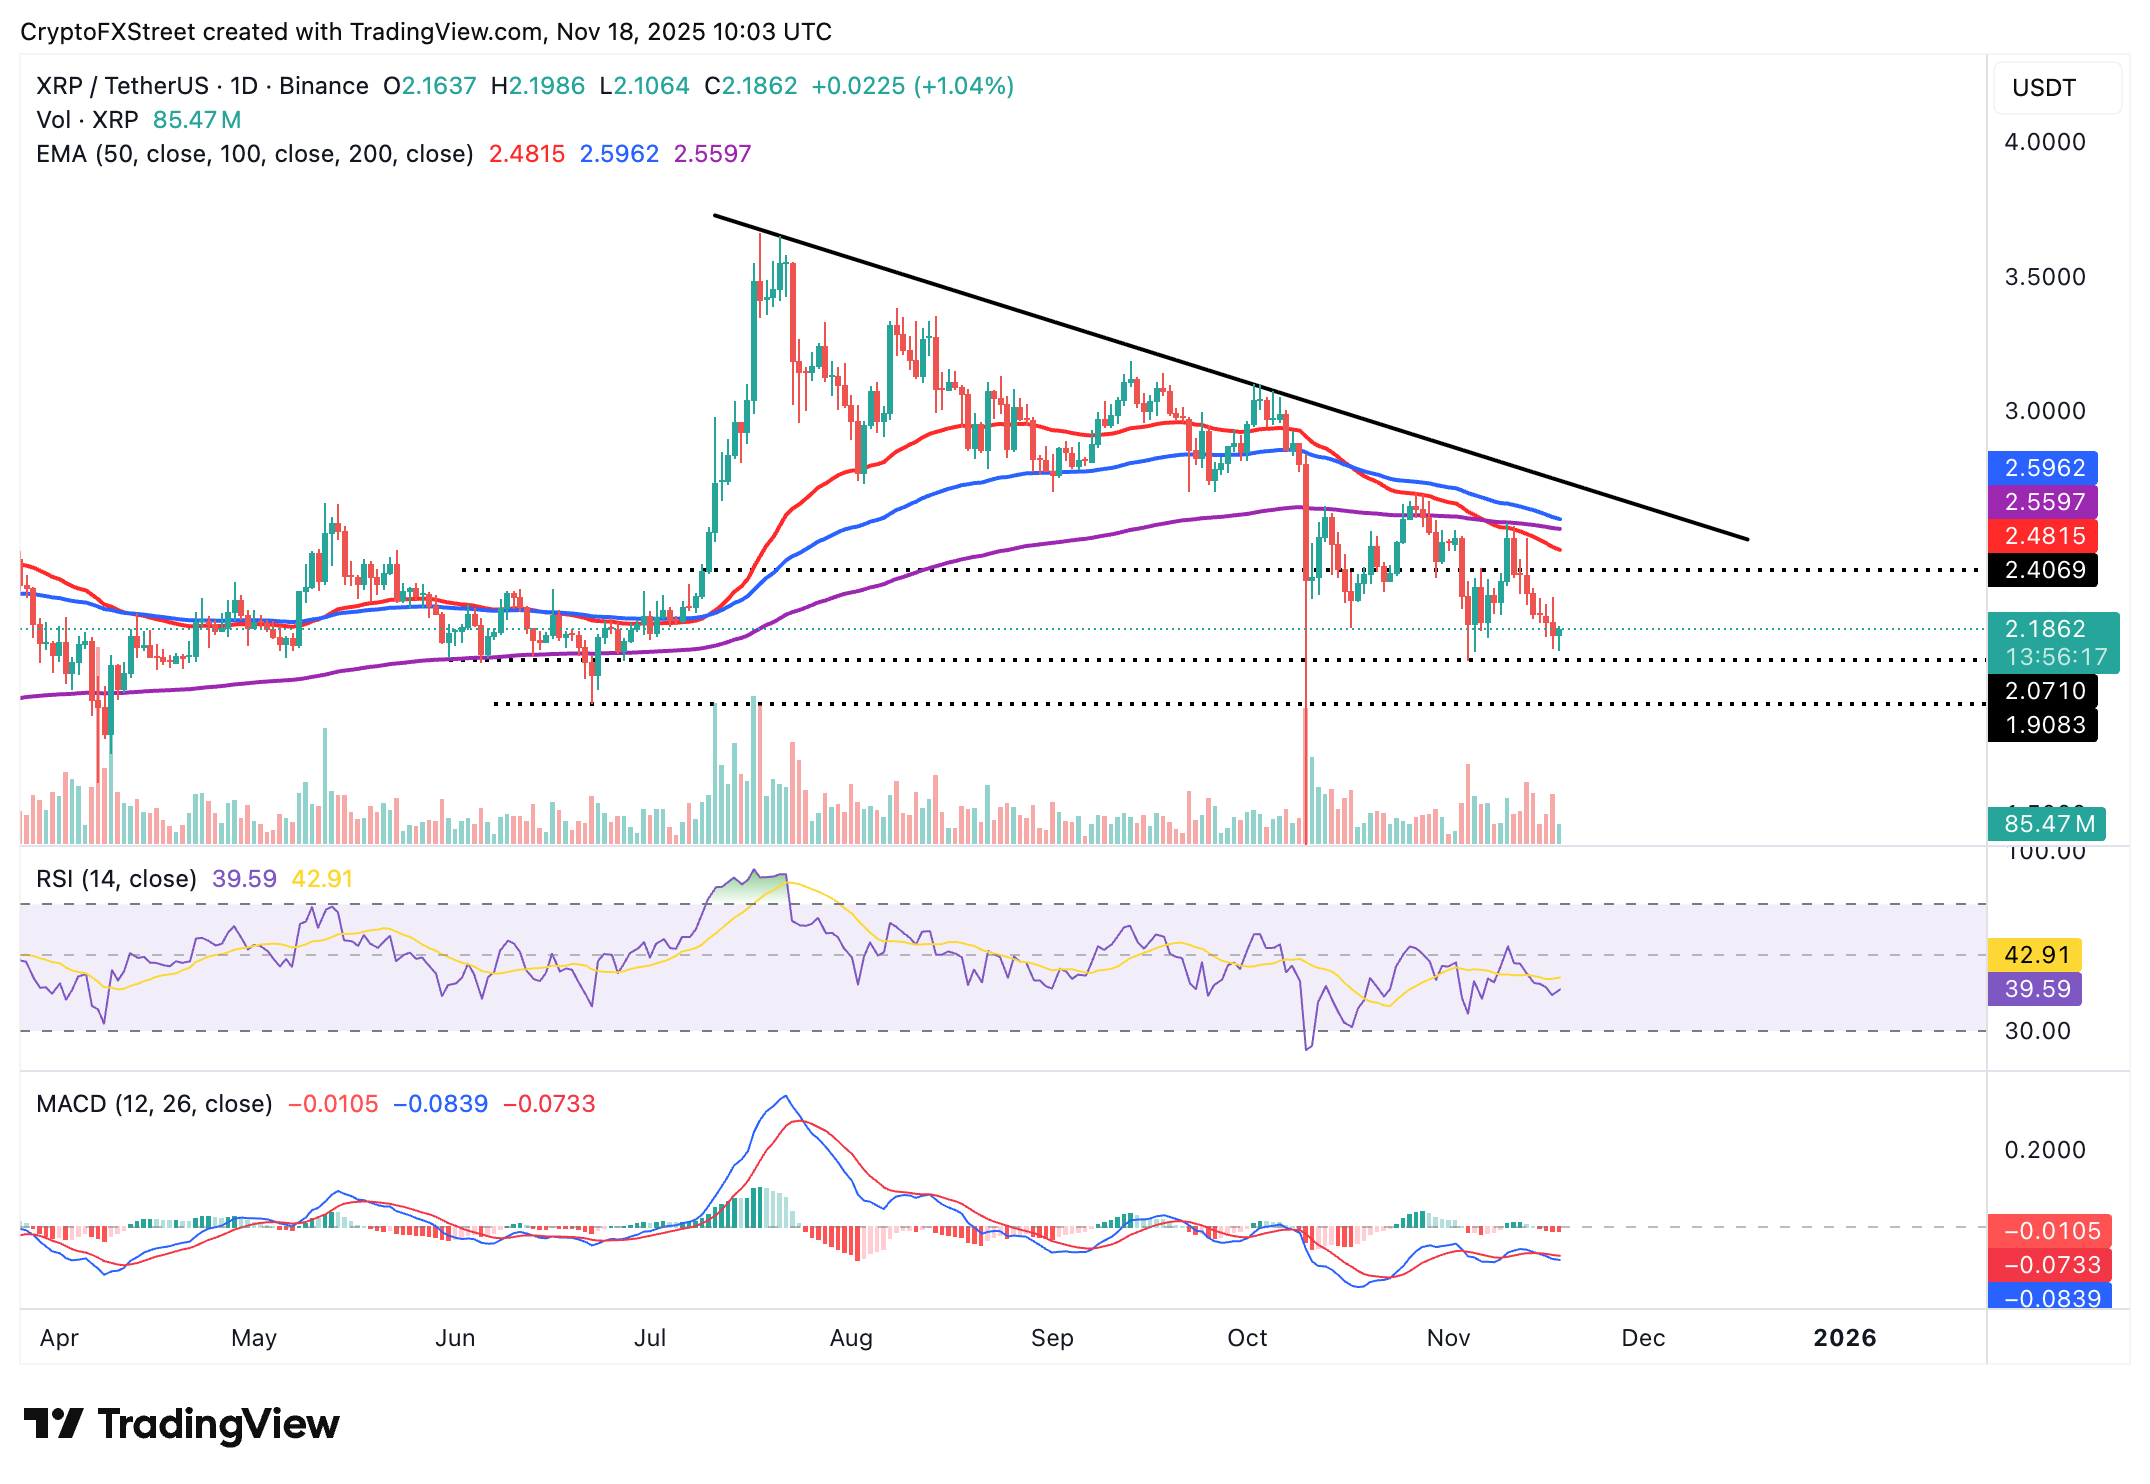
Key milestones to look forward to include a break above $2.40, a resistance level tested on November 6, the 50-day EMA at $2.48, the 200-day EMA at $2.55, and the 100-day EMA at $2.59.
Still, early profit-booking, macroeconomic uncertainty and a sticky bearish sentiment could result in another sweep of $2.07, a support level tested on November 4, and $1.90, which was tested on June 22.
Bitcoin, altcoins, stablecoins FAQs
Bitcoin is the largest cryptocurrency by market capitalization, a virtual currency designed to serve as money. This form of payment cannot be controlled by any one person, group, or entity, which eliminates the need for third-party participation during financial transactions.
Altcoins are any cryptocurrency apart from Bitcoin, but some also regard Ethereum as a non-altcoin because it is from these two cryptocurrencies that forking happens. If this is true, then Litecoin is the first altcoin, forked from the Bitcoin protocol and, therefore, an “improved” version of it.
Stablecoins are cryptocurrencies designed to have a stable price, with their value backed by a reserve of the asset it represents. To achieve this, the value of any one stablecoin is pegged to a commodity or financial instrument, such as the US Dollar (USD), with its supply regulated by an algorithm or demand. The main goal of stablecoins is to provide an on/off-ramp for investors willing to trade and invest in cryptocurrencies. Stablecoins also allow investors to store value since cryptocurrencies, in general, are subject to volatility.
Bitcoin dominance is the ratio of Bitcoin's market capitalization to the total market capitalization of all cryptocurrencies combined. It provides a clear picture of Bitcoin’s interest among investors. A high BTC dominance typically happens before and during a bull run, in which investors resort to investing in relatively stable and high market capitalization cryptocurrency like Bitcoin. A drop in BTC dominance usually means that investors are moving their capital and/or profits to altcoins in a quest for higher returns, which usually triggers an explosion of altcoin rallies.
추천 기사


