

Crypto Today: Bitcoin, Ethereum, XRP recovery stalls amid low institutional and retail demand
- Bitcoin trades above $105,000, pinned down by overhead pressure, low ETF inflows, and weak retail demand.
- Ethereum remains below the 200-day EMA as traders increasingly pile into short positions.
- XRP derivatives market gains momentum as futures Open Interest rises above $4 billion.
Bitcoin (BTC) is trading above $105,000 at the time of writing on Tuesday, after giving back part of the gains accrued the previous day. Altcoins, including Ethereum (ETH) and Ripple (XRP), are also cooling down, reflecting possible profit-taking and risk-off sentiment.
Institutional and retail demand remain largely suppressed, meaning investors are not convinced the trend has shifted from bearish to bullish. Some key technical indicators also lean bearishly, suggesting traders reduce exposure or stay on the sidelines, at least in the short term.
Data spotlight: BTC, ETH, XRP face low institutional demand, retail interest
Institutional demand for Bitcoin has taken a back foot over the last two weeks, as investors navigate macroeconomic uncertainty worsened by the record-breaking United States (US) government shutdown.
Persistent outflows from Bitcoin spot Exchange Traded Funds (ETFs) highlight the lack of interest in related digital asset investment products. According to SoSo value data, ETF inflows were at $1.15 million on Monday.
The last two weeks have been characterised by outflows of $1.22 billion and $799 million, respectively. Meanwhile, the cumulative total net inflow volume averages $59.97 billion with net assets at $141.54 billion on November 10.

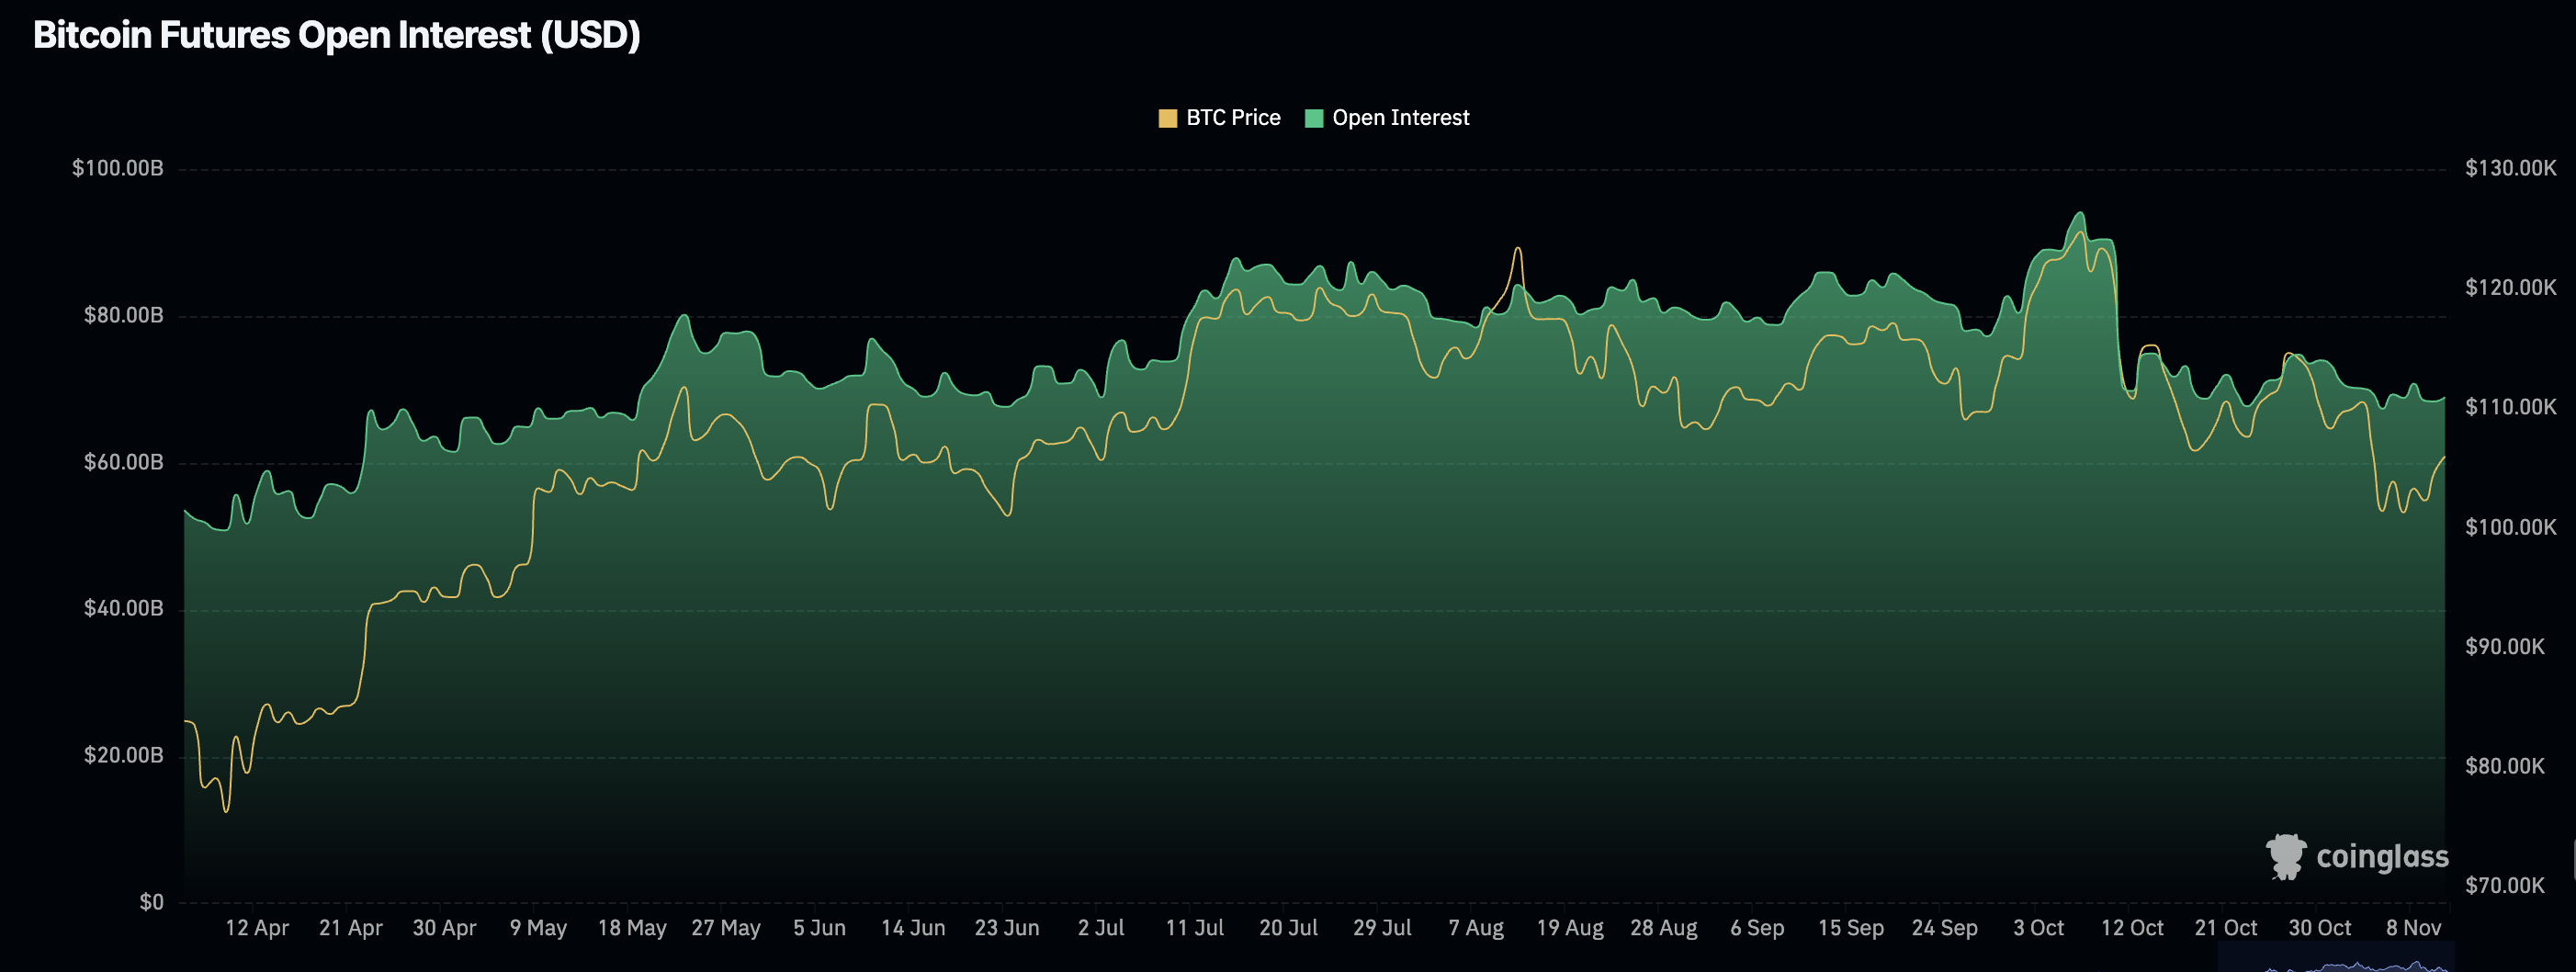
Retail demand has also not picked up following the October 10 deleveraging event, which saw over $19 billion in crypto assets liquidated in a single day. The Bitcoin futures Open Interest is at $68.37 billion at the time of writing, down from $71 on November 1 and $94.12 billion, the October peak.
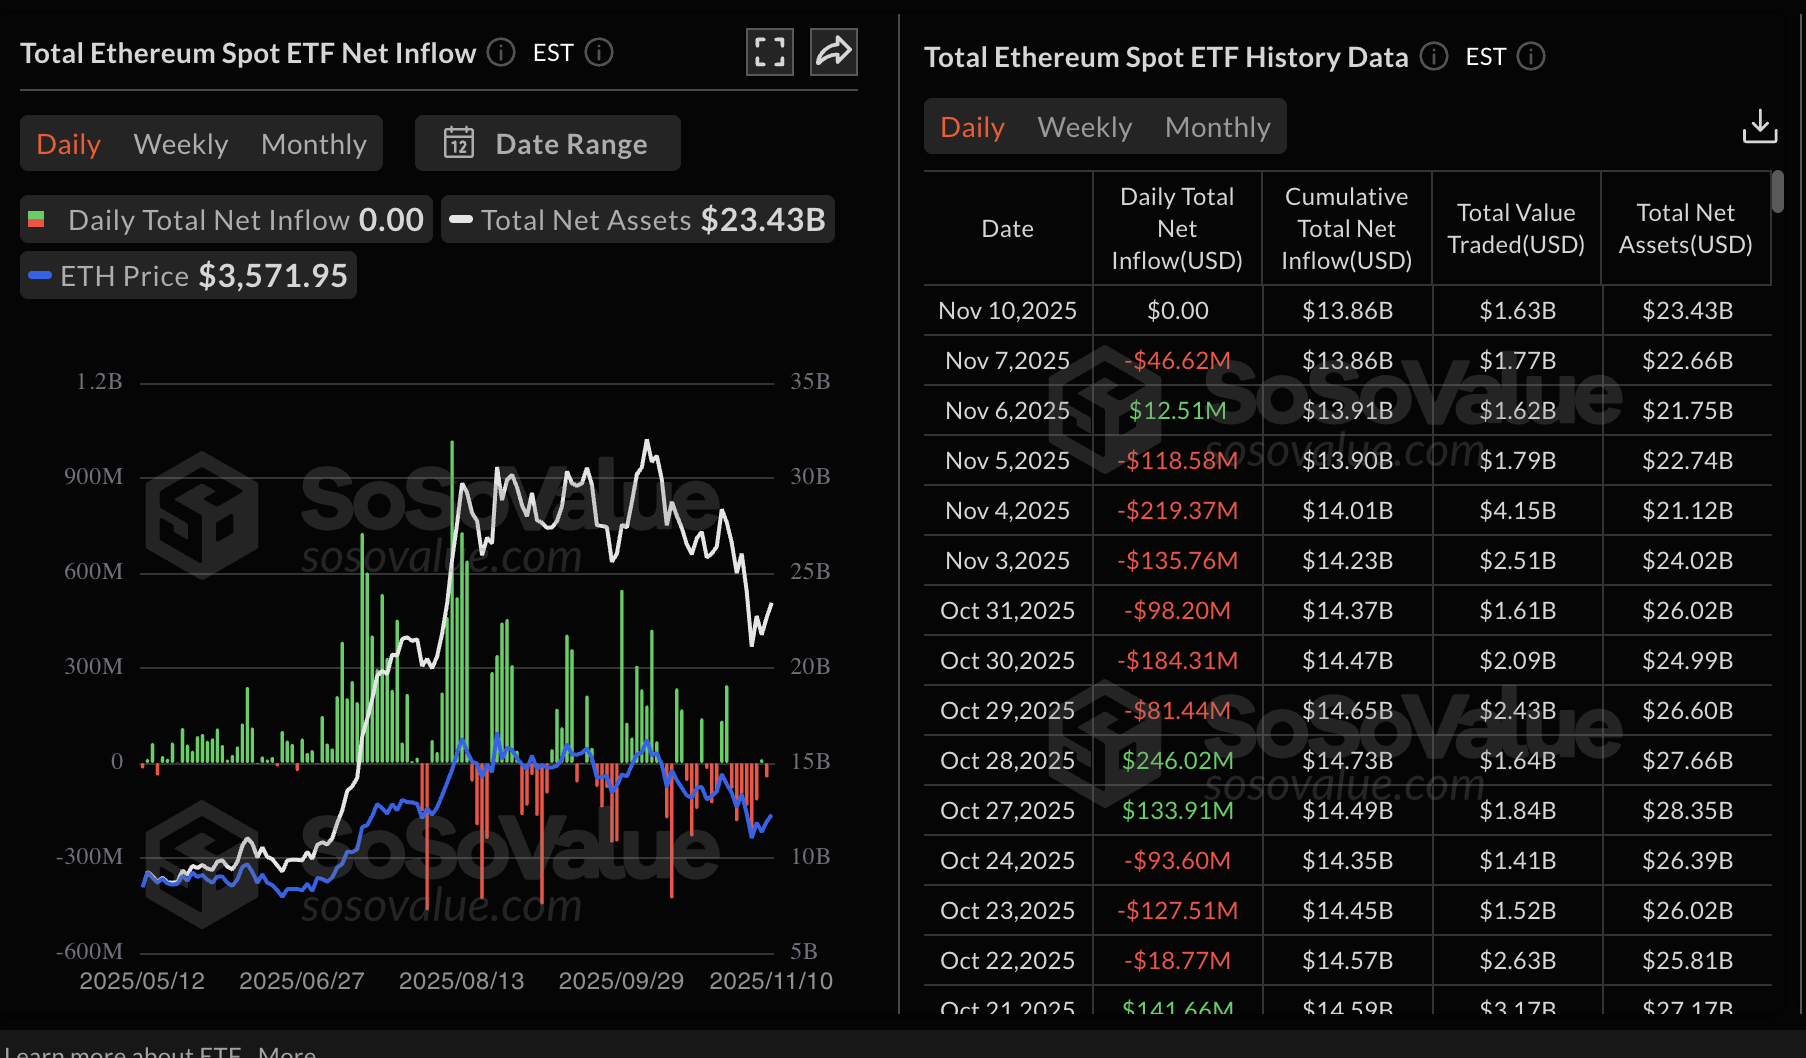
Ethereum ETFs recorded zero net flows on Monday, leaving the cumulative total net inflow at $13.86 billion and net assets at $23.43 billion.
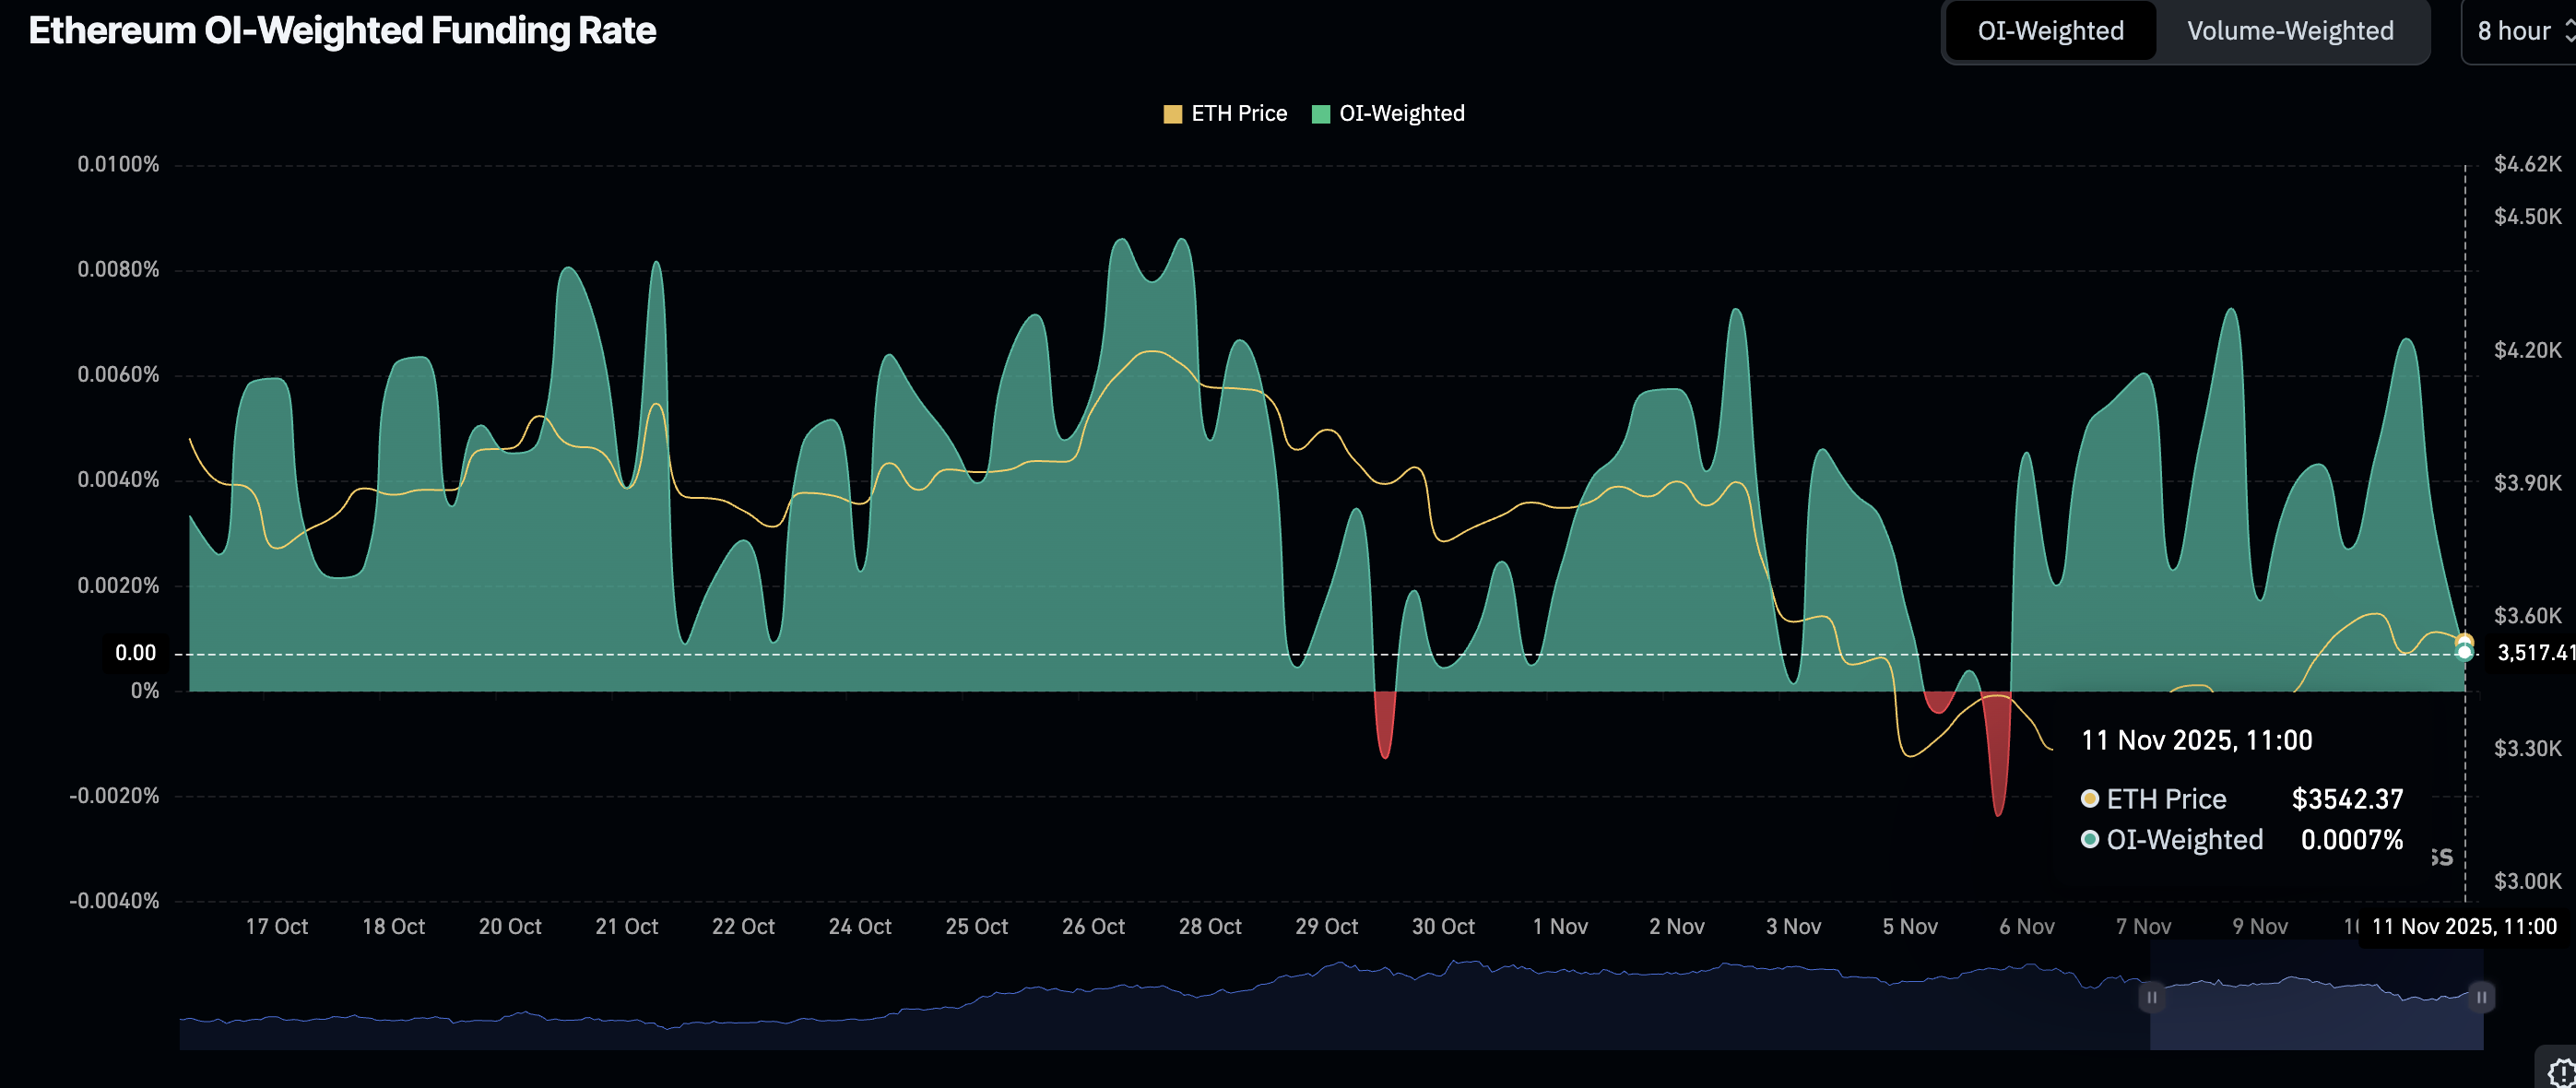
Meanwhile, traders are piling into short positions, as evidenced by the OI-Weighted Funding Rate metric falling to 0.0007% on Tuesday, from 0.0067% the previous day.
XRP, unlike Bitcoin and Ethereum, has experienced a turnaround in retail demand, with the OI rising to $4.11 billion on Tuesday from $3.36 on Monday. The increase coincided with the price rising to a weekly high of $2.58, highlighting the role retail traders play in pushing prices higher.
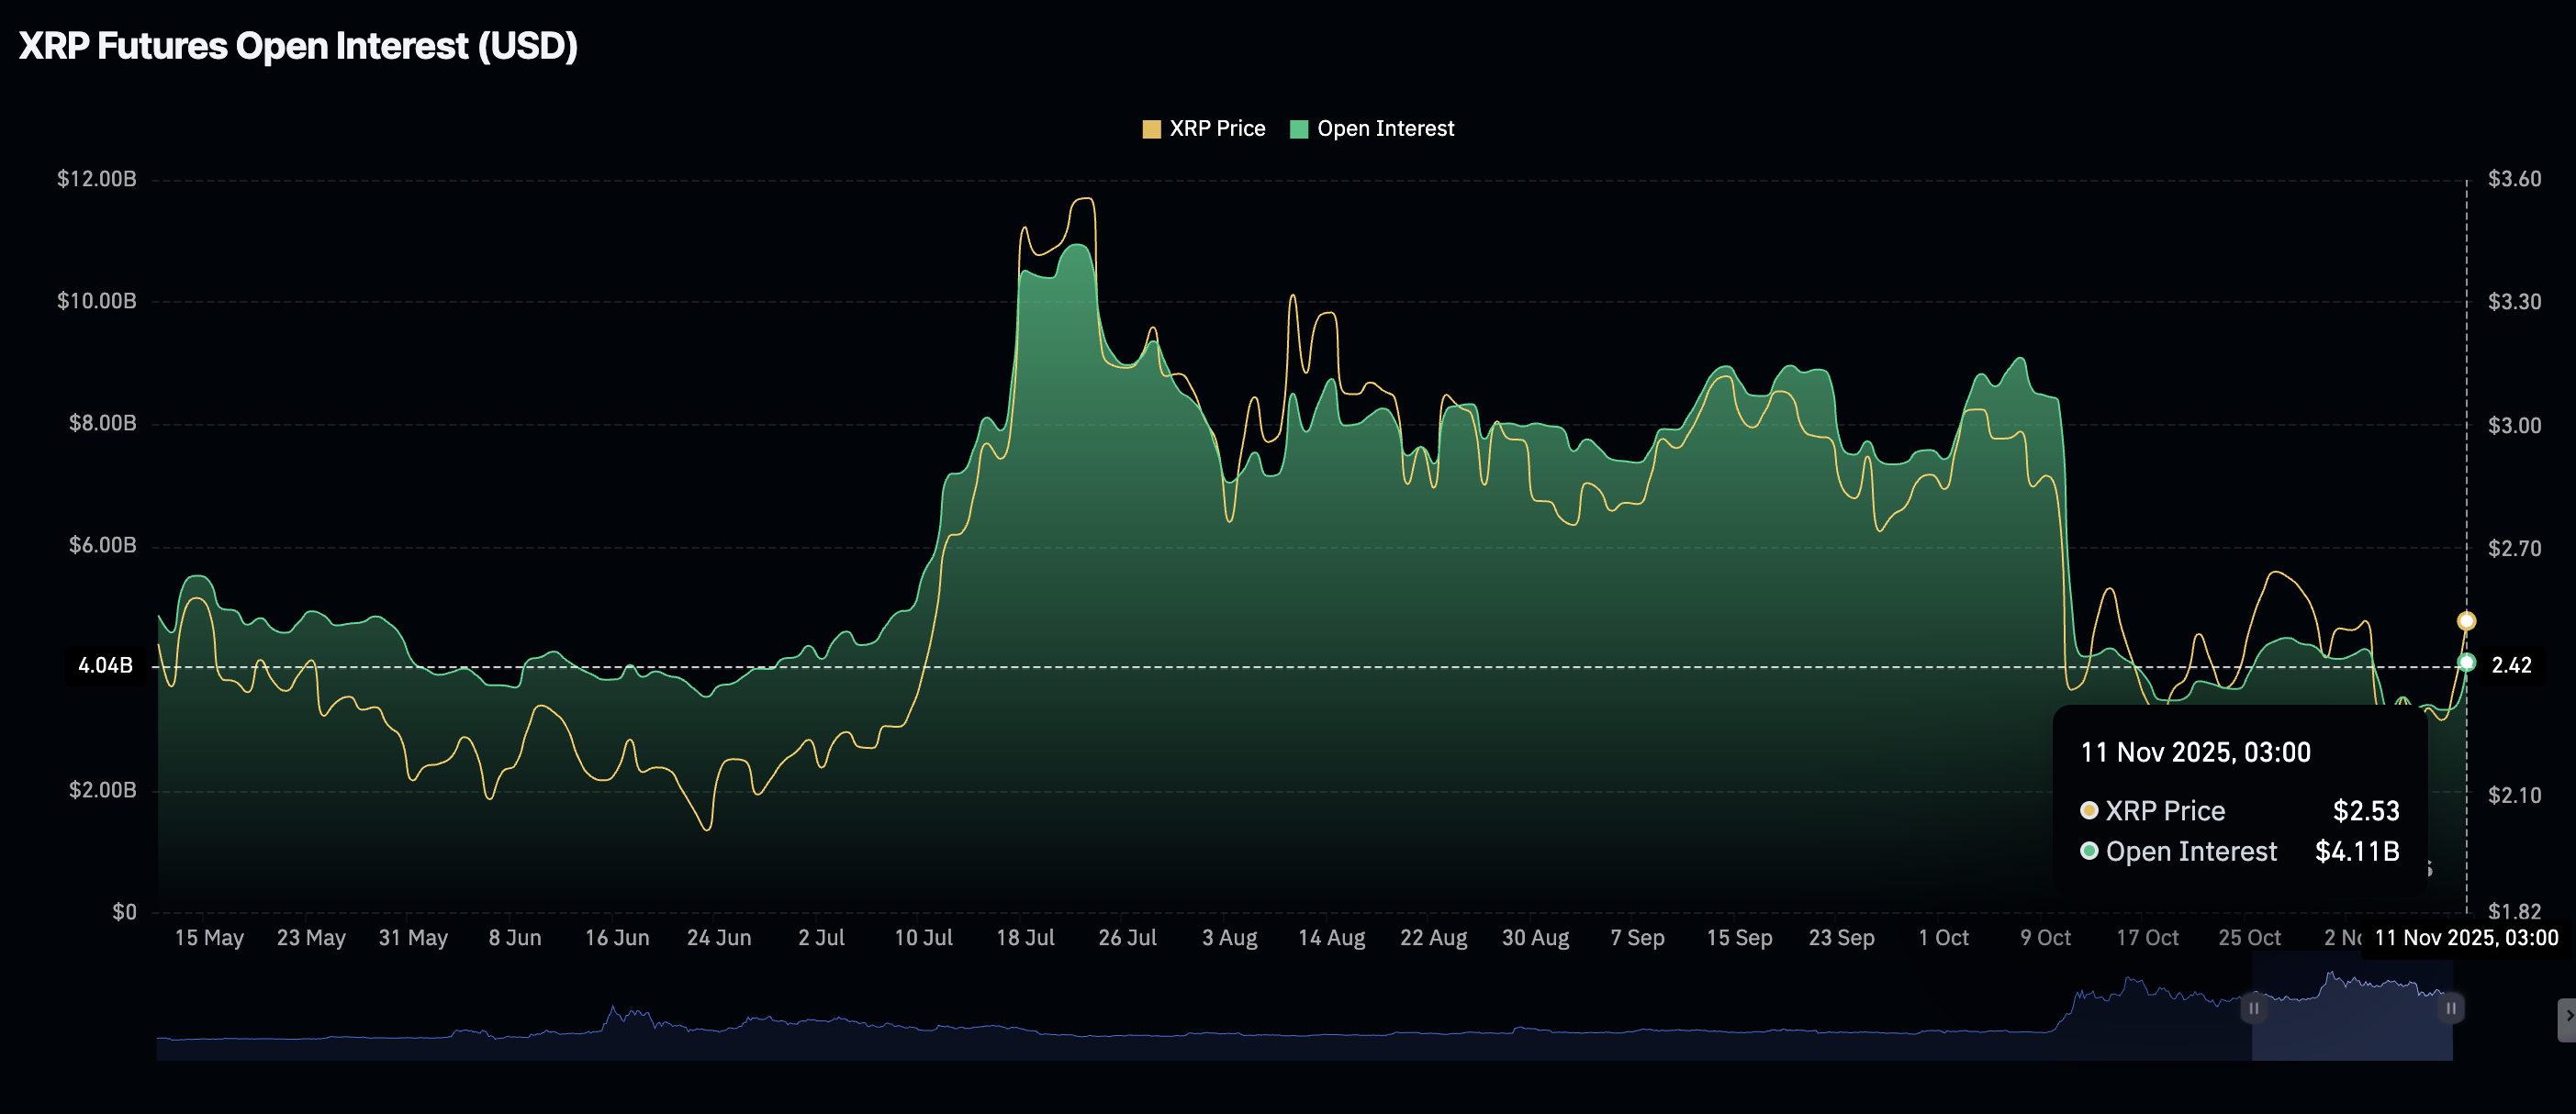
Chart of the day: Bitcoin holds key support
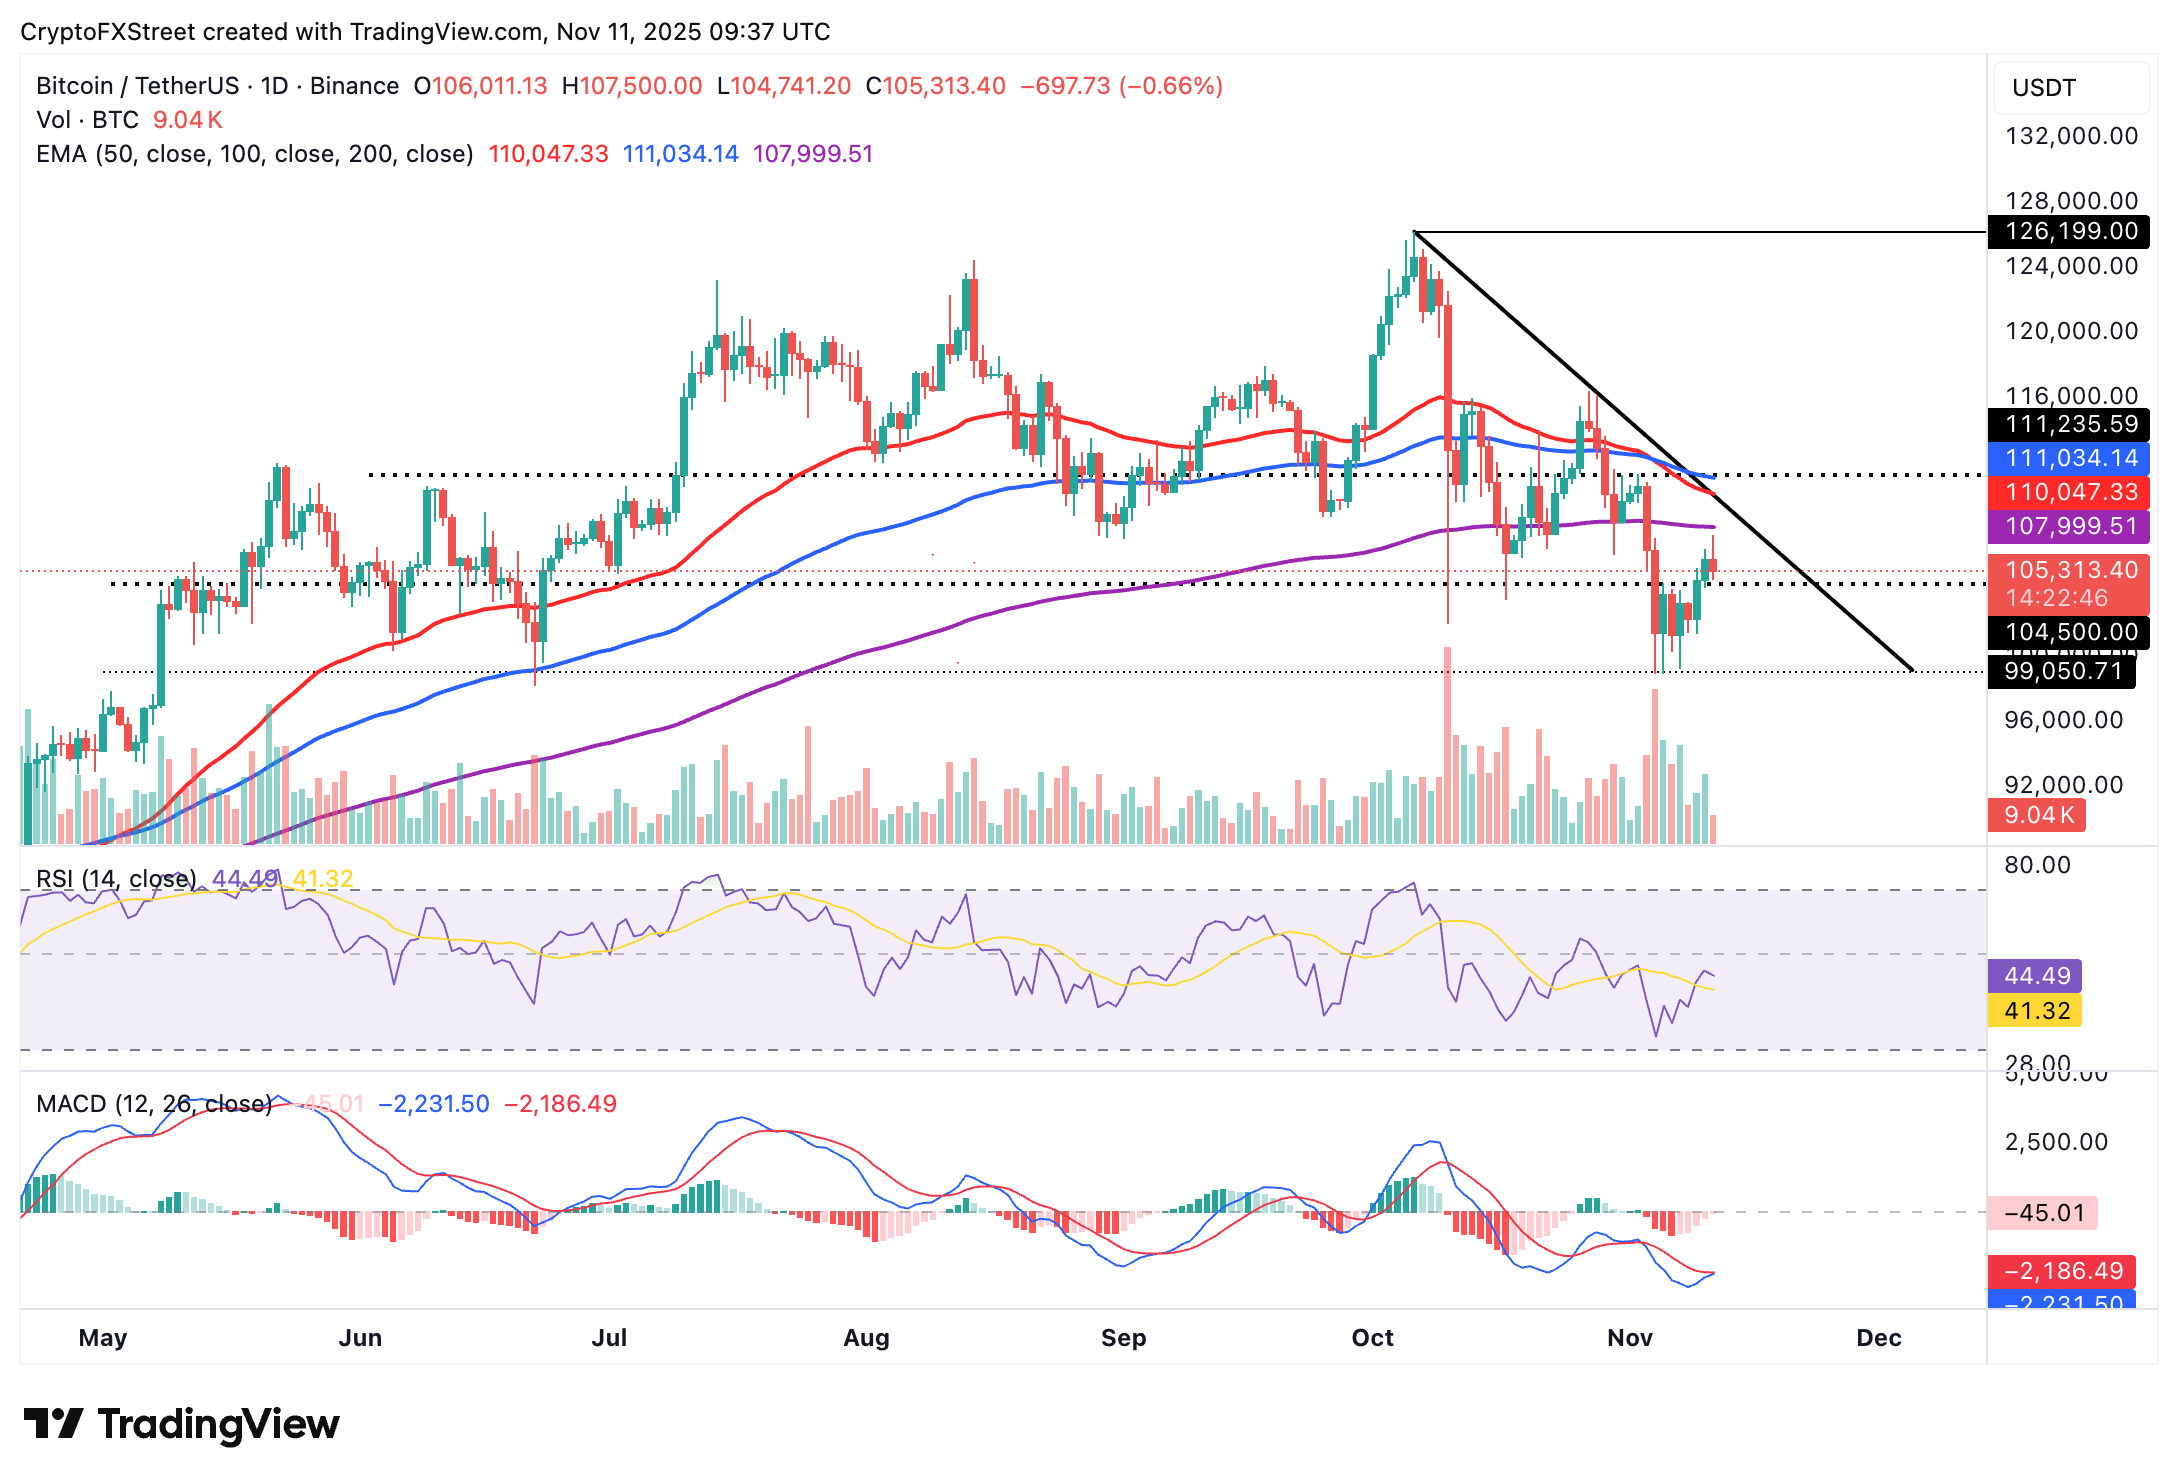
Bitcoin is trading above $105,000 at the time of writing after its two-day uptrend stalled at around $107,450. Both bulls and bears are battling to take control, as reflected by key technical indicators on the daily chart.
The Moving Average Convergence Divergence (MACD) momentum indicator is poised to trigger a buy signal if the blue line crosses above the red line. Traders will watch for green histogram bars above the mean line to ascertain that bullish momentum is increasing.
A break above the 200-day Exponential Moving Average (EMA) at $107,999 would validate BTC's short-term bullish outlook toward the round-number resistance at $110,000.
Still, traders must be cautiously optimistic, particularly with the Relative Strength Index (RSI) at 44 and declining. Lower RSI readings indicate easing bullish momentum and increase the odds of a correction toward $100,000.
Altcoins update: Ethereum, XRP offer mixed signals
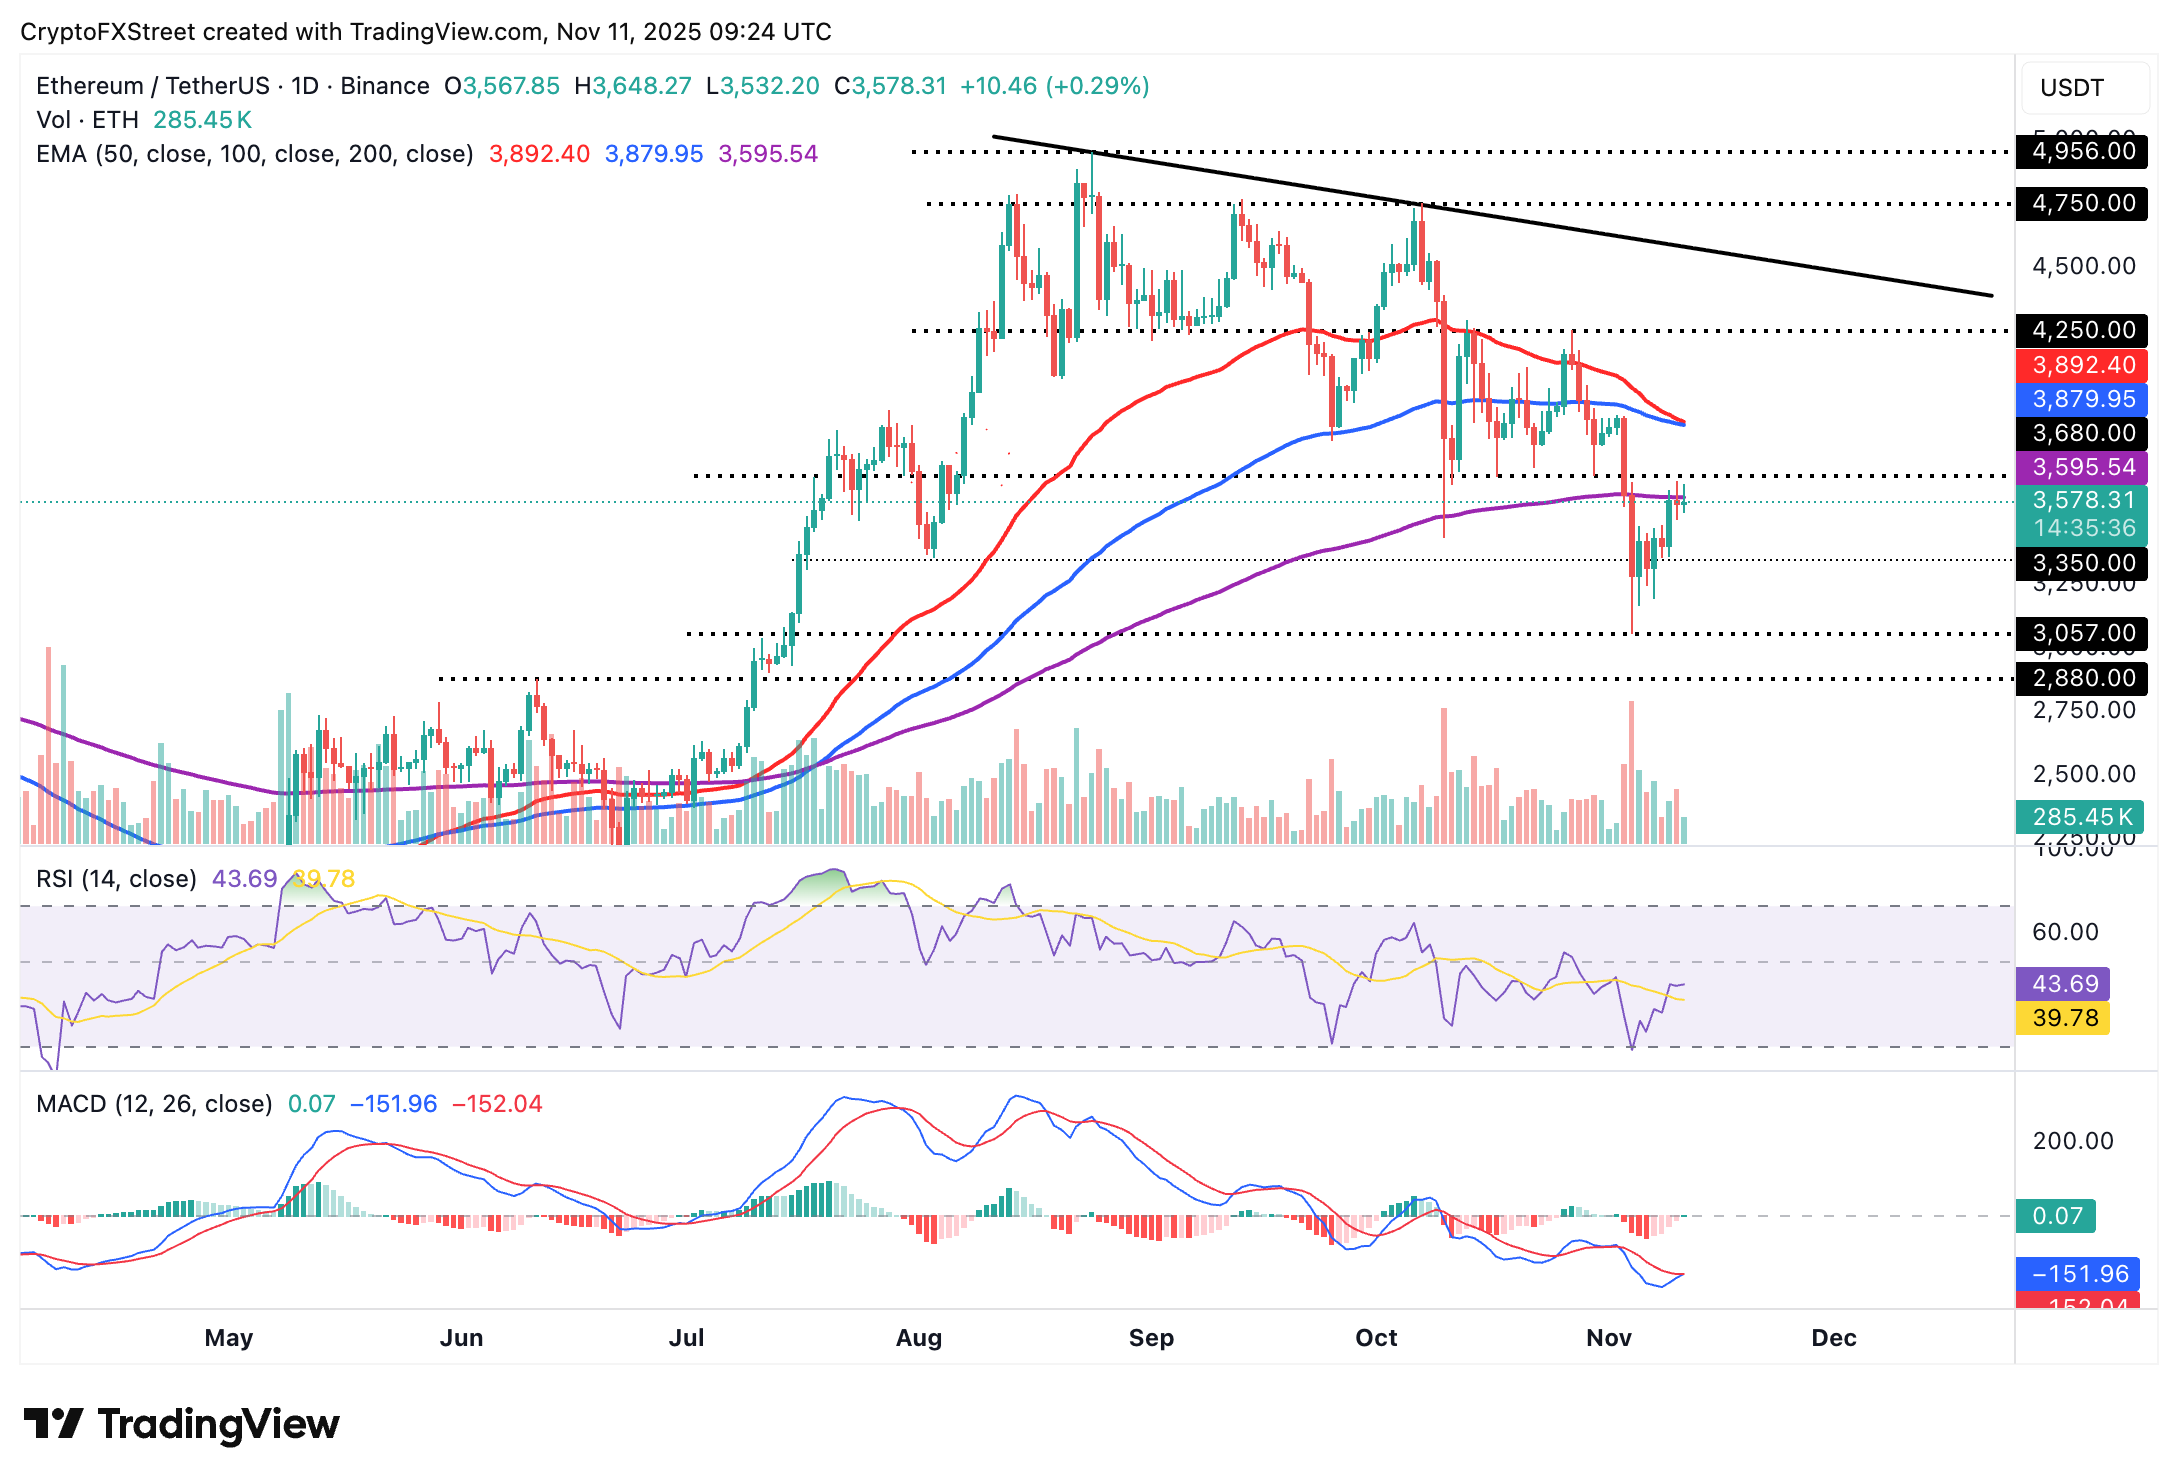
Ethereum is trading below the 200-day EMA at $3,595 at the time of writing on Tuesday, weighed down by potential profit-taking and reduced risk-on sentiment following Monday's upswing to highs around $3,656.
The RSI at 43 looks aimed for a steady advance on the daily chart, indicating that bullish momentum is cooling. If it declines, Ethereum may extend its down leg toward the next support at $3,350, which was last tested on Sunday.
Conversely, the MACD is poised to flash a buy signal on the same chart if the blue line crosses and settles above the red line and the indicator generally rises. A buy signal would encourage bulls to seek exposure, further tailwinding a breakout above the 200-day EMA at $3,695.
As for XRP, the price is edging lower, down nearly 3% at the time of writing to $2.45. The cross-border remittance token is also trading below key moving averages, including the 50-day EMA at $2.56, the 200-day EMA at $2.58, and the 100-day EMA at $2.64, all of which are acting as resistance levels.
The RSI is at 49 amid a retreat from Monday's 52 high. This suggests easing bullish momentum, which may limit the anticipated uptrend toward $3.00 in the short to medium term.
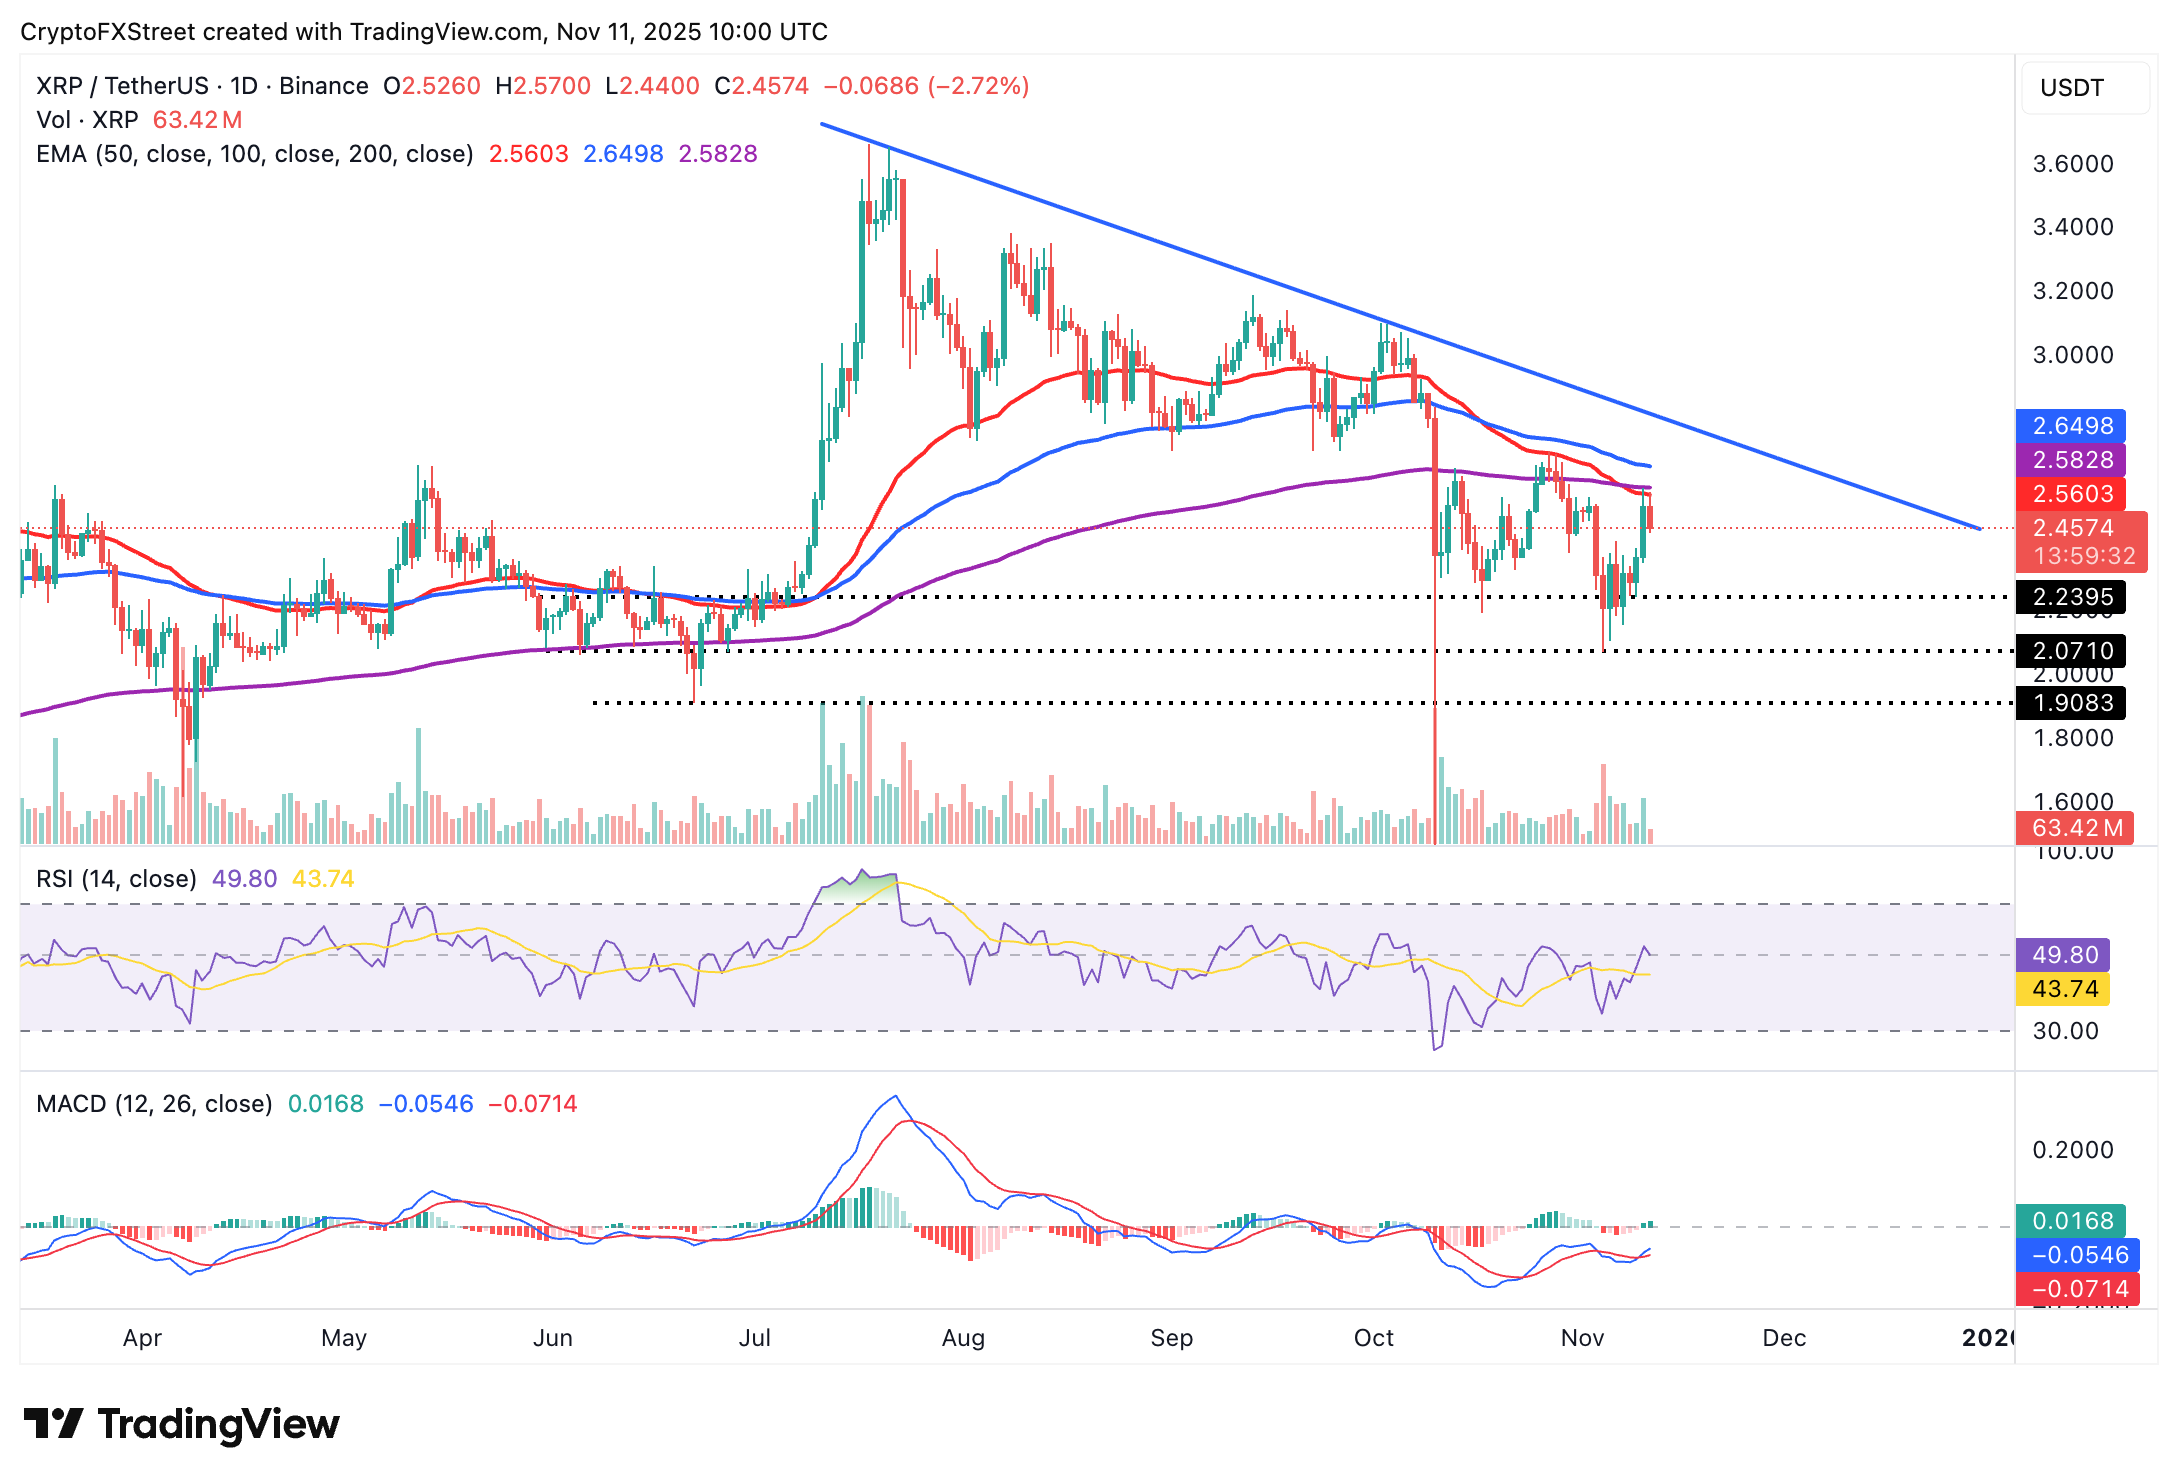
The MACD had maintained a buy signal since Monday, calling upon investors to increase their risk exposure. However, XRP must step above the 50-day and 200-day EMAs to uphold the short-term bullish outlook.
Crypto ETF FAQs
An Exchange-Traded Fund (ETF) is an investment vehicle or an index that tracks the price of an underlying asset. ETFs can not only track a single asset, but a group of assets and sectors. For example, a Bitcoin ETF tracks Bitcoin’s price. ETF is a tool used by investors to gain exposure to a certain asset.
Yes. The first Bitcoin futures ETF in the US was approved by the US Securities & Exchange Commission in October 2021. A total of seven Bitcoin futures ETFs have been approved, with more than 20 still waiting for the regulator’s permission. The SEC says that the cryptocurrency industry is new and subject to manipulation, which is why it has been delaying crypto-related futures ETFs for the last few years.
Yes. The SEC approved in January 2024 the listing and trading of several Bitcoin spot Exchange-Traded Funds, opening the door to institutional capital and mainstream investors to trade the main crypto currency. The decision was hailed by the industry as a game changer.
The main advantage of crypto ETFs is the possibility of gaining exposure to a cryptocurrency without ownership, reducing the risk and cost of holding the asset. Other pros are a lower learning curve and higher security for investors since ETFs take charge of securing the underlying asset holdings. As for the main drawbacks, the main one is that as an investor you can’t have direct ownership of the asset, or, as they say in crypto, “not your keys, not your coins.” Other disadvantages are higher costs associated with holding crypto since ETFs charge fees for active management. Finally, even though investing in ETFs reduces the risk of holding an asset, price swings in the underlying cryptocurrency are likely to be reflected in the investment vehicle too.
추천 기사


