

Crypto Today: Bitcoin, Ethereum, XRP recovery stalls as risk-off sentiment persists
- Bitcoin holds above $103,000, weighed down by ETF outflows and a weak technical outlook.
- Ethereum's downside risks prevail amid steady ETF outflows and low retail demand.
- XRP wobbles ahead of a Death Cross pattern confirmation.
Bitcoin (BTC) is trading below $103,000 at the time of writing on Thursday, amid cautious sentiment in the broader cryptocurrency market. Demand from institutional investors has diminished since late October amid persistent outflows from Exchange Traded Funds (ETFs), suppressing recovery attempts in BTC's price. Altcoins, including Ethereum (ETH) and Ripple (XRP), are trading under pressure, following in Bitcoin's footsteps.
Data spotlight: BTC, ETH, XRP offer bearish signals
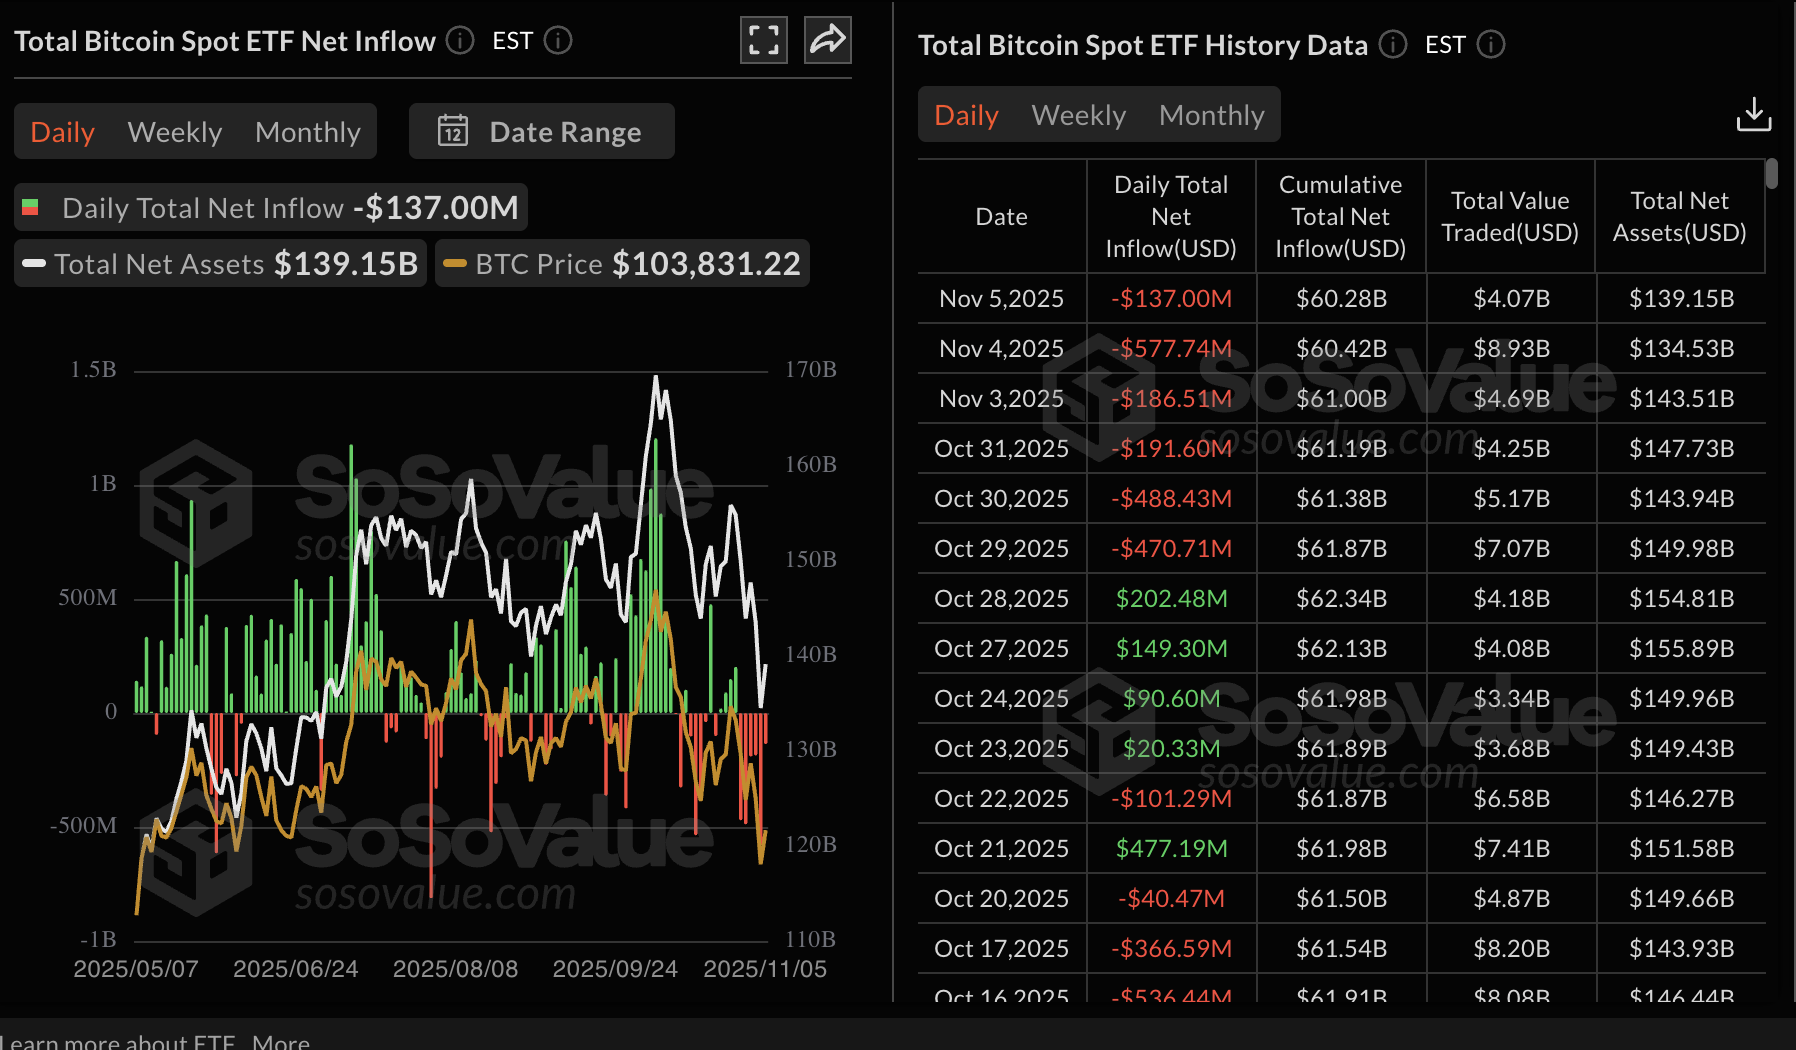
Institutional investors' interest in Bitcoin-related financial products, including ETFs, continues on a seemingly unrecoverable bearish streak. According to SoSoValue data, US-listed BTC ETFs experienced approximately $137 million in outflows on Wednesday. This marked the sixth consecutive day of outflows, bringing the total inflow volume to $60.28 billion and net assets to $139.15 billion.
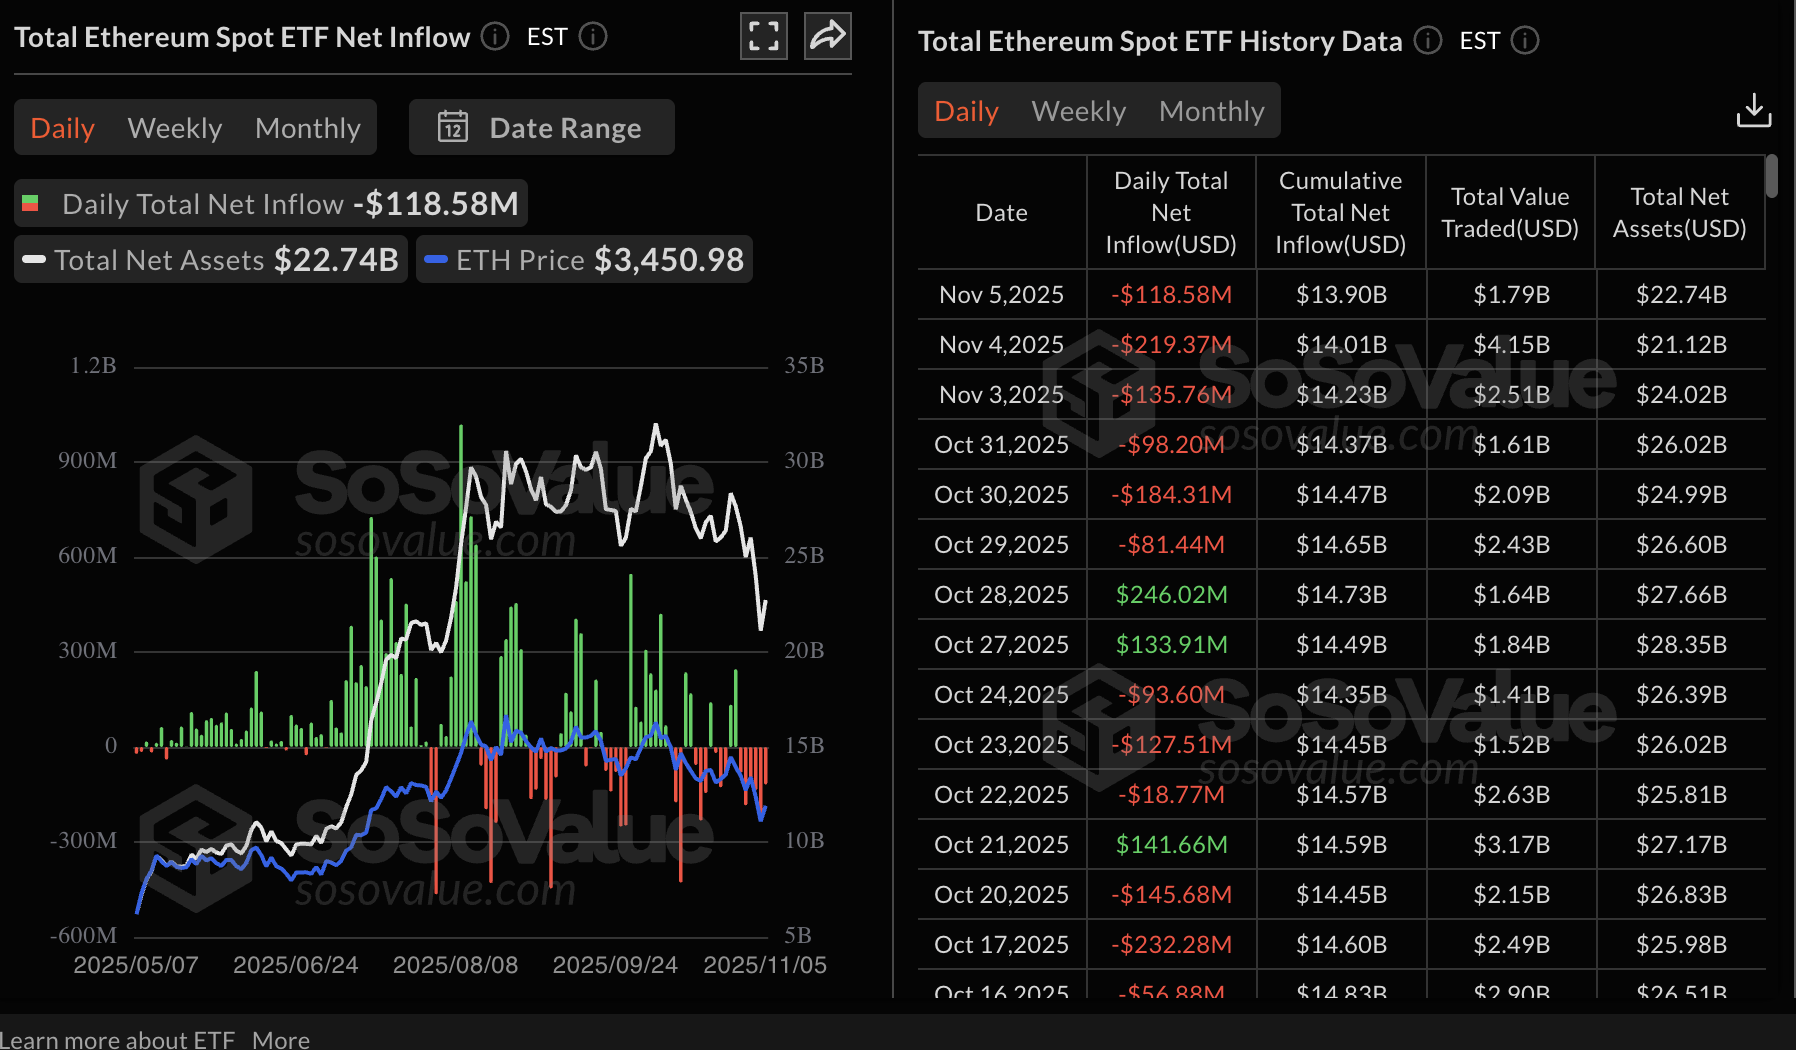
Ethereum ETFs are also on the back foot as institutional investors take a step back, reducing their risk exposure. According to SoSoValue, US-listed ETH ETFs experienced outflows of nearly $119 million on Wednesday, bringing the cumulative net inflows to $13.90 billion and net assets to approximately $22.74 billion.
Three out of the nine ETH ETFs recorded net inflows, including Grayscale's ETH with $24 million, Fidelity's FETH with $3.45 million and 21Shares' TETH with roughly $515,000. BlackRock's ETHA led the outflows with approximately $147 million.
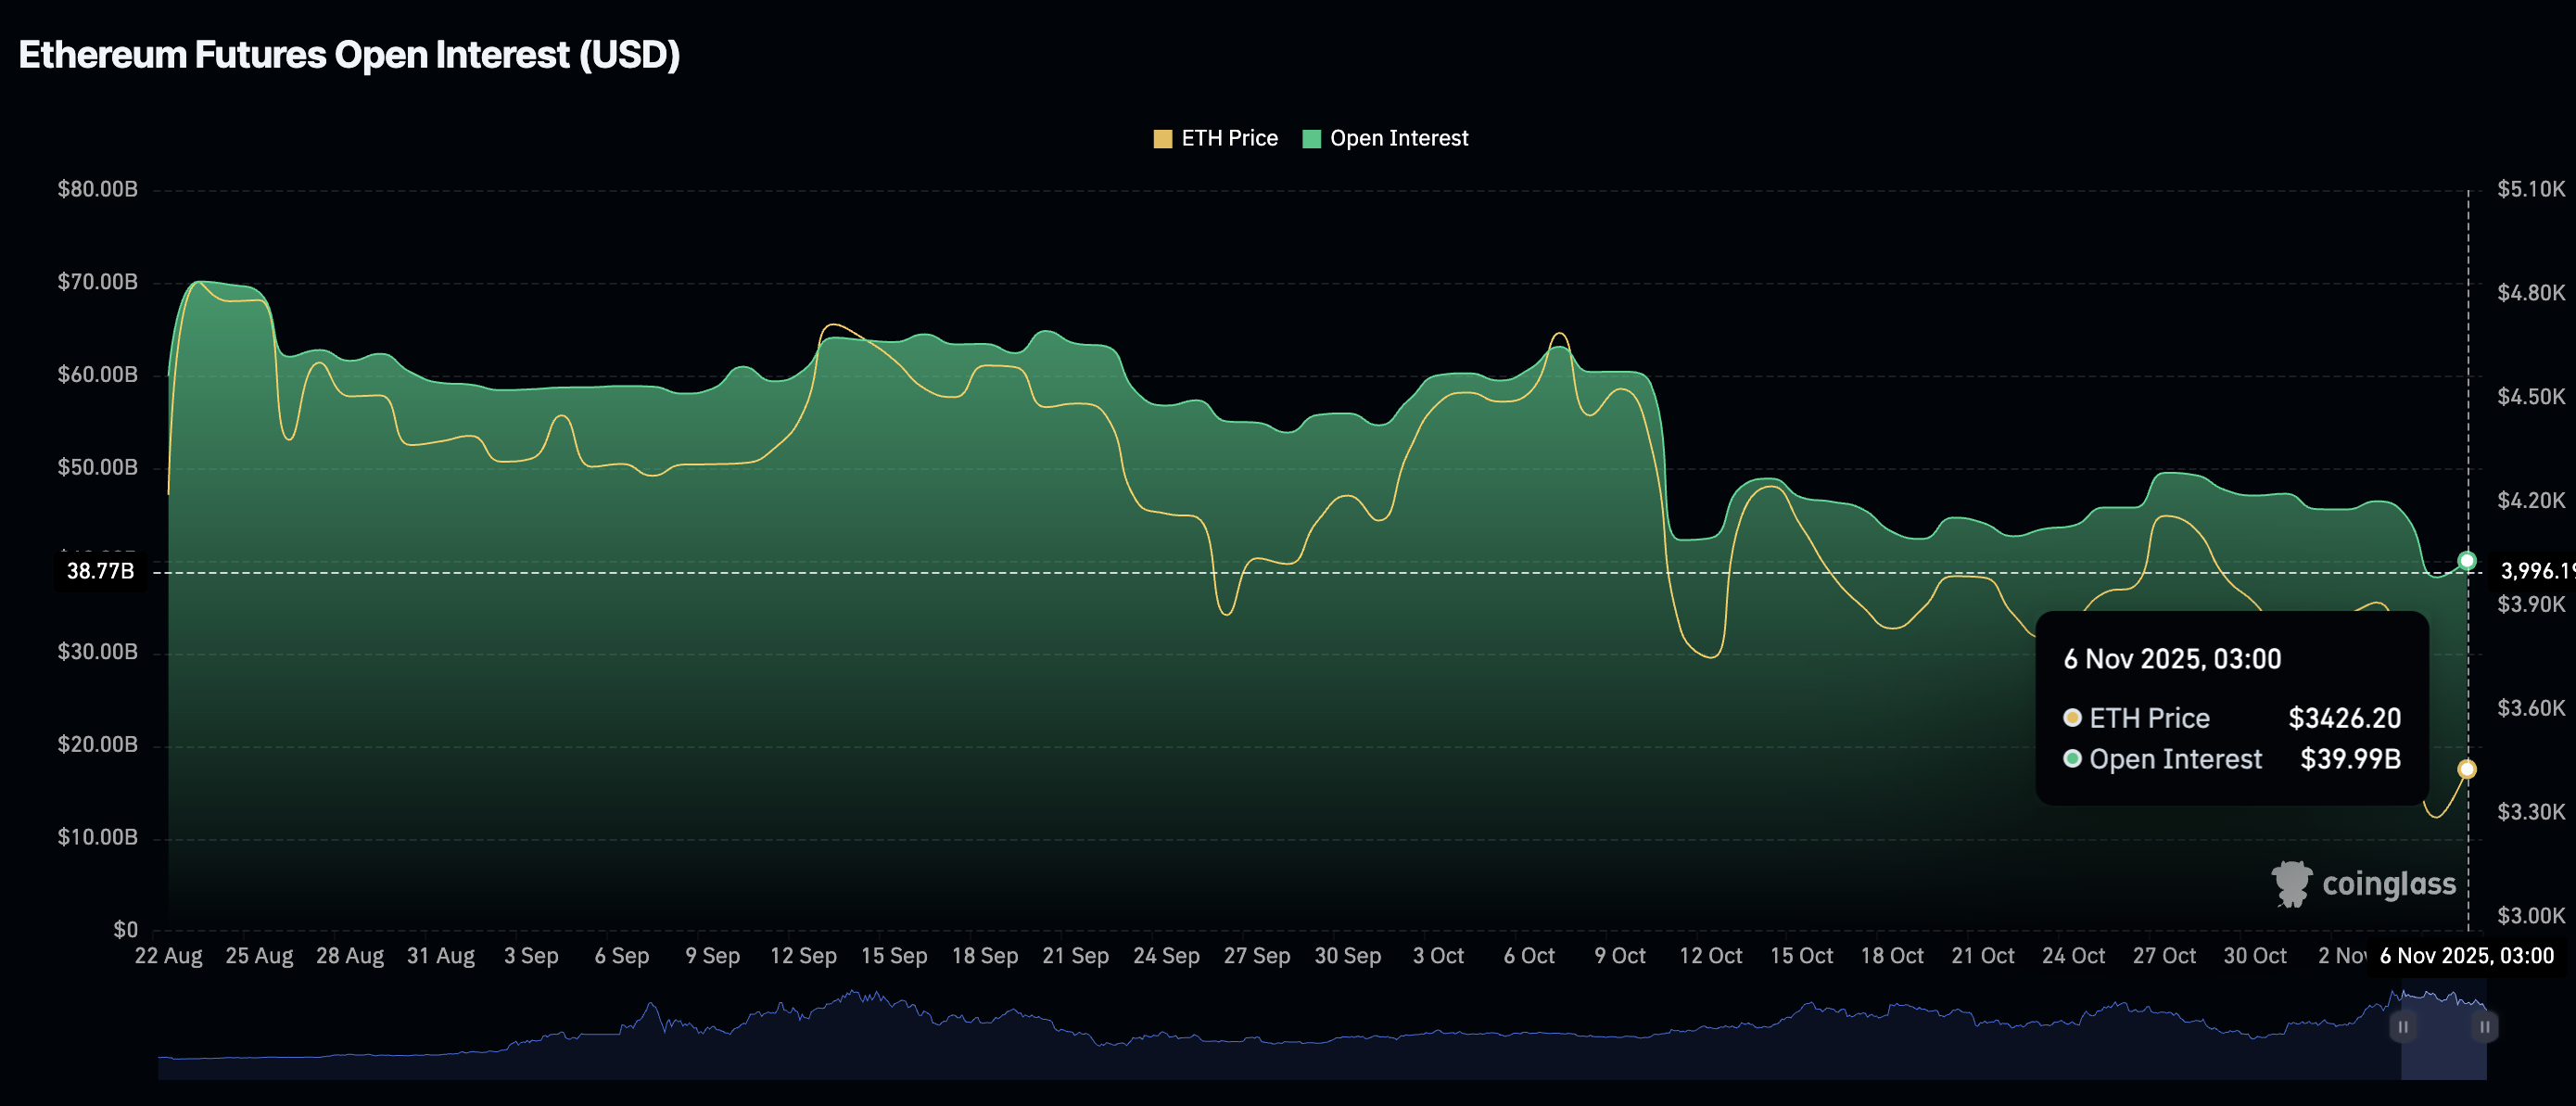
Retail demand for Ethereum has also taken a significant step back, with futures Open Interest (OI) averaging $40 billion on Thursday, down from the October peak of approximately $63 billion.
OI refers to the notional value of outstanding futures contracts, which helps gauge interest and investor confidence in the asset. A persistent decline indicates that traders are closing their long positions in favor of short positions, contributing to selling pressure.
XRP has also experienced a sharp decline in futures OI to $3.54 billion on Thursday, from $4.33 billion on Monday and $9.09 billion on October 7. This steady decline suggests that risk-off sentiment remains prevalent. Traders are likely staying on the sidelines due to a lack of conviction in XRP's ability to sustain recovery.
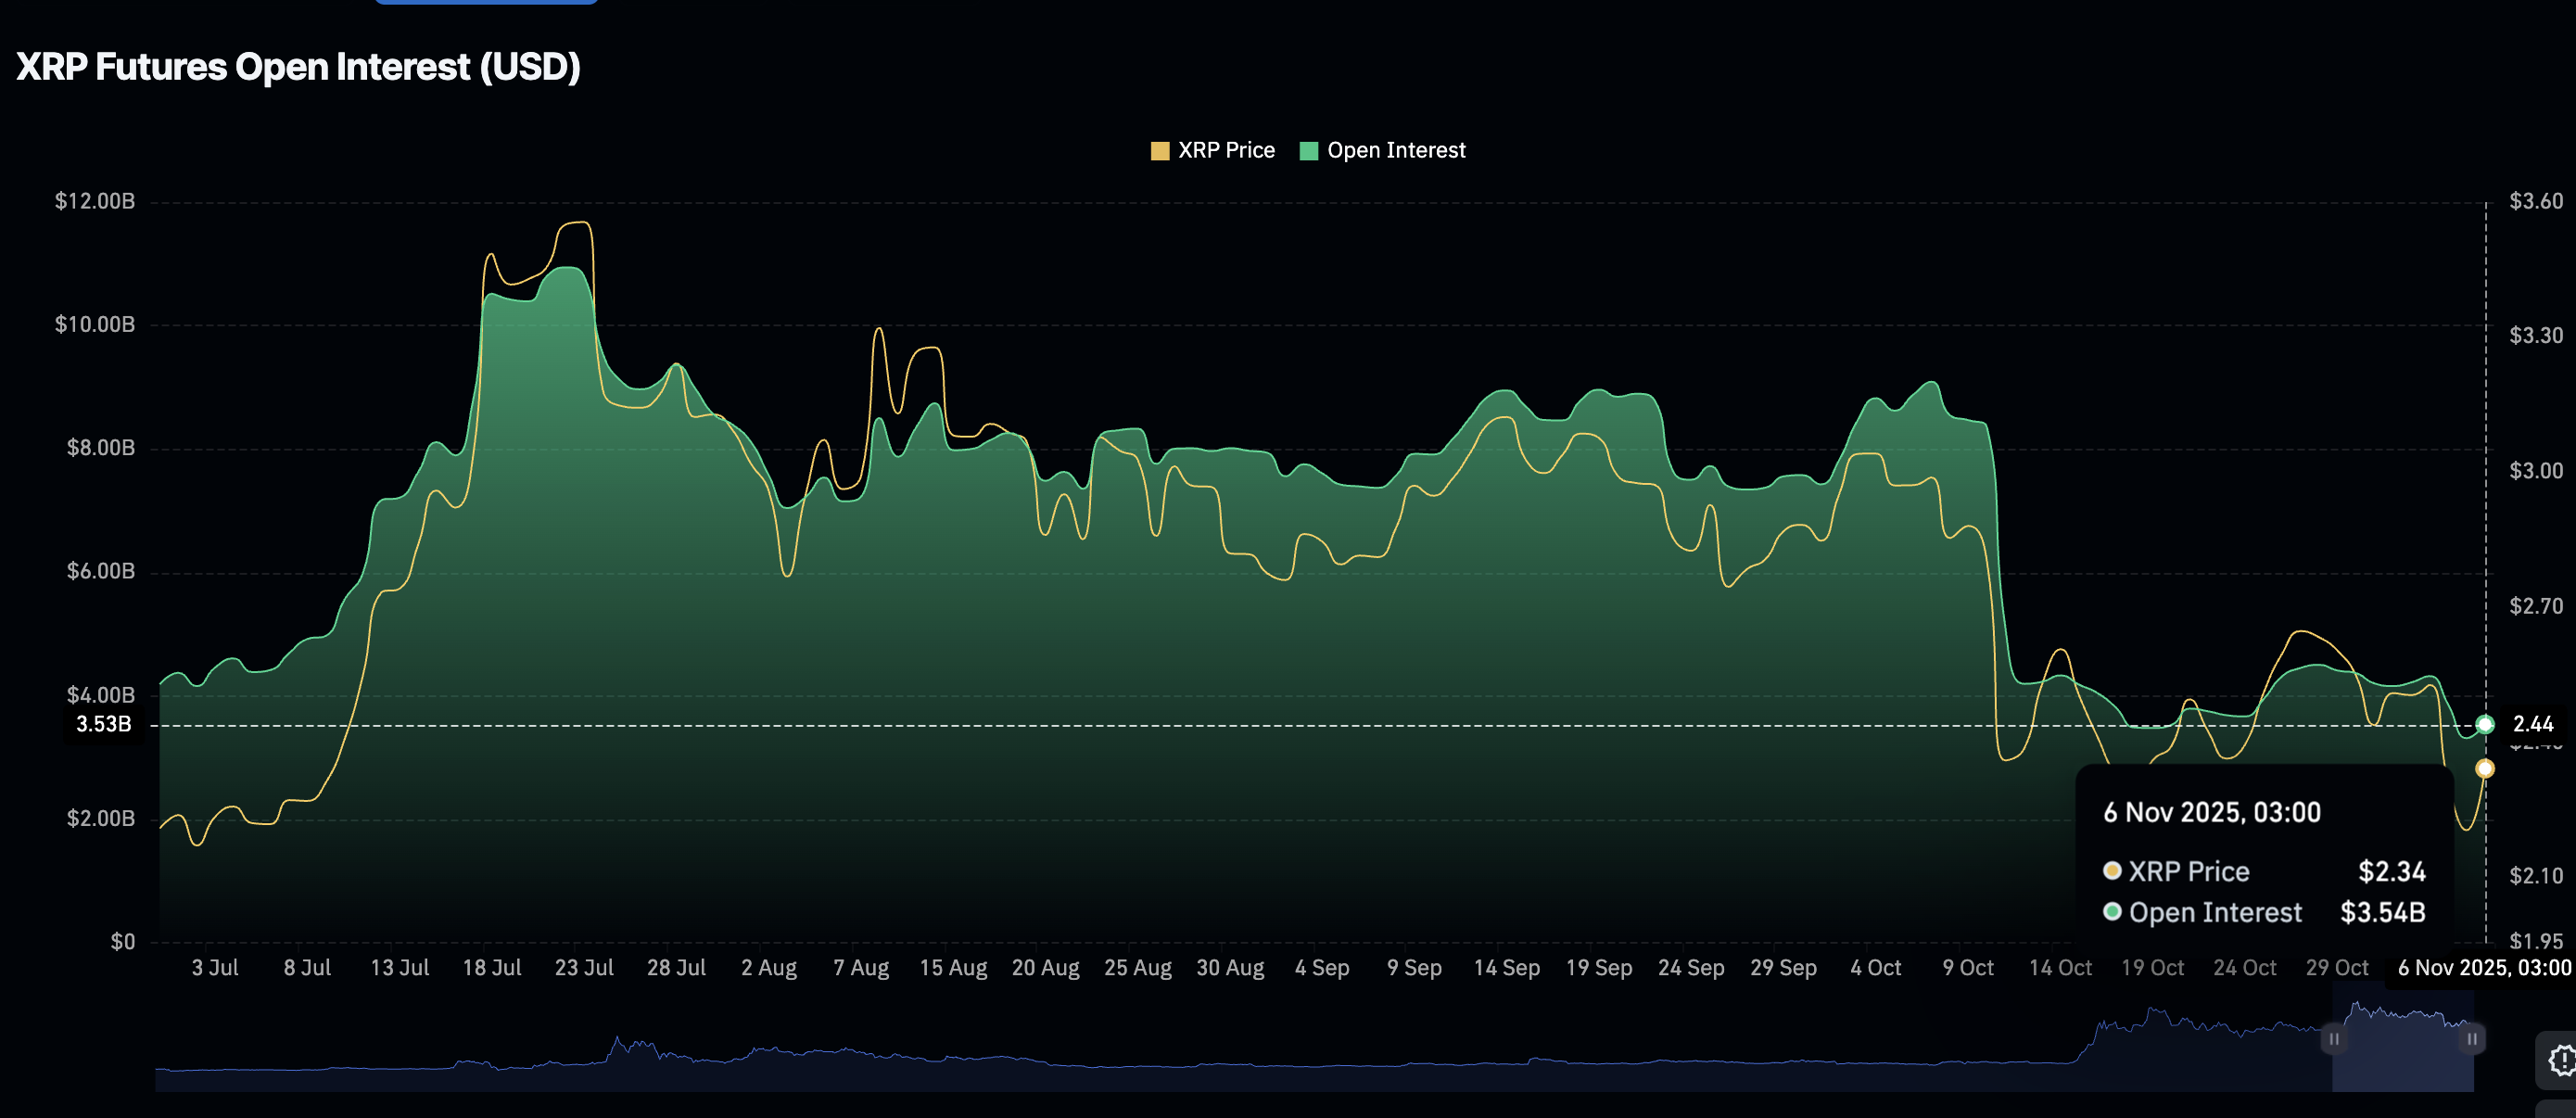
Chart of the day: Bitcoin at risk of falling below $100,000
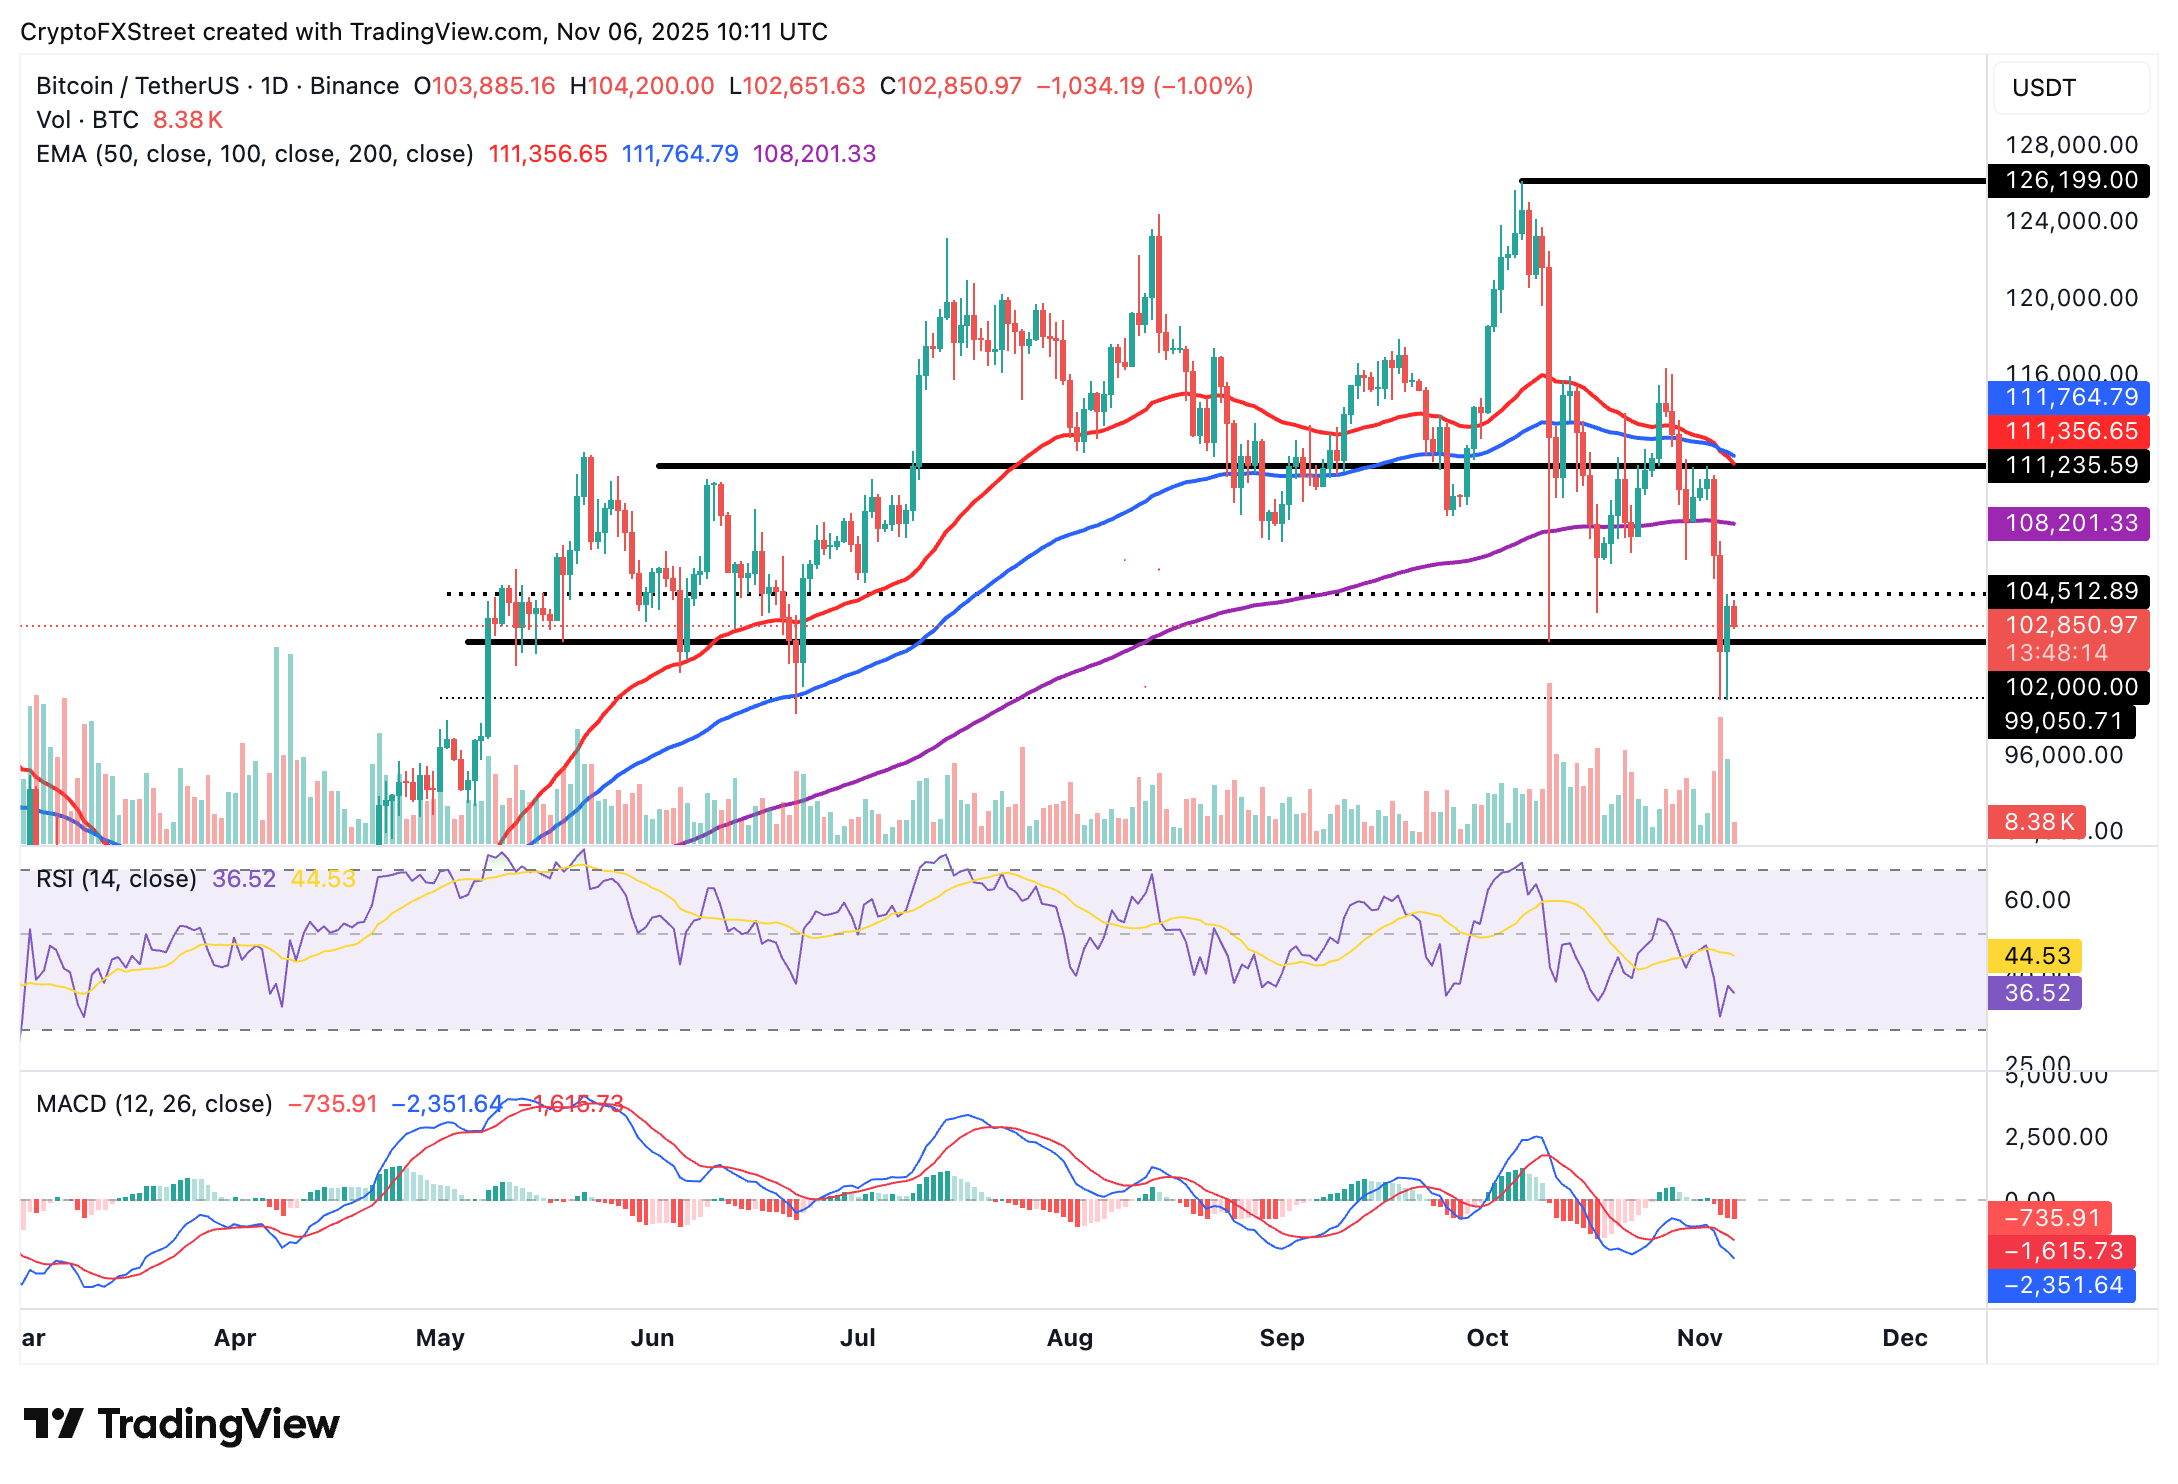
Bitcoin is trading below $103,000 at the time of writing on Thursday, weighed down by risk-off sentiment amid macroeconomic uncertainty and a lack of significant price catalysts to sustain the recovery.
The Relative Strength Index (RSI) on the daily chart is at 36 and continues to fall, indicating that bearish momentum is increasing. A sell signal from the Moving Average Convergence Divergence (MACD) indicator has been maintained since Monday. Such a signal occurs when the blue MACD line crosses and settles below the red signal line, calling upon investors to reduce their risk exposure.
The next line of defense is Bitcoin's October low of $102,000. If respected and investors buy dip, a recovery could ensue toward the round-number resistance at $110,000. Otherwise, BTC may extend its down leg below $100,000 and close in on the support at $99,050, last tested on Wednesday.
Altcoins update: Ethereum, XRP bears regain control
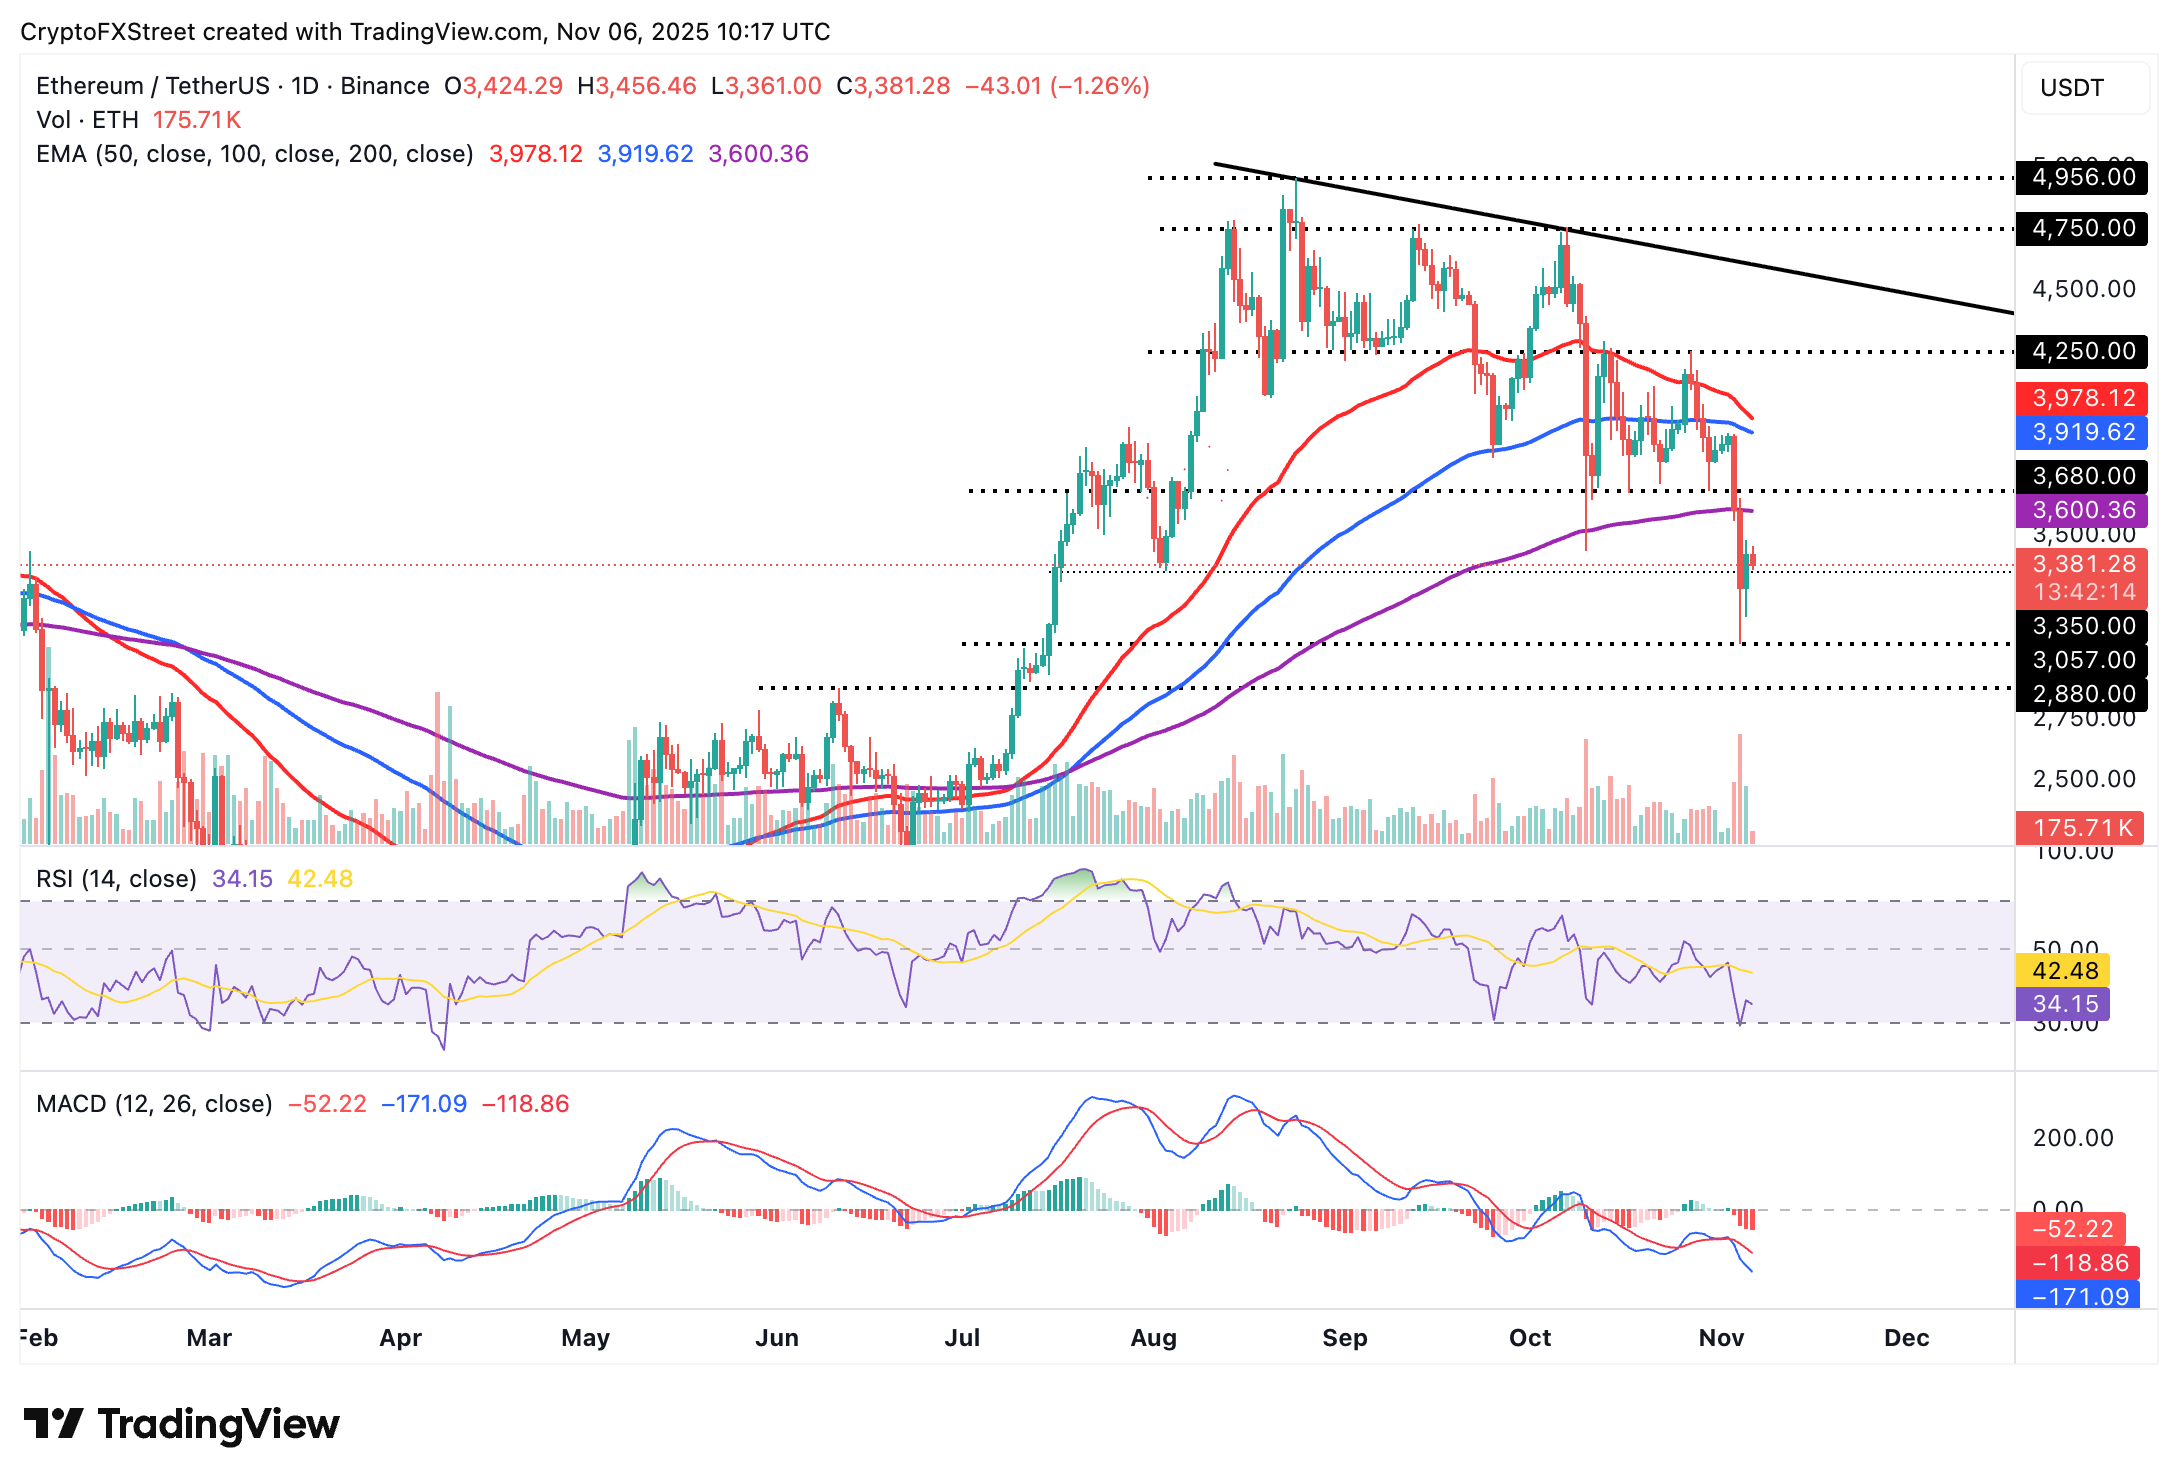
Ethereum is trading below $3,400 amid increased volatility, trimming gains from Wednesday's recovery. The smart contracts token is positioned below key moving averages, including the 200-day Exponential Moving Average (EMA) at $3,600, the 100-day EMA at $3,919 and the 50-day EMA at $3,978, all of which bolster the bearish sentiment.
The RSI is at 34 and declining toward oversold territory, indicating that sellers have the upper hand. A MACD sell signal on the daily chart has, since Monday, encouraged traders to close their long positions in favor of short orders. If the decline persists, the next key support is the area around $3,057, which was tested on Tuesday.
Still, a daily close above the short-term round-number resistance at $3,400 may reinforce the shift from bearish to bullish, increasing the odds of a reversal toward the 200-day EMA at $3,600.
As for XRP, sellers have the upper hand at the time of writing, as the cross-border remittance token slips, snipping some of the gains accrued on Wednesday. An incoming Death Cross pattern could accelerate the pullback.
A Death Cross is a bearish pattern, which occurs when a shorter-term moving average crosses below a longer-term one. From the daily chart below, the 50-day EMA at $2.60 is on the verge of crossing below the 200-day EMA at $2.59, bolstering the bearish outlook.
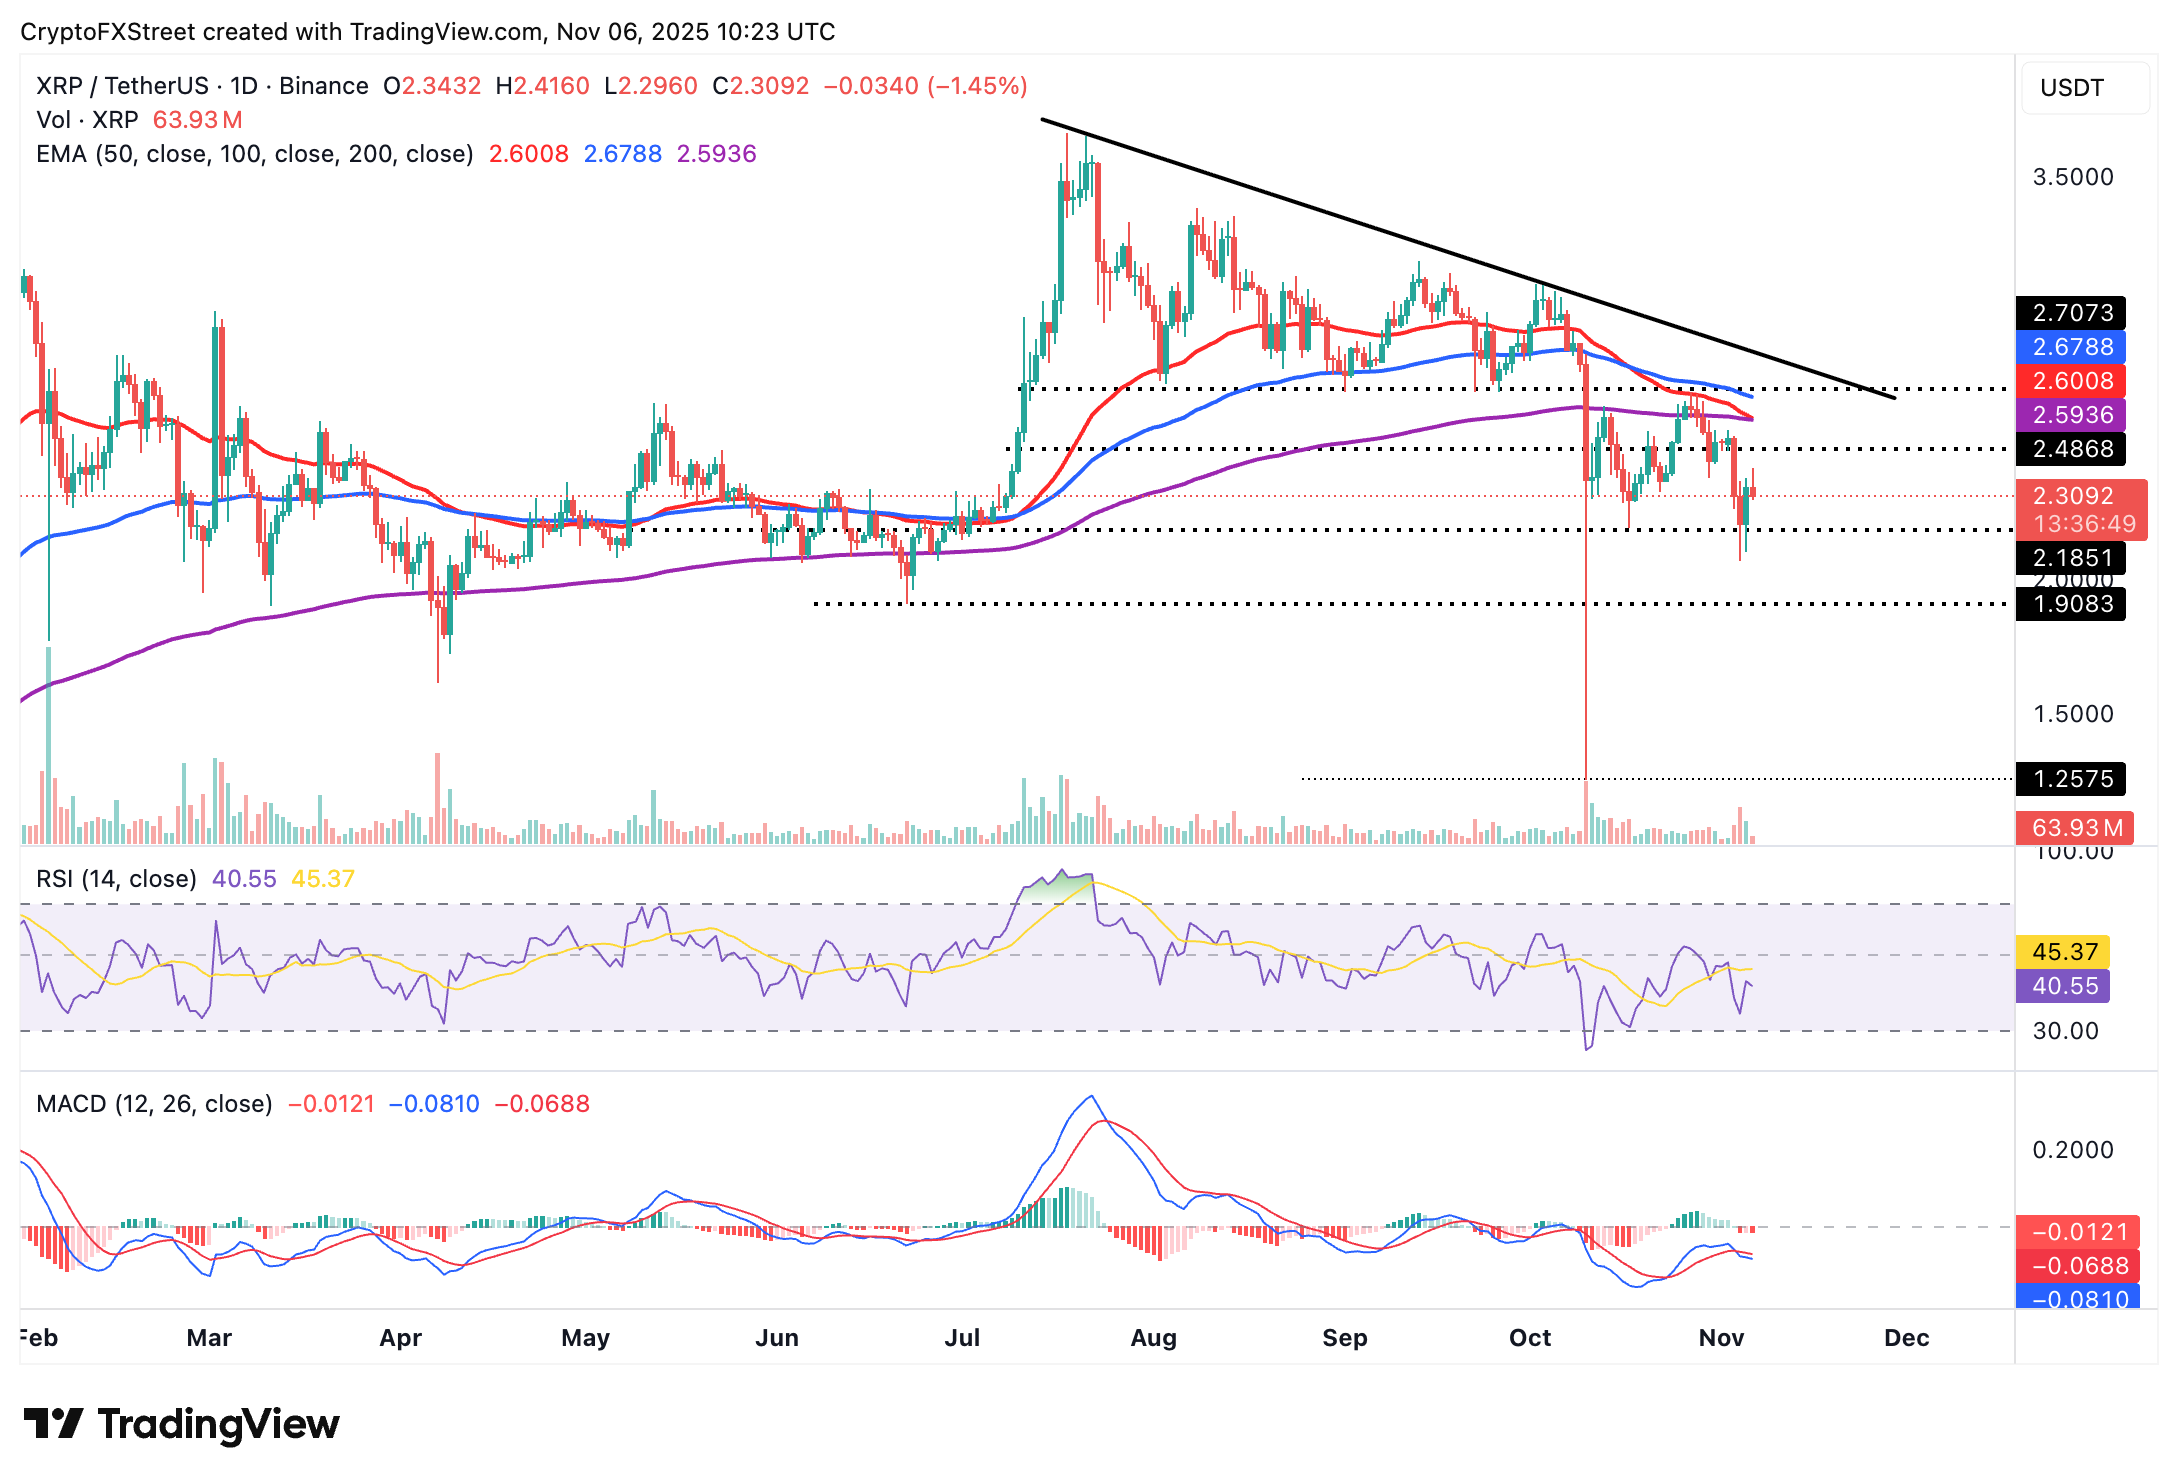
The MACD has maintained a sell signal on the same daily chart since Tuesday, suggesting traders reduce their exposure. If the decline persists in upcoming sessions, XRP may extend the down leg below $2.19, a support tested on October 17, and later below $1.90, last tested in June.
Bitcoin, altcoins, stablecoins FAQs
Bitcoin is the largest cryptocurrency by market capitalization, a virtual currency designed to serve as money. This form of payment cannot be controlled by any one person, group, or entity, which eliminates the need for third-party participation during financial transactions.
Altcoins are any cryptocurrency apart from Bitcoin, but some also regard Ethereum as a non-altcoin because it is from these two cryptocurrencies that forking happens. If this is true, then Litecoin is the first altcoin, forked from the Bitcoin protocol and, therefore, an “improved” version of it.
Stablecoins are cryptocurrencies designed to have a stable price, with their value backed by a reserve of the asset it represents. To achieve this, the value of any one stablecoin is pegged to a commodity or financial instrument, such as the US Dollar (USD), with its supply regulated by an algorithm or demand. The main goal of stablecoins is to provide an on/off-ramp for investors willing to trade and invest in cryptocurrencies. Stablecoins also allow investors to store value since cryptocurrencies, in general, are subject to volatility.
Bitcoin dominance is the ratio of Bitcoin's market capitalization to the total market capitalization of all cryptocurrencies combined. It provides a clear picture of Bitcoin’s interest among investors. A high BTC dominance typically happens before and during a bull run, in which investors resort to investing in relatively stable and high market capitalization cryptocurrency like Bitcoin. A drop in BTC dominance usually means that investors are moving their capital and/or profits to altcoins in a quest for higher returns, which usually triggers an explosion of altcoin rallies.
추천 기사


