
Pi Network Price Forecast: PI prepares for trend reversal as selling pressure drops
- Pi Network forms a W-shaped pattern, bouncing off the $0.1996 support level.
- A fresh uptrend in the MACD after a crossover on Saturday suggests renewed bullish momentum.
- Outflows from CEXs and Pi Foundation wallet flash mixed on-chain signals.
Pi Network (PI) trades north of the $0.20 psychological level at press time on Monday, preparing for a W-shaped reversal as selling pressure wanes. However, the on-chain data indicates mixed signals, keeping PI on the edge.
CEXs and Foundation token flows remain divided
The retail demand of PI token on the Know Your Business (KYB) verified Centralized Exchanges (CEXs) is on the rise. PiScan data shows that in the last 24 hours, CEXs wallet balances have experienced an outflow of 1.23 million PI tokens. This amounts for nearly 0.01% of the PI total supply or 0.29% of the CEXs wallet balances which is 411.41 million PI tokens.
While the demand increases on exchanges, the Pi Foundation wallet #2 registers an outflow of 1.28 million PI tokens. The near equal but opposite token flows keep the Pi Network on edge.
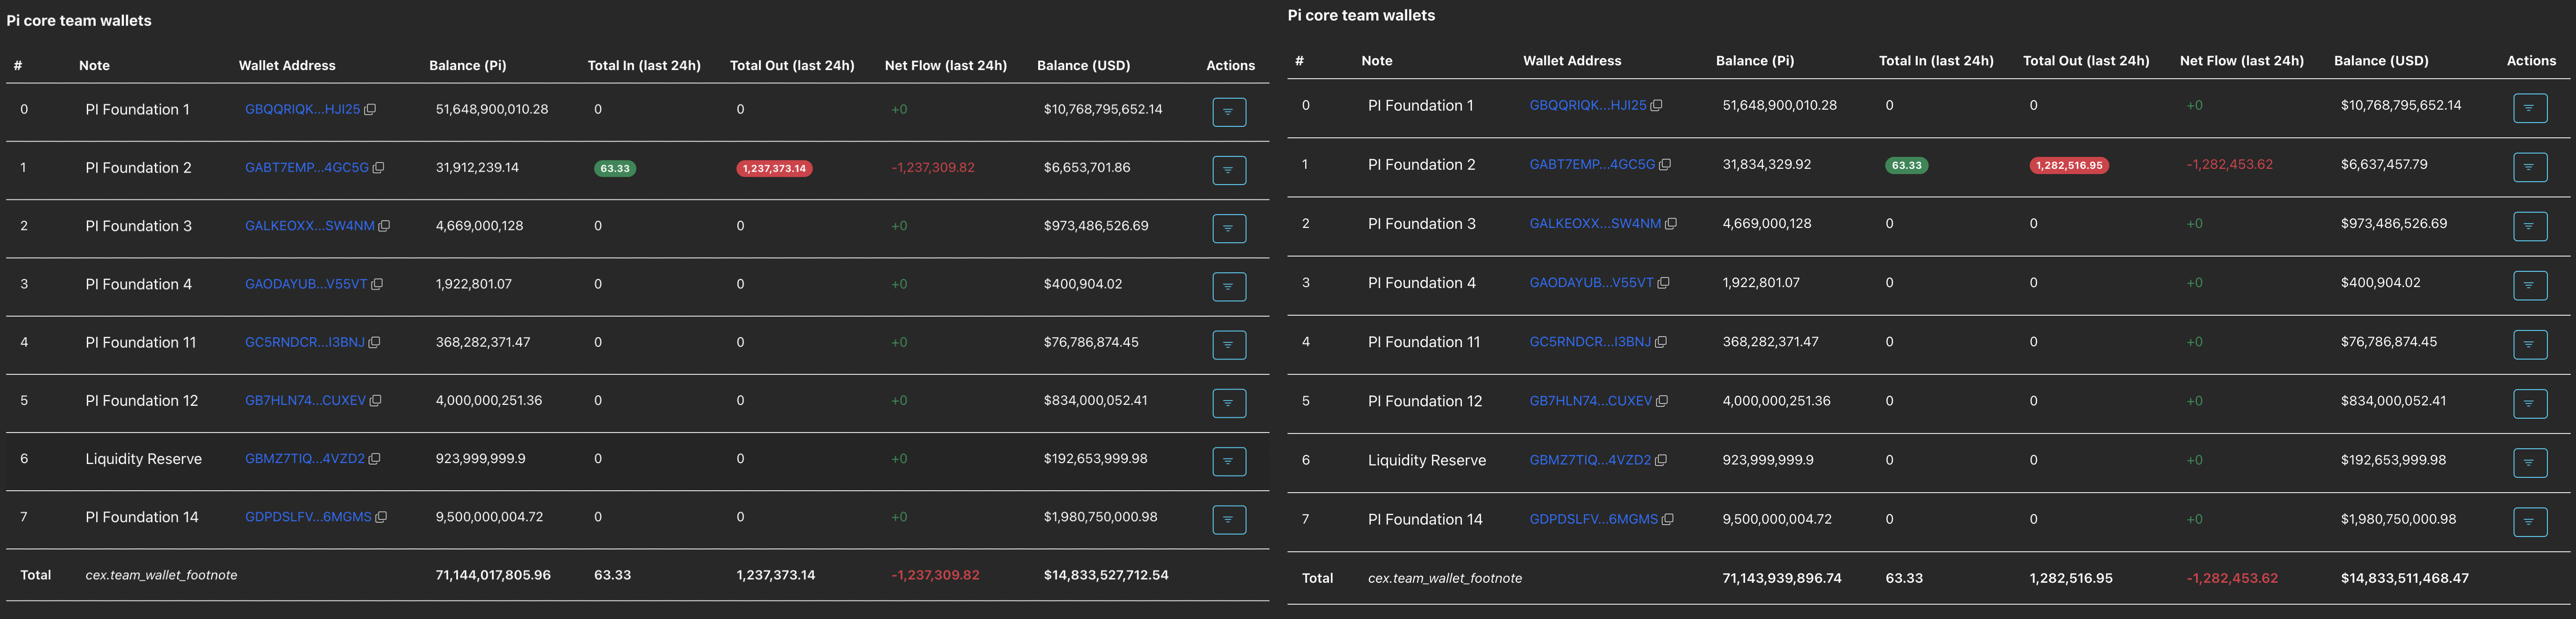
PI CEXs and Foundation wallets balances. PiScan.
Pi Network’s technical indicators flash optimism
Pi Networks ticks higher by 1% at press time on Monday, for the third consecutive day as the broader cryptocurrency market recovers gradually. The mobile mining cryptocurrency expanding to Web3 use cases consolidates between a range extending from $0.2295 and $0.1996, aligning with the open and close of October 10, respectively.
If the recovery run shatters the upper ceiling at $0.2295, confirming the W-shaped pattern breakout, it could target the centre Pivot Point level at $0.2755.
The techncial indicators on the daily chart suggest a renewal in bullish momentum as bears lose grip over trend control. The Moving Average Convergence Divergence (MACD) extends the uptrend after crossing above its signal line on Saturday, indicating the bullish momentum renewal.
At the same time, the Relative Strength Index (RSI) reads 31 on the same chart, rising from the oversold zone, with an upward trend, suggesting a decline in bearish pressure.
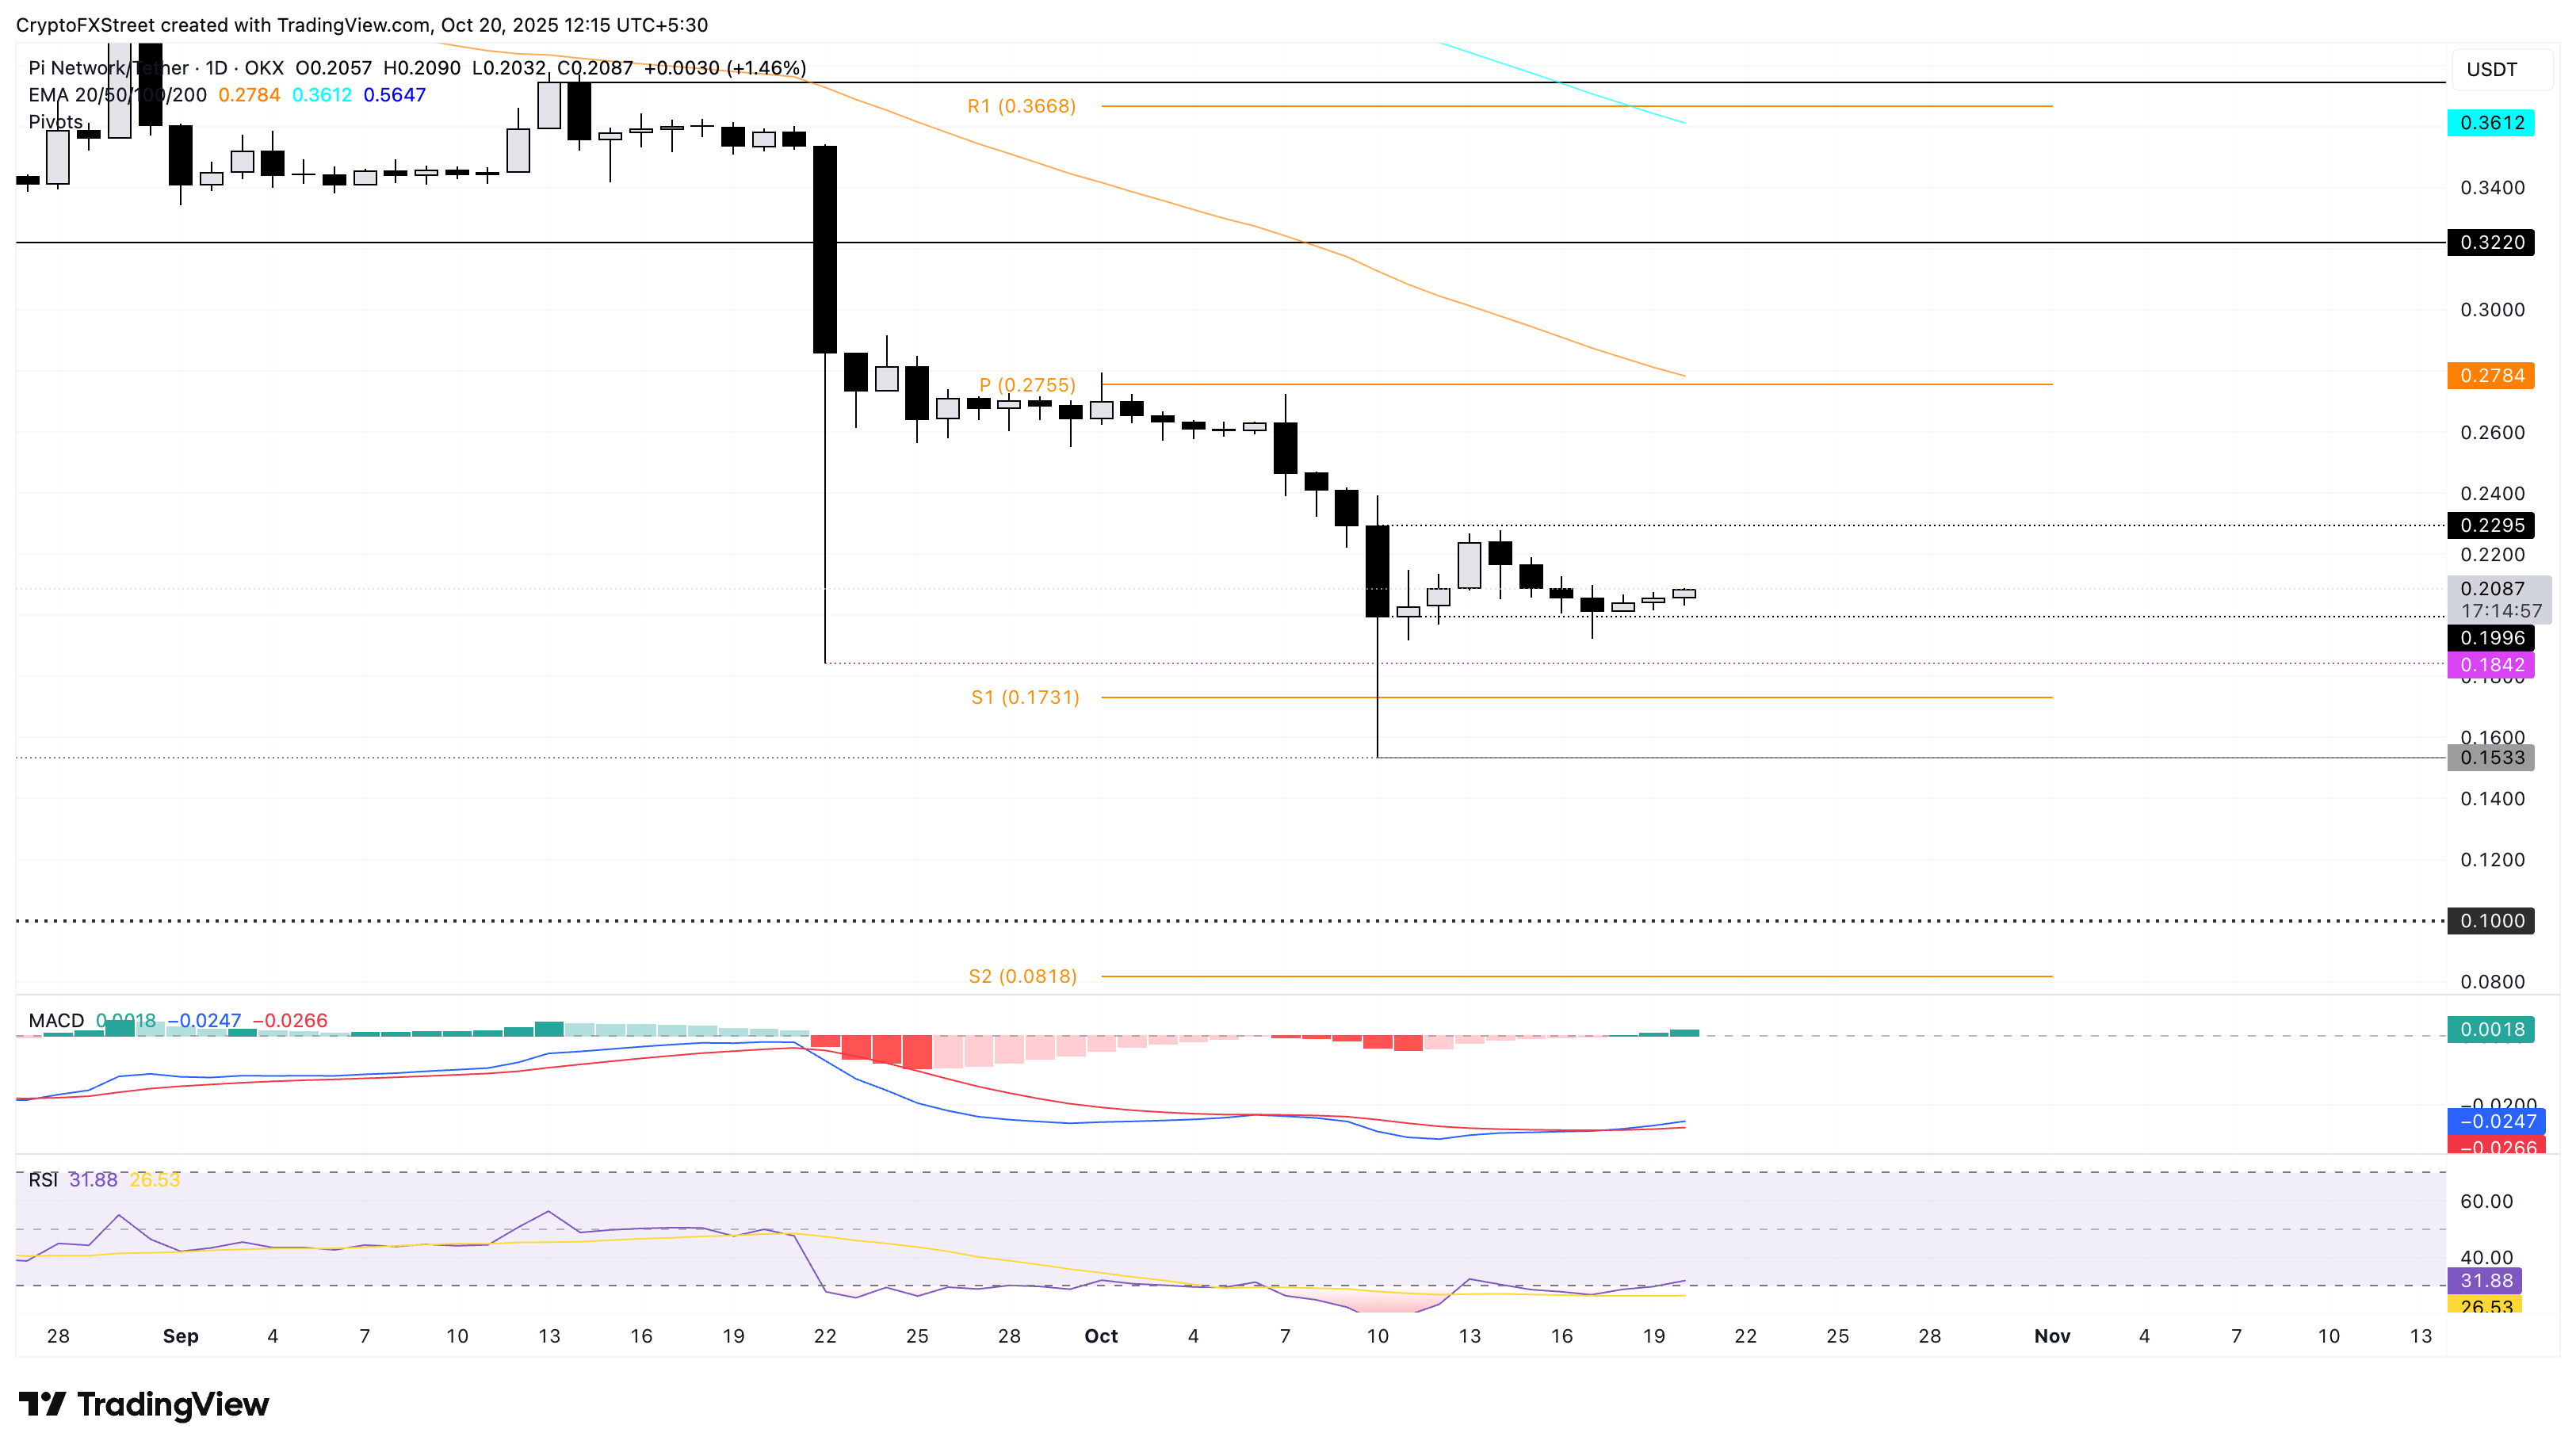
PI/USDT daily price chart.
Still, if PI fails to sustain above the $0.1996 level, it could extend the decline to the S1 Pivot Point level at $0.1731.
Bitcoin, altcoins, stablecoins FAQs
Bitcoin is the largest cryptocurrency by market capitalization, a virtual currency designed to serve as money. This form of payment cannot be controlled by any one person, group, or entity, which eliminates the need for third-party participation during financial transactions.
Altcoins are any cryptocurrency apart from Bitcoin, but some also regard Ethereum as a non-altcoin because it is from these two cryptocurrencies that forking happens. If this is true, then Litecoin is the first altcoin, forked from the Bitcoin protocol and, therefore, an “improved” version of it.
Stablecoins are cryptocurrencies designed to have a stable price, with their value backed by a reserve of the asset it represents. To achieve this, the value of any one stablecoin is pegged to a commodity or financial instrument, such as the US Dollar (USD), with its supply regulated by an algorithm or demand. The main goal of stablecoins is to provide an on/off-ramp for investors willing to trade and invest in cryptocurrencies. Stablecoins also allow investors to store value since cryptocurrencies, in general, are subject to volatility.
Bitcoin dominance is the ratio of Bitcoin's market capitalization to the total market capitalization of all cryptocurrencies combined. It provides a clear picture of Bitcoin’s interest among investors. A high BTC dominance typically happens before and during a bull run, in which investors resort to investing in relatively stable and high market capitalization cryptocurrency like Bitcoin. A drop in BTC dominance usually means that investors are moving their capital and/or profits to altcoins in a quest for higher returns, which usually triggers an explosion of altcoin rallies.
추천 기사


