


Pi Network Price Forecast: PI holds stable amid market volatility
- Pi Network holds at $0.20 level, making muted moves amid the broader market pullback.
- The technical indicators suggest a decline in selling pressure.
- Pi Network’s CEXs' reserves recorded a net outflow of 2.58 million PI in the last 24 hours.
Pi Network (PI) trades above $0.20 at press time on Friday, with a largely muted price movement in comparison to the broader market volatility. Amid the struggles to hold the gains made on the previous weekend, net outflows from the Pi Network’s Centralized Exchanges (CEXs) reserves signal buying dominance, signaling supply pressure coming from off-exchange transactions.
On-exchange demand sustains as external pressure offloads supply
The small list of CEXs listing Pi Network’s PI token witnesses a rise in demand, while the selling pressure persists. PiScan data shows a net outflow of 2.58 million PI tokens from CEXs' wallet balances in the last 24 hours. Typically, an outflow in exchange reserves signals a reduction in selling pressure.
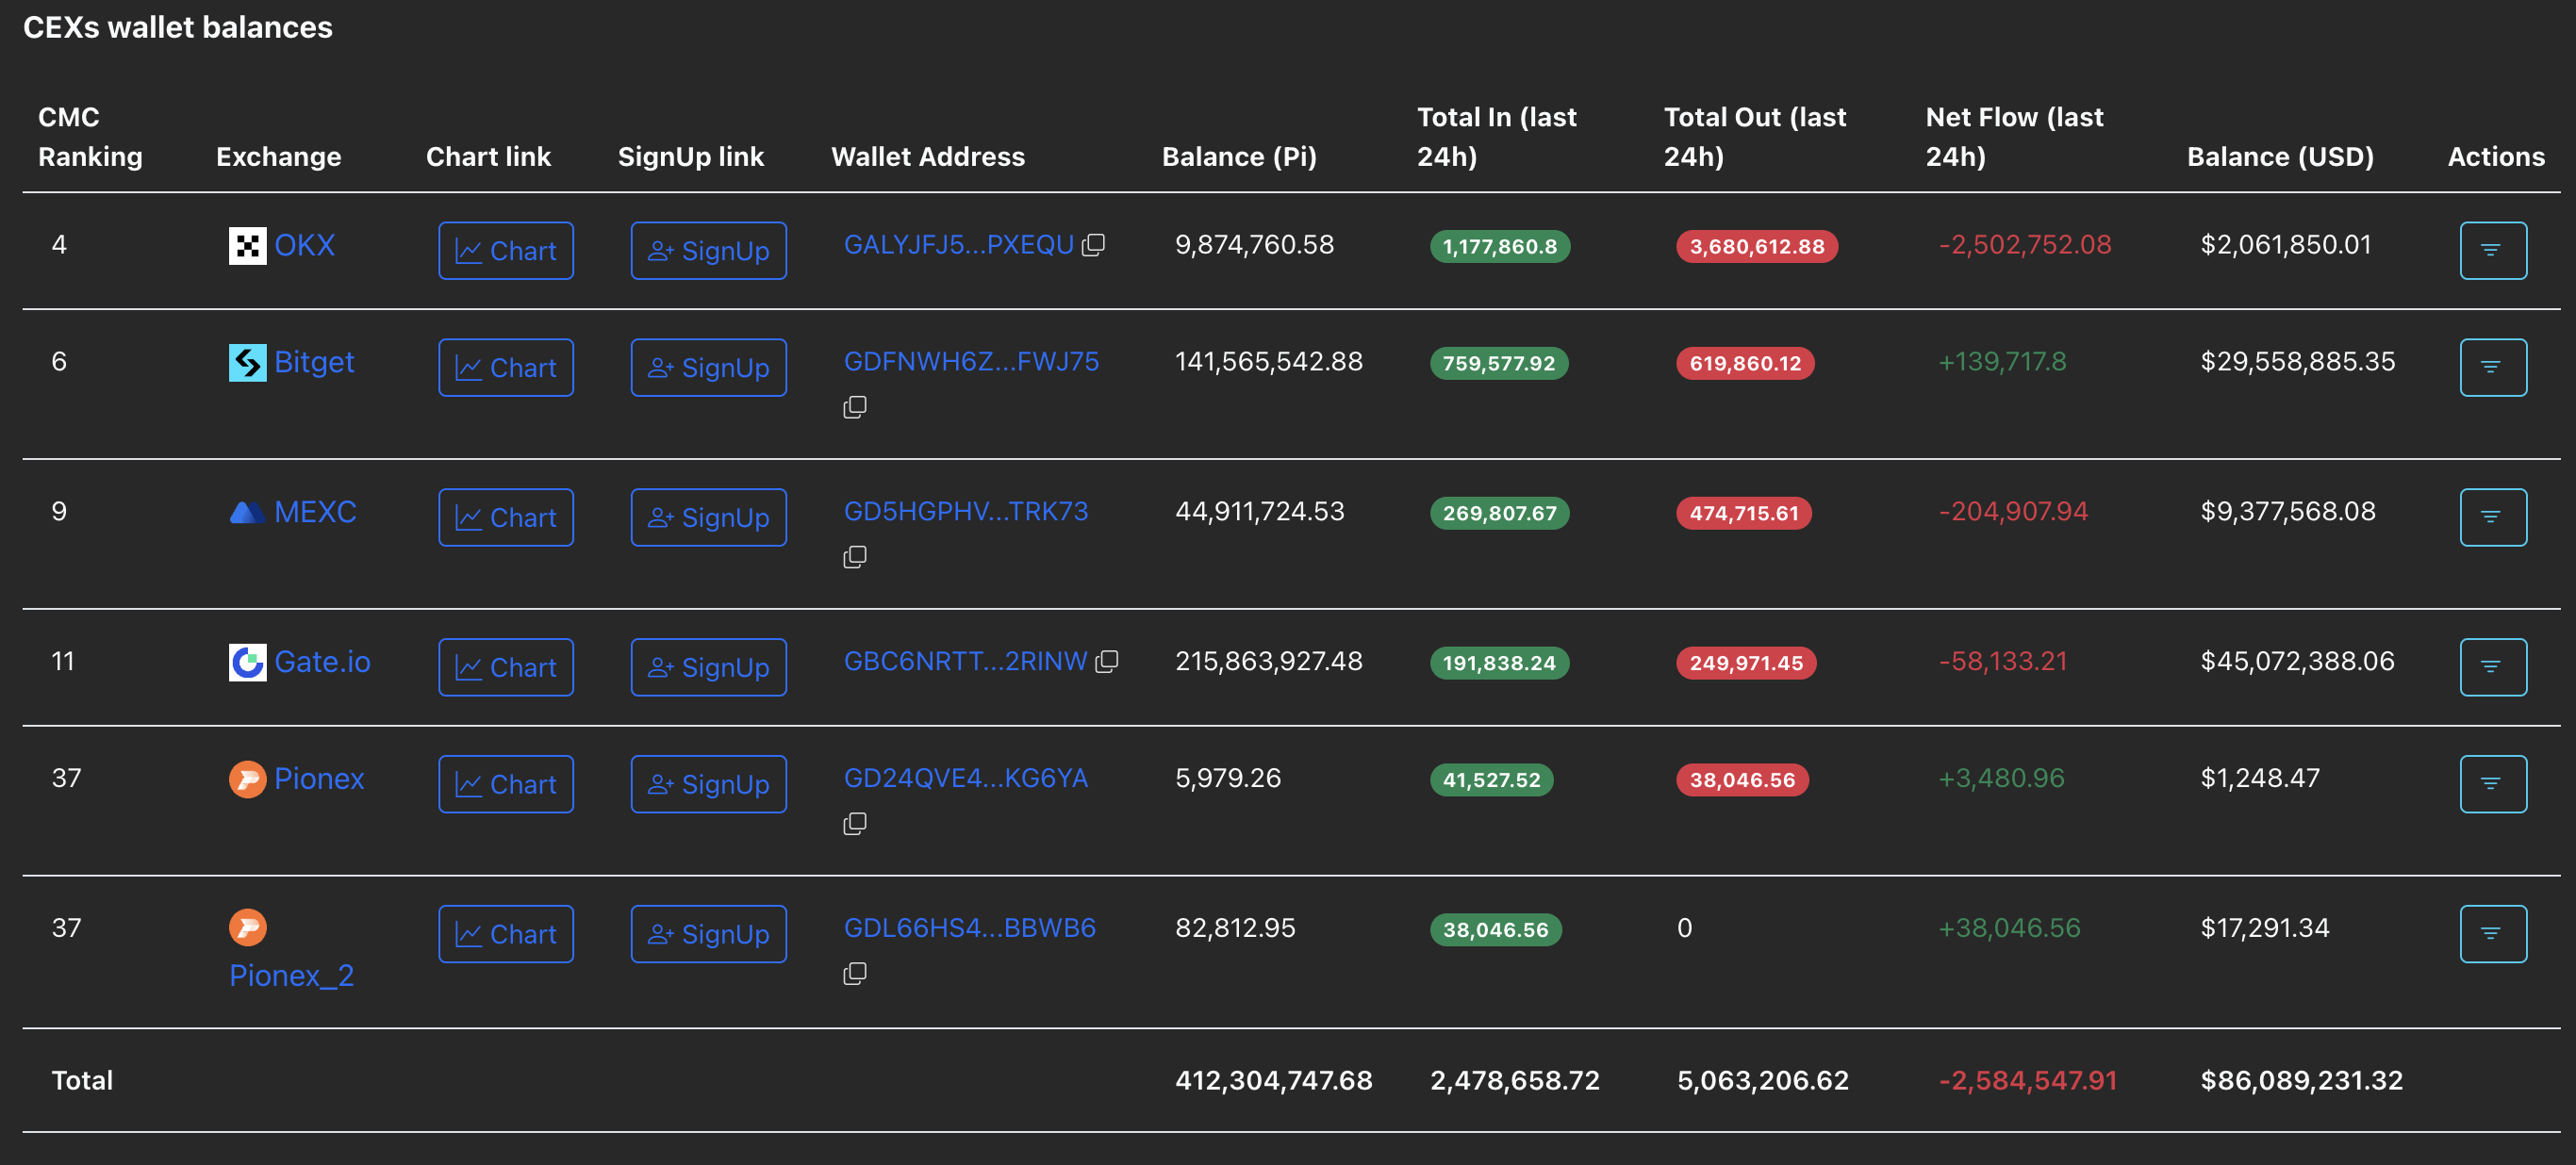
CEXs wallet balances. Source: PiScan
However, as mentioned previously by FXStreet, the majority of PI tokens remain off exchange, which makes it difficult to track the supply flow. Still, the ongoing correction spree is largely driven by off-exchange sell-offs, as CEXs' wallet balances rarely record inflows.
Technical outlook: Will Pi Network rebound as selling pressure wanes?
Pi Network edges higher by 1% at press time on Friday, after three consecutive days of losses. The PI token holding above the $0.20 psychological support level provides a buffer phase amid the risk of a steeper correction.
The mobile mining cryptocurrency maintains a rather sideways trend within the October 10 candle, ranging from $0.2295 to $0.1996. A decisive close below the $0.1996 could test the S1 Pivot Point level at $0.1731.
The Moving Average Convergence Divergence (MACD) converges with its signal line, indicating a decline in selling pressure. A potential crossover above its signal line would flash a rise in bullish momentum.
The Relative Strength Index (RSI) reads 29, recovering within the oversold zone, indicating a potential reversal as overhead pressure nears saturation.
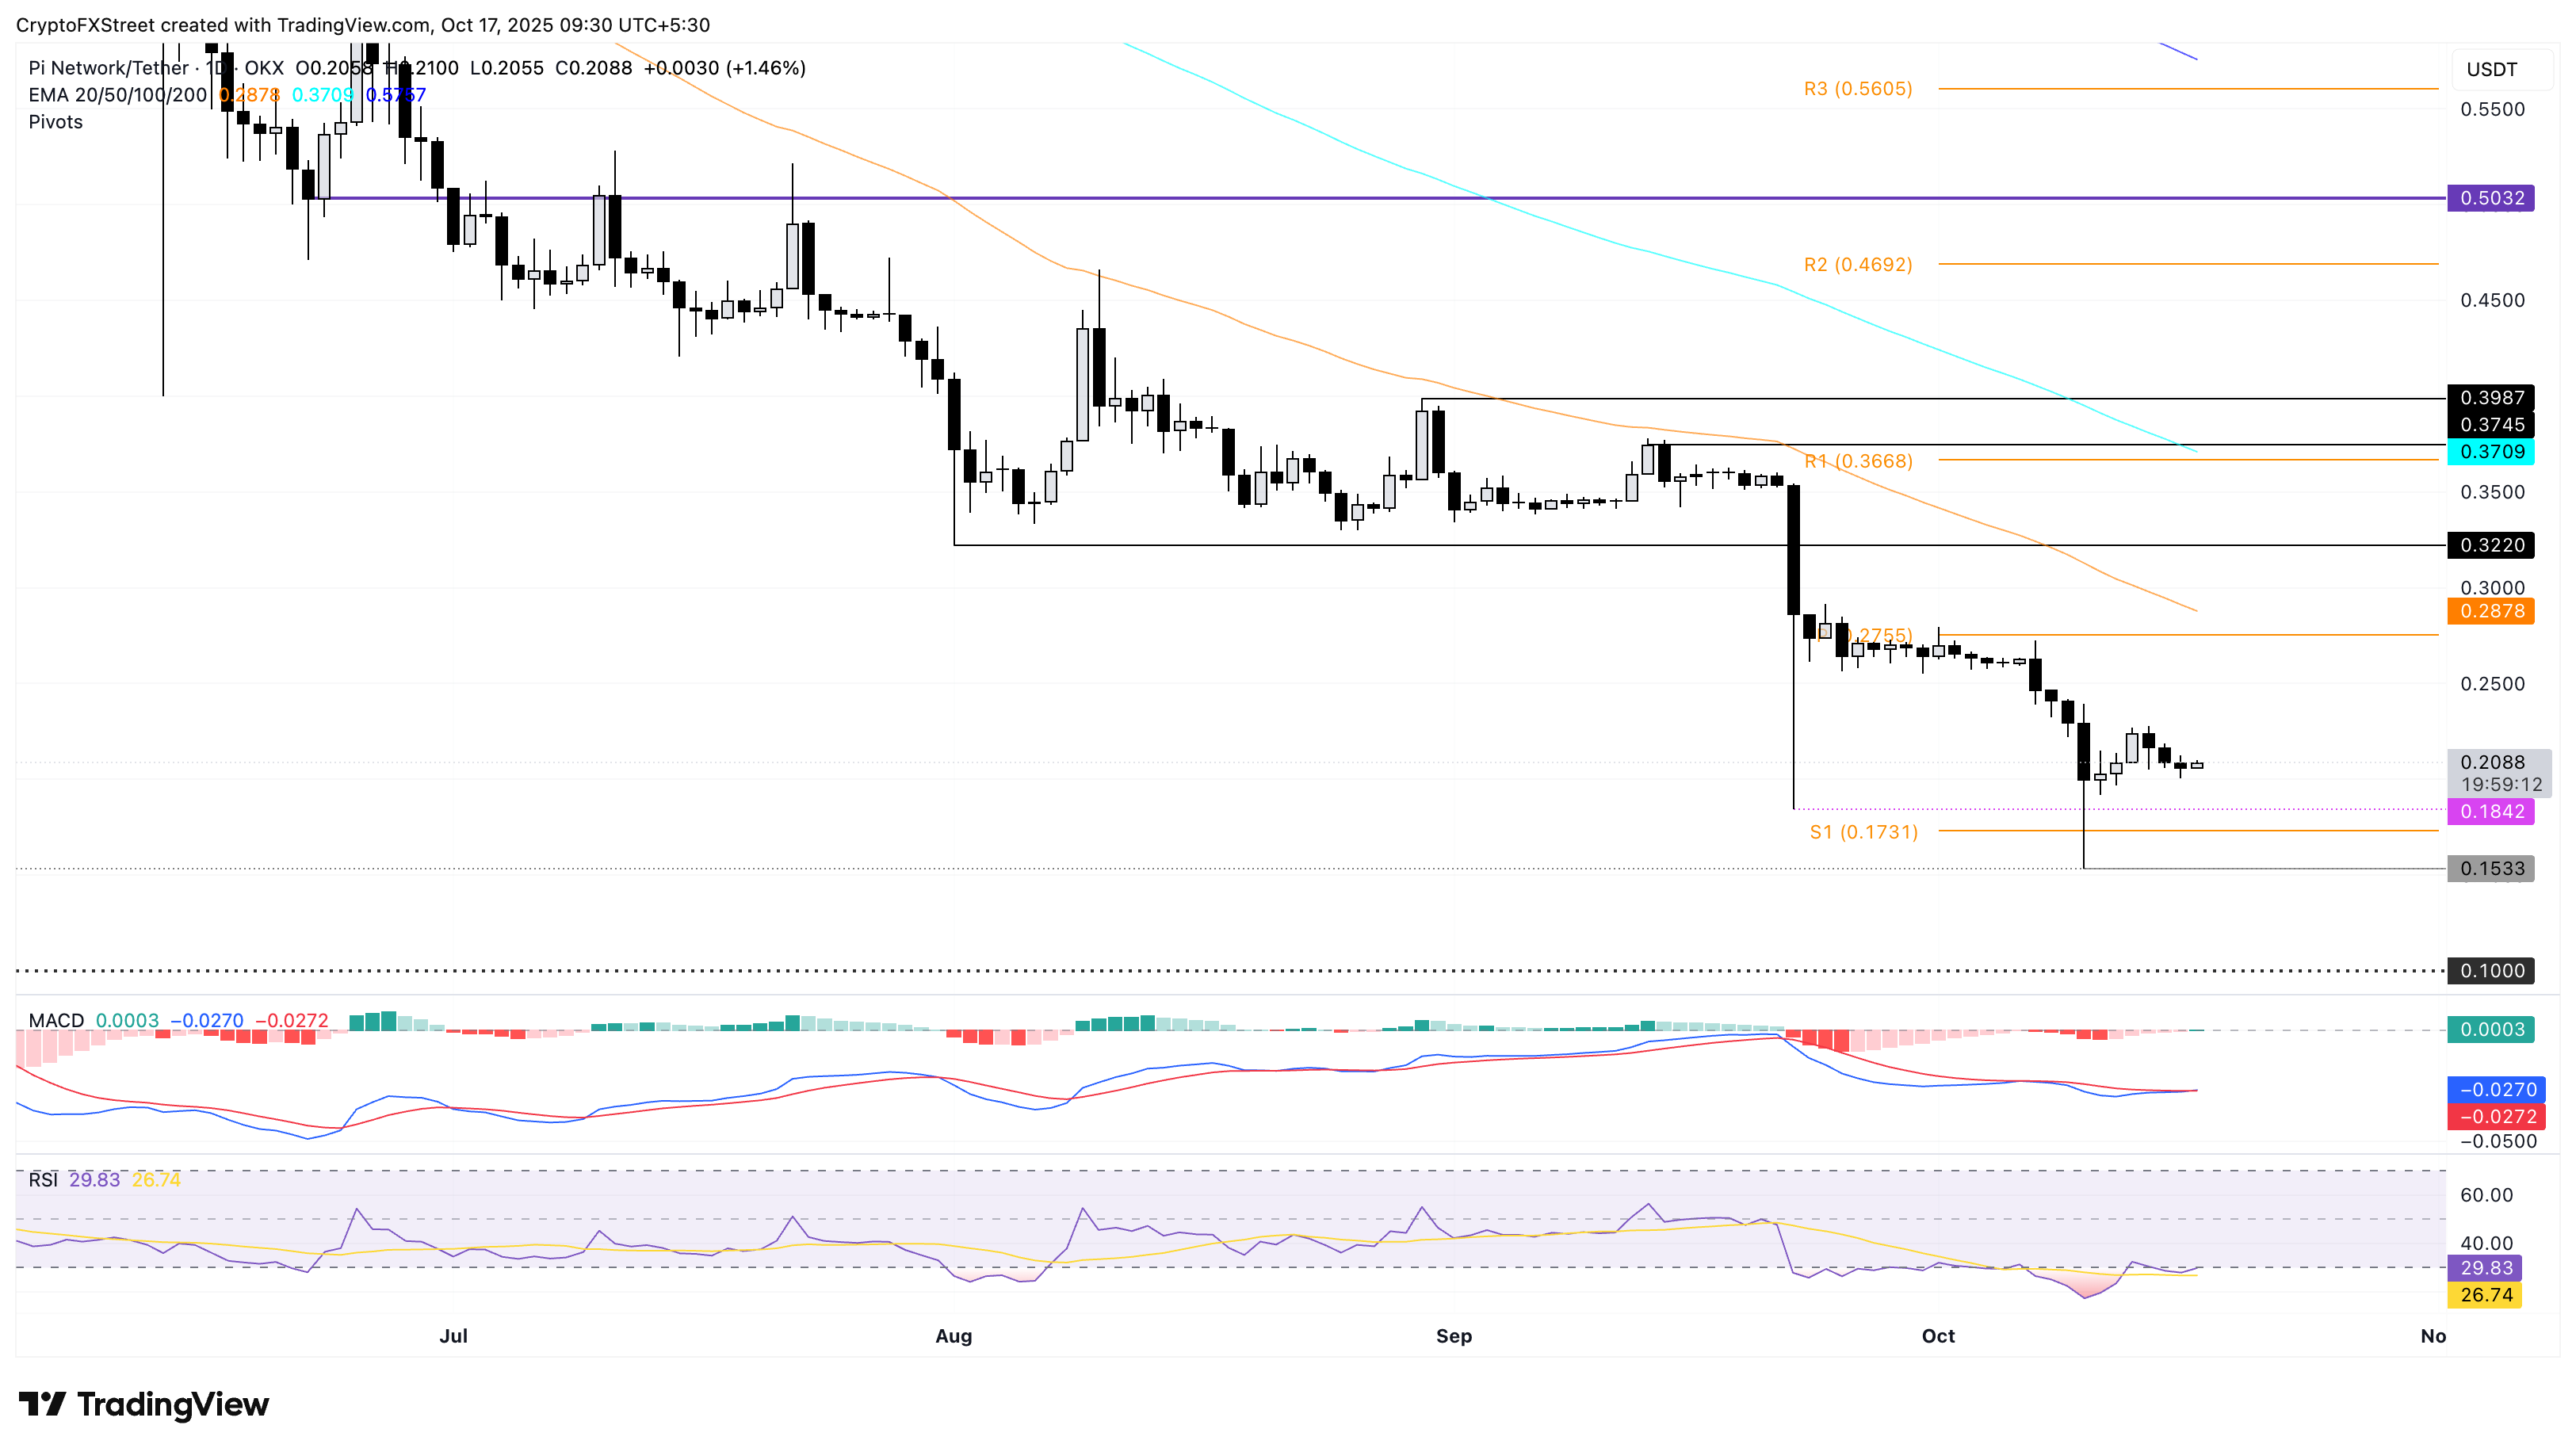
PI/USDT daily price chart.
Looking up, PI should exceed the $0.2295 level to reinforce a recovery to the centre Pivot Point level at $0.2755.
Bitcoin, altcoins, stablecoins FAQs
Bitcoin is the largest cryptocurrency by market capitalization, a virtual currency designed to serve as money. This form of payment cannot be controlled by any one person, group, or entity, which eliminates the need for third-party participation during financial transactions.
Altcoins are any cryptocurrency apart from Bitcoin, but some also regard Ethereum as a non-altcoin because it is from these two cryptocurrencies that forking happens. If this is true, then Litecoin is the first altcoin, forked from the Bitcoin protocol and, therefore, an “improved” version of it.
Stablecoins are cryptocurrencies designed to have a stable price, with their value backed by a reserve of the asset it represents. To achieve this, the value of any one stablecoin is pegged to a commodity or financial instrument, such as the US Dollar (USD), with its supply regulated by an algorithm or demand. The main goal of stablecoins is to provide an on/off-ramp for investors willing to trade and invest in cryptocurrencies. Stablecoins also allow investors to store value since cryptocurrencies, in general, are subject to volatility.
Bitcoin dominance is the ratio of Bitcoin's market capitalization to the total market capitalization of all cryptocurrencies combined. It provides a clear picture of Bitcoin’s interest among investors. A high BTC dominance typically happens before and during a bull run, in which investors resort to investing in relatively stable and high market capitalization cryptocurrency like Bitcoin. A drop in BTC dominance usually means that investors are moving their capital and/or profits to altcoins in a quest for higher returns, which usually triggers an explosion of altcoin rallies.
추천 기사


