
Pi Network Price Forecast: CEXs’ reserves drop as PI faces rejection within falling channel
- Pi Network’s reversal from the 50-day EMA marks the beginning of a potential downcycle within a falling channel pattern.
- The trading volume data of the PI token reflects stagnation.
- The CEXs' wallet balances dropped by 2.88 million in the last 24 hours.
Pi Network (PI) edges lower by 3% at press time on Monday, extending the 8% drop from Sunday within a bearish pattern on the daily chart. The downfall aligns with the stagnation in trading volume, suggesting a cooling off in traders’ activity. However, a significant net outflow from the centralized exchanges' (CEXs) wallet balances in the last 24 hours signals confidence among traders.
CEXs' outflow signals a bullish intent among traders
PiScan data shows the wallet balances of CEXs dropping by 2.88 million PI tokens over the last 24 hours, reaching a 420.90 million PI balance. Out of the five Know Your Business (KYB) aligned exchanges by Pi Foundation, the OKX exchange marked the largest outflow of 3.79 million PI tokens.
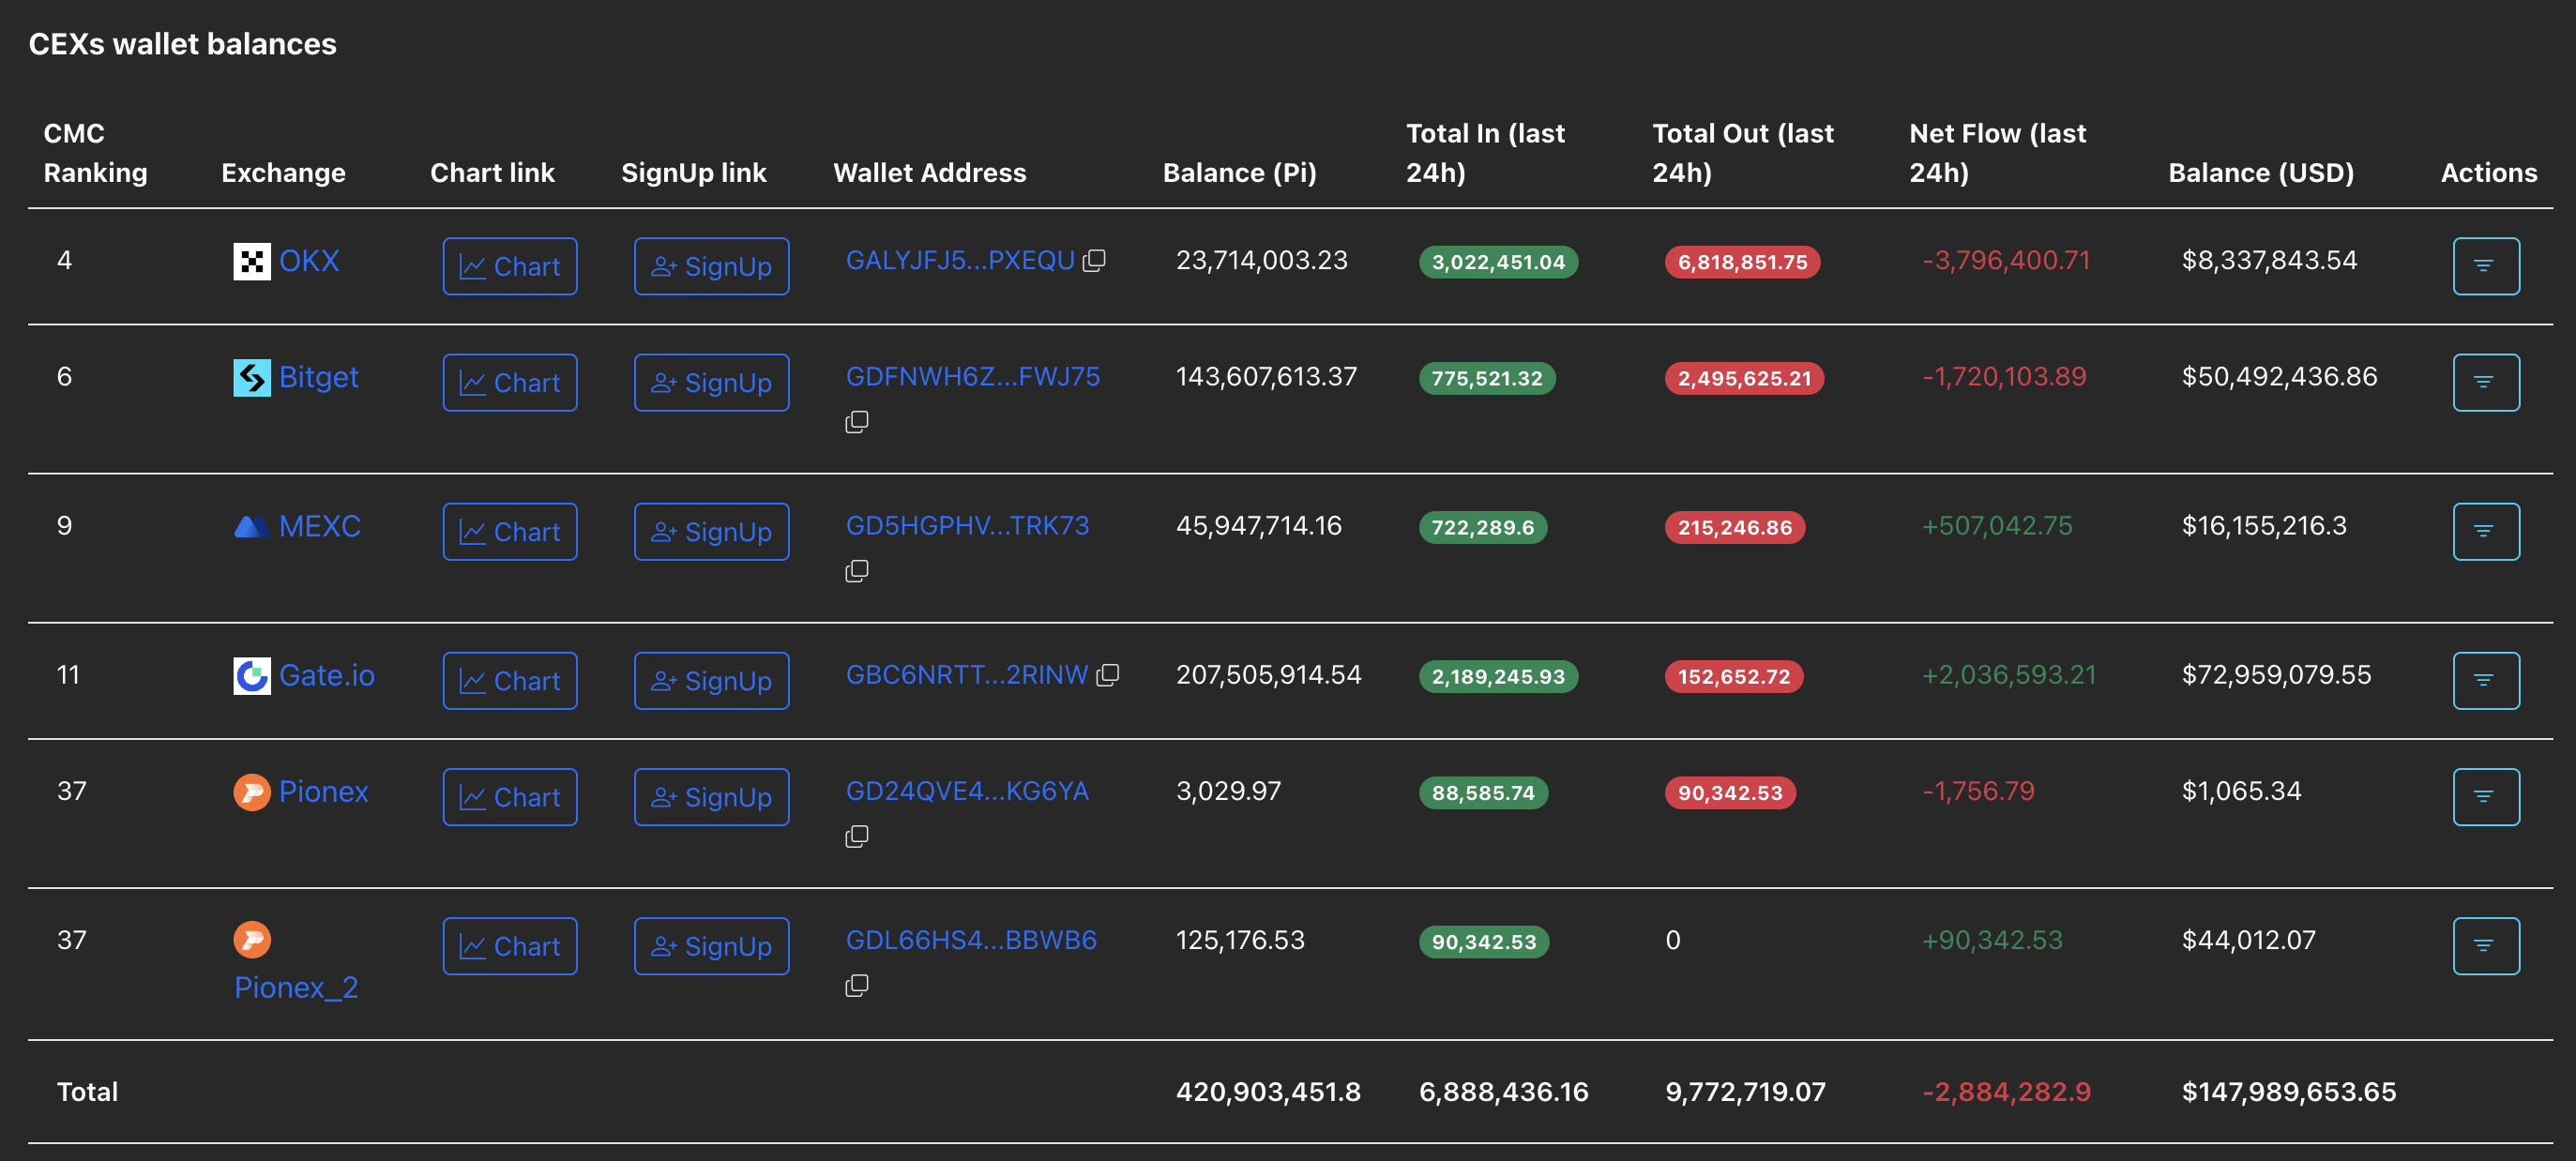
CEXs' wallet balances. Source: PiScan
The massive outflow indicates heightened withdrawals from the CEXs, signaling confidence among traders. Still, the Artemis data on daily PI token trading volume suggests a potential stagnation between $50 million and $100 million since mid-August.
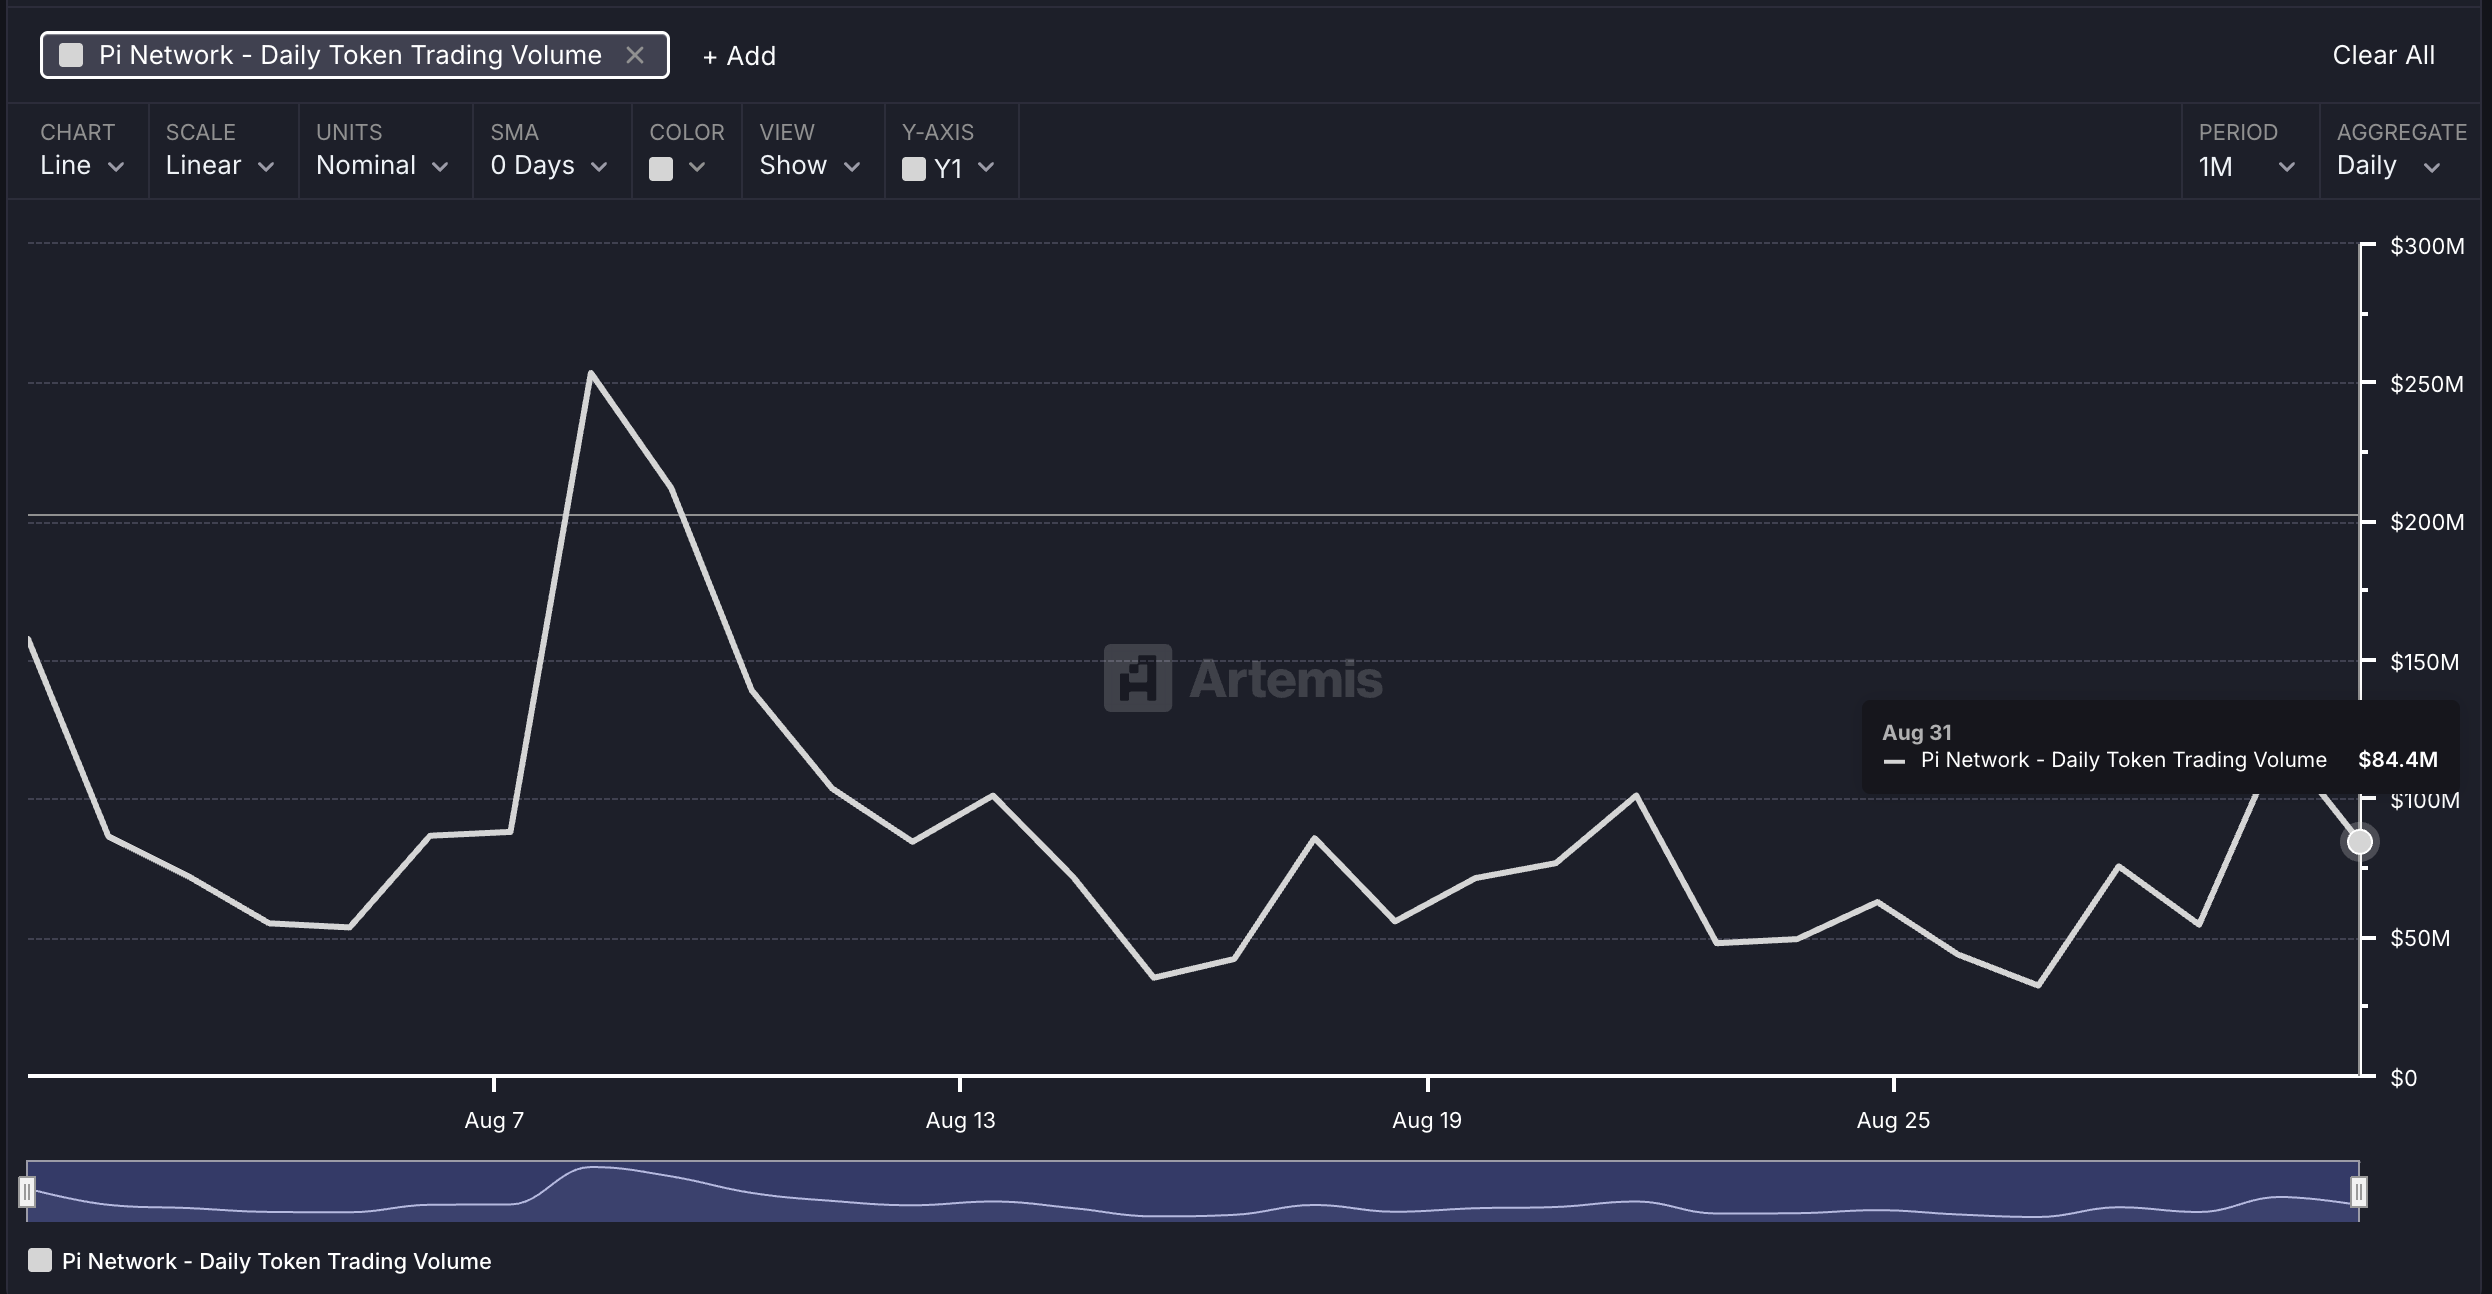
PI token daily trading volume. Source: Artemis
PI struggles with a falling channel pattern breakout
Pi Network’s short-lived recovery run in the last week peaked at $0.4000 round figure on Saturday. The PI token reversed by 8% on Sunday, further extending the downtrend by 3% so far on Monday.
The downtrend inches closer to its all-time low of $0.3220, set on August 1, with bears targeting the $0.3000 round figure.
Adding to the bearish outlook, the momentum indicators suggest increased selling pressure on the daily chart. The Relative Strength Index (RSI) at 43 drops below the halfway line, indicating a steady rise in bearishness.
Additionally, the Moving Average Convergence Divergence (MACD) inches closer to its signal line as bullish momentum declines, hinting at a potential crossover. A crossover would signal a selling opportunity for sidelined investors.
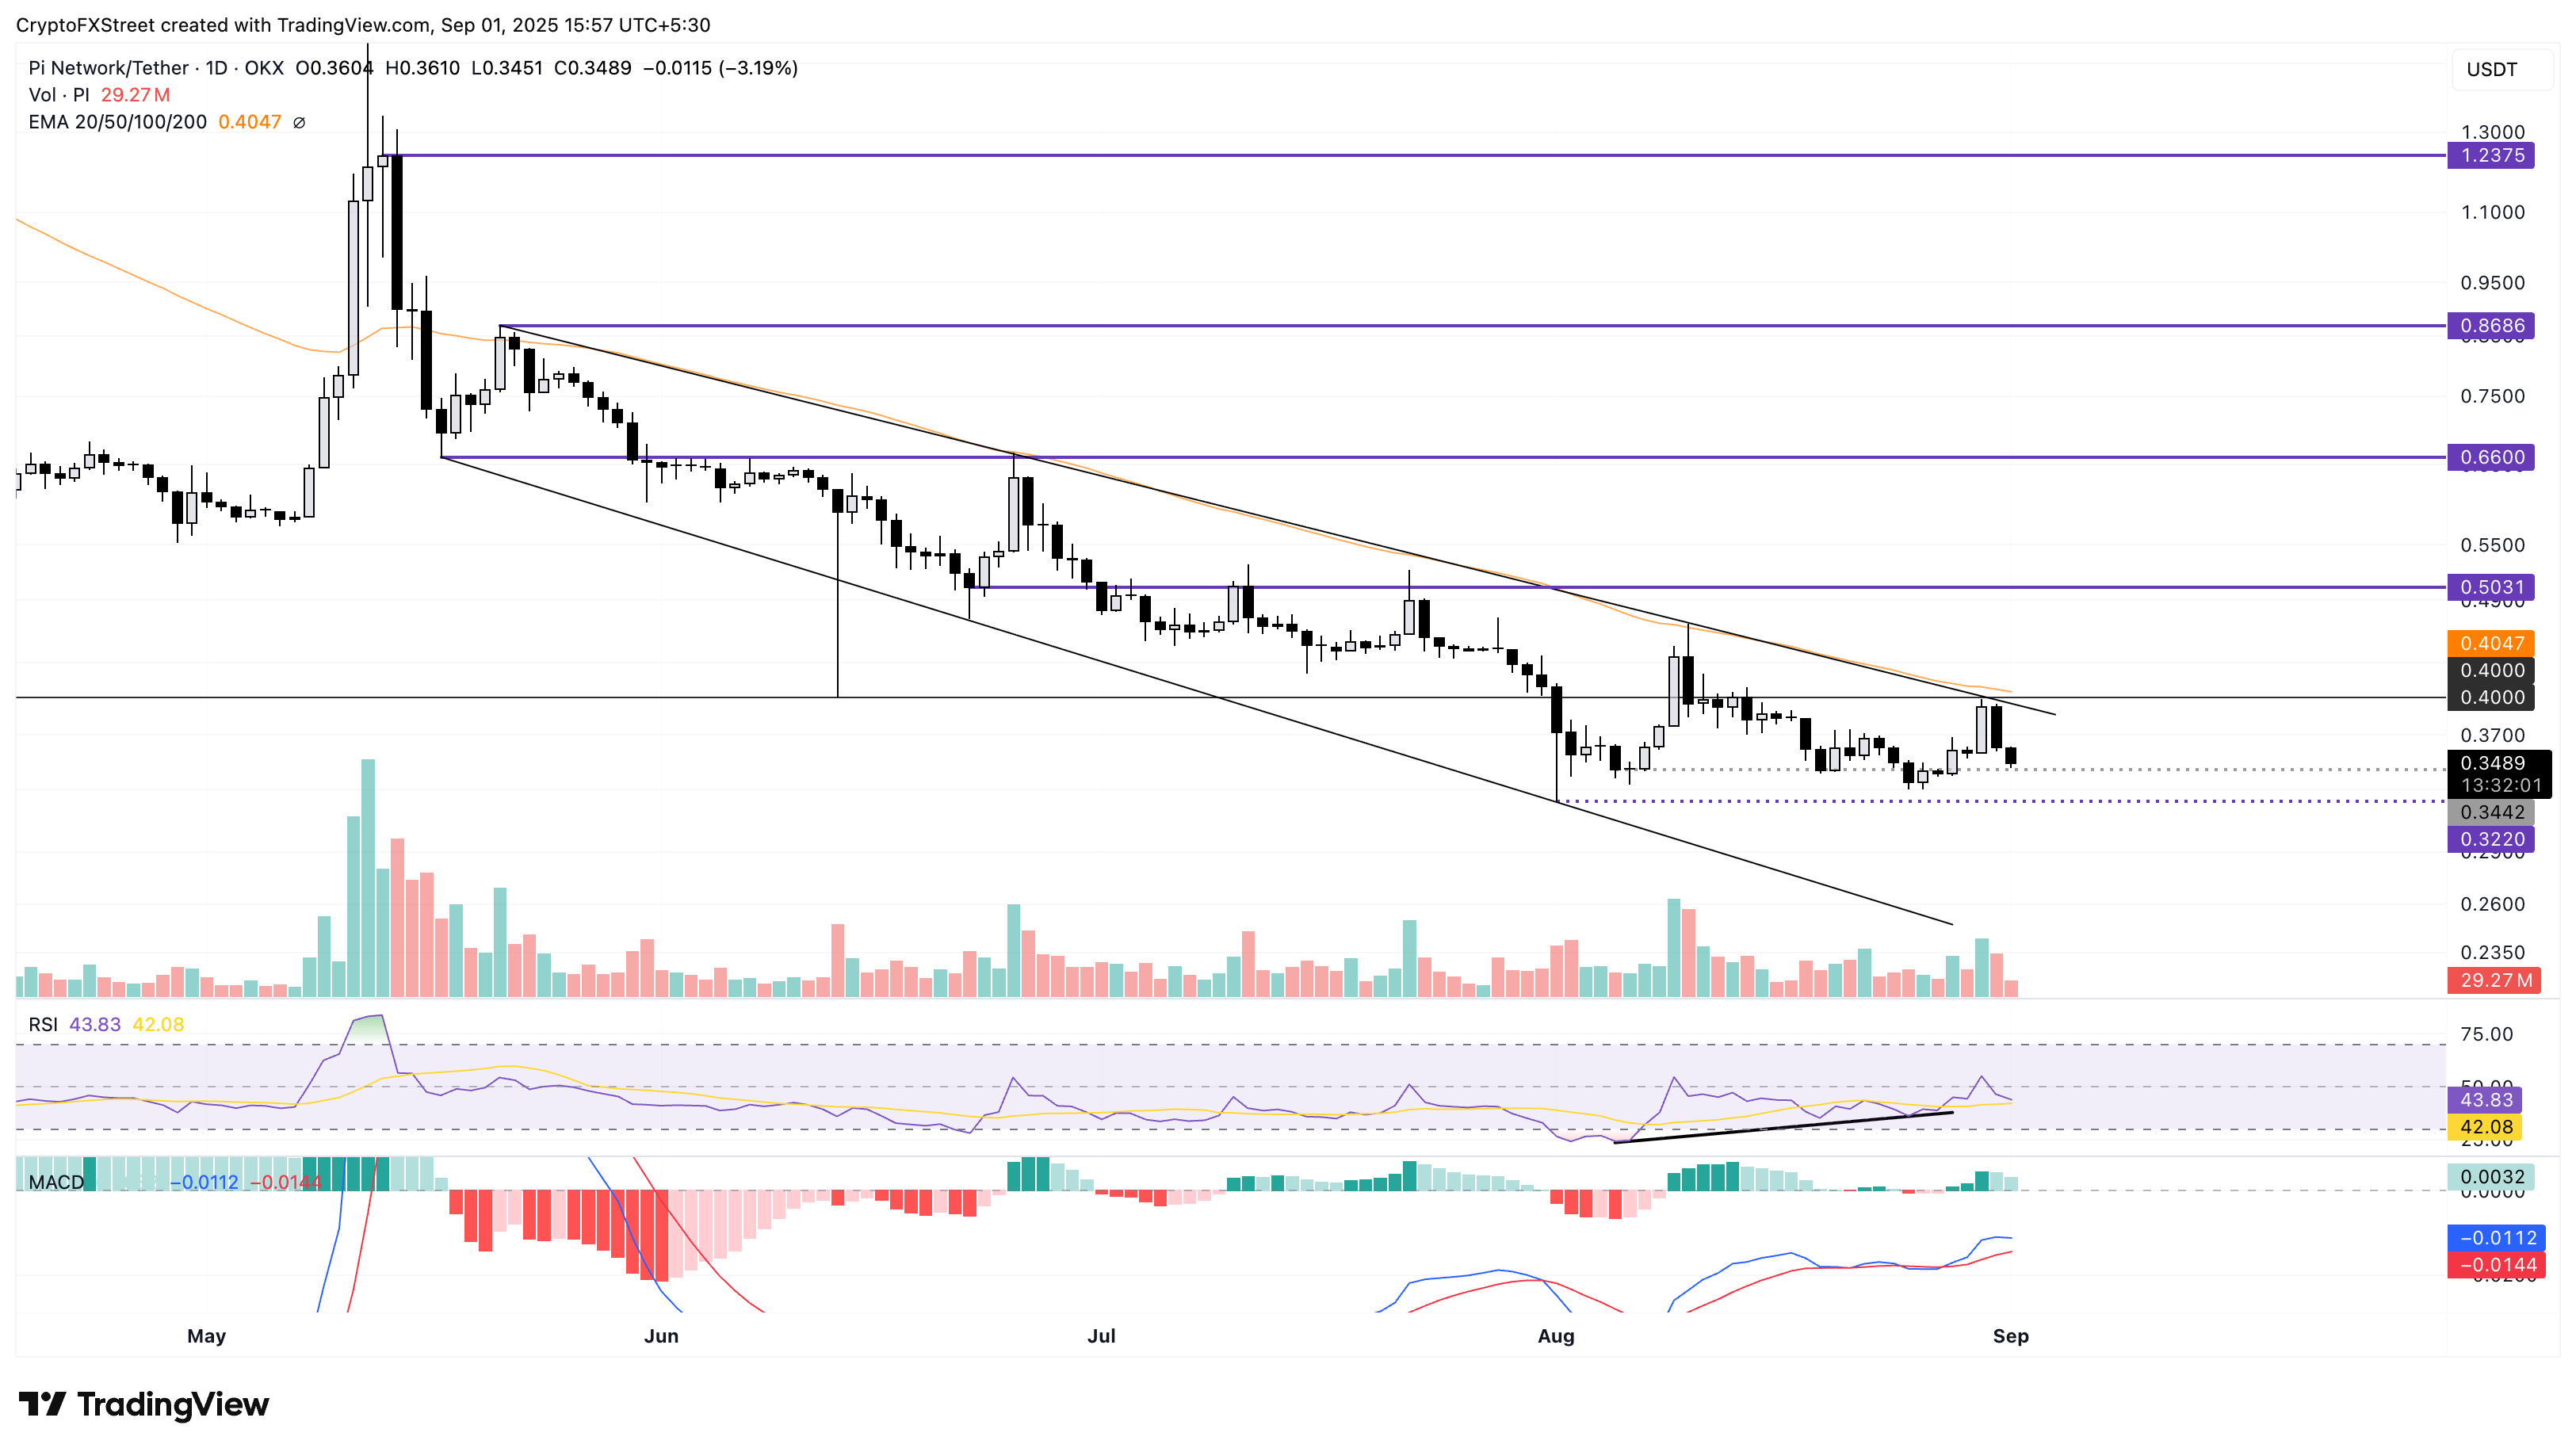
PI/USDT daily price chart.
Looking up, Pi Network should reclaim the 50-day Exponential Moving Average (EMA) at $0.4047, which is moving closely with the falling channel pattern’s overhead trendline. If so, the uptrend could target the $0.5000 psychological level.
Bitcoin, altcoins, stablecoins FAQs
Bitcoin is the largest cryptocurrency by market capitalization, a virtual currency designed to serve as money. This form of payment cannot be controlled by any one person, group, or entity, which eliminates the need for third-party participation during financial transactions.
Altcoins are any cryptocurrency apart from Bitcoin, but some also regard Ethereum as a non-altcoin because it is from these two cryptocurrencies that forking happens. If this is true, then Litecoin is the first altcoin, forked from the Bitcoin protocol and, therefore, an “improved” version of it.
Stablecoins are cryptocurrencies designed to have a stable price, with their value backed by a reserve of the asset it represents. To achieve this, the value of any one stablecoin is pegged to a commodity or financial instrument, such as the US Dollar (USD), with its supply regulated by an algorithm or demand. The main goal of stablecoins is to provide an on/off-ramp for investors willing to trade and invest in cryptocurrencies. Stablecoins also allow investors to store value since cryptocurrencies, in general, are subject to volatility.
Bitcoin dominance is the ratio of Bitcoin's market capitalization to the total market capitalization of all cryptocurrencies combined. It provides a clear picture of Bitcoin’s interest among investors. A high BTC dominance typically happens before and during a bull run, in which investors resort to investing in relatively stable and high market capitalization cryptocurrency like Bitcoin. A drop in BTC dominance usually means that investors are moving their capital and/or profits to altcoins in a quest for higher returns, which usually triggers an explosion of altcoin rallies.
추천 기사


