
Crude Oil trades stuck at $68 level ahead of API stockpile data
- Crude Oil finds a floor at around $68 but is unable to significantly bounce off it.
- OPEC’s fourth downside revision for global Crude Oil demand is just a drop on a hot plate.
- The US Dollar Index rallies further, although it faces some profit-taking.
Crude Oil trades broadly flat on Wednesday after an attempt on Tuesday to bounce off a supportive floor level near $68.00. The support came in the form of the monthly OPEC report, in which the Petroleum Exporting conglomerate penciled in a fourth downside revision to its global oil demand outlook for 2025. Markets took it as calling out the obvious, and Crude Oil is facing selling pressure again this Wednesday.
The US Dollar Index (DXY), which tracks the performance of the Greenback against six other currencies, is steady after having ticked higher earlier on Wednesday. The main focus is on the Consumer Price Index (CPI) release for October. An uptick in inflation would diminish the possibility of an interest-rate cut in December, just a day after Minneapolis Fed President Neel Kashakari warned markets that the December rate cut is not a given at all.
At the time of writing, Crude Oil (WTI) trades at $68.50 and Brent Crude at $72.25.
Oil news and market movers: Waiting for API data
- Crude inventories in the Amsterdam - Rotterdam - Antwerp region rose by 1.1 million barrels in the week ended Nov. 8 to 51.7 million barrels, Genscape data show.
- Chinese Cnooc’s Huizhou Phase II refinery halted units on Tuesday due to fluctuating production processes, according to the city’s fire department, Bloomberg reports.
- The Abadan Oil refinery in Iran has communicated that it has taken measures to keep Oil exports stable under President Donald Trump, Reuters reports.
- The American Petroleum Institute will release its weekly figures for the US Crude Stockpile change. Last week, there was a surprise build of 3.132 million barrels. Numbers are expected at 21:30 GMT.
Oil Technical Analysis: Outlook not going anywhere
Crude Oil prices are unable to catch a break and remain facing substantial selling pressure. The fact that OPEC has revised its demand outlook for a fourth time is really not moving the needle at all for Oil prices as long as nothing fundamentally changes in terms of supply and demand. Treat brief geopolitical elements as blips on the radar as the overall trend sees Crude Oil prices sliding lower in the longer term.
On the upside, The 55-day Simple Moving Average (SMA) at $70.40 is the first to be considered before the hefty technical level at $73.72, with the 100-day Simple Moving Average (SMA) and a few pivotal lines. The 200-day SMA at $76.71 is still quite far off, although it could get tested in case tensions in the Middle East arise.
Traders need to look much lower, towards $67.12 – a level that held the price in May and June 2023 – to find the first support. In case that level breaks, the 2024 year-to-date low emerges at $64.75, followed by $64.38, the low from 2023.
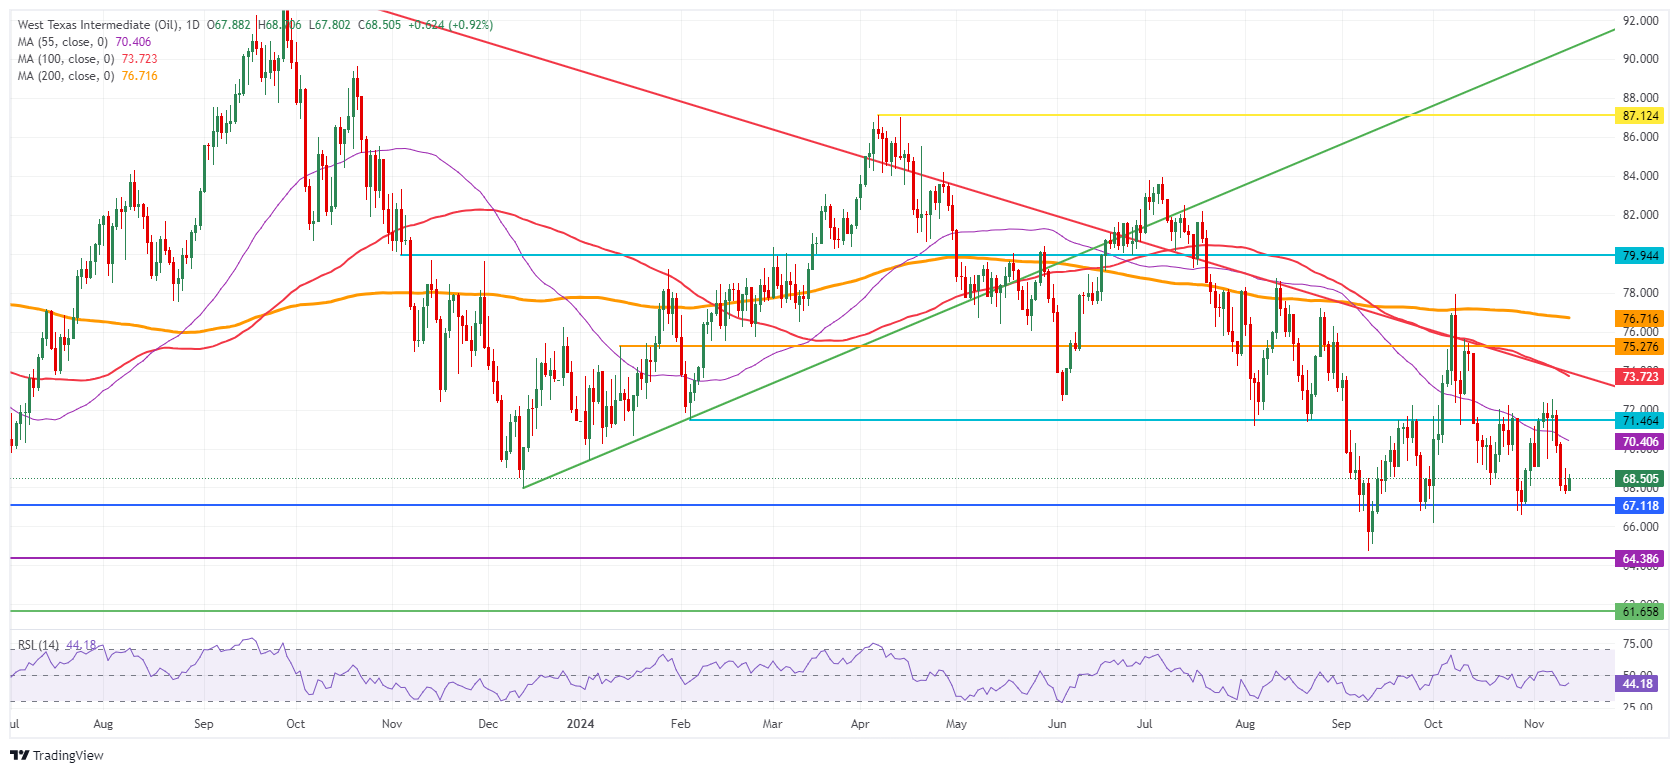
US WTI Crude Oil: Daily Chart
WTI Oil FAQs
WTI Oil is a type of Crude Oil sold on international markets. The WTI stands for West Texas Intermediate, one of three major types including Brent and Dubai Crude. WTI is also referred to as “light” and “sweet” because of its relatively low gravity and sulfur content respectively. It is considered a high quality Oil that is easily refined. It is sourced in the United States and distributed via the Cushing hub, which is considered “The Pipeline Crossroads of the World”. It is a benchmark for the Oil market and WTI price is frequently quoted in the media.
Like all assets, supply and demand are the key drivers of WTI Oil price. As such, global growth can be a driver of increased demand and vice versa for weak global growth. Political instability, wars, and sanctions can disrupt supply and impact prices. The decisions of OPEC, a group of major Oil-producing countries, is another key driver of price. The value of the US Dollar influences the price of WTI Crude Oil, since Oil is predominantly traded in US Dollars, thus a weaker US Dollar can make Oil more affordable and vice versa.
The weekly Oil inventory reports published by the American Petroleum Institute (API) and the Energy Information Agency (EIA) impact the price of WTI Oil. Changes in inventories reflect fluctuating supply and demand. If the data shows a drop in inventories it can indicate increased demand, pushing up Oil price. Higher inventories can reflect increased supply, pushing down prices. API’s report is published every Tuesday and EIA’s the day after. Their results are usually similar, falling within 1% of each other 75% of the time. The EIA data is considered more reliable, since it is a government agency.
OPEC (Organization of the Petroleum Exporting Countries) is a group of 12 Oil-producing nations who collectively decide production quotas for member countries at twice-yearly meetings. Their decisions often impact WTI Oil prices. When OPEC decides to lower quotas, it can tighten supply, pushing up Oil prices. When OPEC increases production, it has the opposite effect. OPEC+ refers to an expanded group that includes ten extra non-OPEC members, the most notable of which is Russia.
추천 기사


