
USD/CAD Price Forecast: Extends the range play below 200-day SMA, 1.4000 mark
- USD/CAD trades with a negative bias in the weekly range amid a softer USD, rising Oil prices.
- The mixed technical setup warrants some caution before placing aggressive directional bets.
- A sustained strength beyond the 1.4000 confluence will be seen as a fresh trigger for bulls.
The USD/CAD pair attracts some sellers for the second straight day on Friday, though it remains confined in a range held since the beginning of this week. Spot prices currently trade just below mid-1.3900s, down over 0.10% for the day amid a combination of negative factors.
The softer US macro data released on Thursday reaffirmed market bets for more interest rate cuts by the Federal Reserve (Fed) and keeps the US Dollar (USD) bulls on the defensive. Apart from this, a modest rise in Crude Oil prices is seen underpinning the commodity-linked Loonie and exerting some downward pressure on the USD/CAD pair.
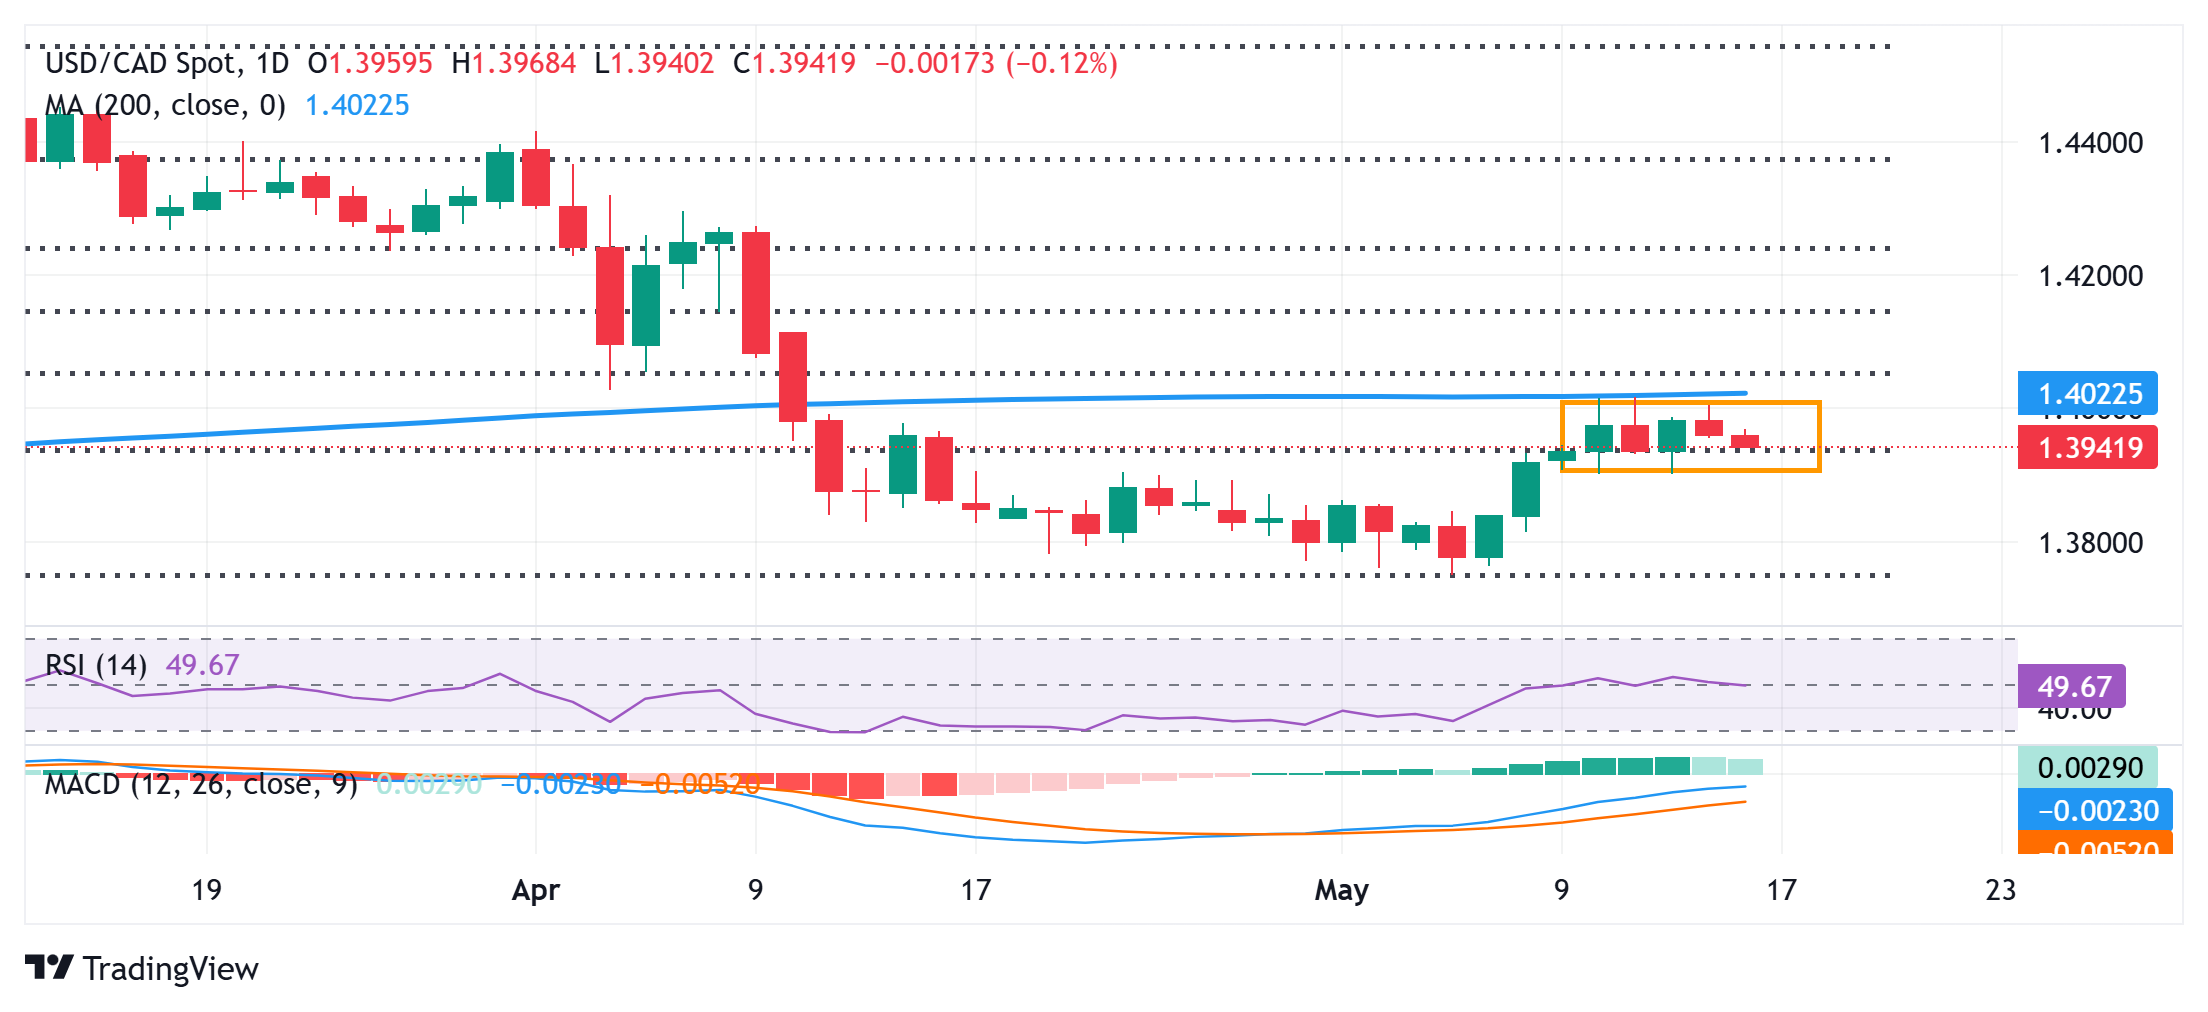
The range-bound price action might be categorized as a bullish consolidation against the backdrop of the recent bounce from the year-to-date low. However, this week's failure near the 1.4000 confluence – comprising the 200-day Simple Moving Average (SMA) and the 38.2% Fibonacci retracement level of the March-May fall – warrants some caution.
Moreover, technical indicators on the daily chart have been struggling to gain any meaningful positive traction. Hence, it will be prudent to wait for a sustained strength beyond the 1.4000 psychological mark before positioning for any further gains. The USD/CAD pair might then climb to the 1.4050 intermediate hurdle, towards the 1.4100 neighborhood.
On the flip side, the weekly trough, around the 1.3900 round figure, also marking the lower end of the short-term range, might continue to protect the immediate downside. A convincing break below might drag the USD/CAD pair to the 1.3855 region en route to the 1.3800 mark and to the year-to-date low, around the 1.3750 area touched earlier this month.
USD/CAD daily chart
Canadian Dollar FAQs
The key factors driving the Canadian Dollar (CAD) are the level of interest rates set by the Bank of Canada (BoC), the price of Oil, Canada’s largest export, the health of its economy, inflation and the Trade Balance, which is the difference between the value of Canada’s exports versus its imports. Other factors include market sentiment – whether investors are taking on more risky assets (risk-on) or seeking safe-havens (risk-off) – with risk-on being CAD-positive. As its largest trading partner, the health of the US economy is also a key factor influencing the Canadian Dollar.
The Bank of Canada (BoC) has a significant influence on the Canadian Dollar by setting the level of interest rates that banks can lend to one another. This influences the level of interest rates for everyone. The main goal of the BoC is to maintain inflation at 1-3% by adjusting interest rates up or down. Relatively higher interest rates tend to be positive for the CAD. The Bank of Canada can also use quantitative easing and tightening to influence credit conditions, with the former CAD-negative and the latter CAD-positive.
The price of Oil is a key factor impacting the value of the Canadian Dollar. Petroleum is Canada’s biggest export, so Oil price tends to have an immediate impact on the CAD value. Generally, if Oil price rises CAD also goes up, as aggregate demand for the currency increases. The opposite is the case if the price of Oil falls. Higher Oil prices also tend to result in a greater likelihood of a positive Trade Balance, which is also supportive of the CAD.
While inflation had always traditionally been thought of as a negative factor for a currency since it lowers the value of money, the opposite has actually been the case in modern times with the relaxation of cross-border capital controls. Higher inflation tends to lead central banks to put up interest rates which attracts more capital inflows from global investors seeking a lucrative place to keep their money. This increases demand for the local currency, which in Canada’s case is the Canadian Dollar.
Macroeconomic data releases gauge the health of the economy and can have an impact on the Canadian Dollar. Indicators such as GDP, Manufacturing and Services PMIs, employment, and consumer sentiment surveys can all influence the direction of the CAD. A strong economy is good for the Canadian Dollar. Not only does it attract more foreign investment but it may encourage the Bank of Canada to put up interest rates, leading to a stronger currency. If economic data is weak, however, the CAD is likely to fall.
추천 기사


