

Gold price eases as dust settles over the market mayhem
- Markets are starting to calm down after the volatile ride on Monday.
- A Fed rate cut in September is fully priced in while policymakers try to calm markets.
- The RSI is back in the middle of its range, offering room for some bulls to enter the market again.
Gold’s price (XAU/USD) stabilizes below the $2,400 level on Wednesday after easing for two consecutive days at the beginning of the week following Monday’s market mayhem. The move comes with the US Dollar (USD) starting to gain strength again after several comments from the Bank of Japan (BoJ) on Wednesday morning that could leave traders rather puzzled. US yields are jumping higher, a stronger US Dollar is in play and the stock markets are behaving positively for a second day in a row. This is ideal for a cool down in Gold’s price action and room to assess what is next.
Although this soothing sentiment in markets is not ideal for the Gold price, plenty of tail risks are still to be considered. Geopolitical tensions in the Middle East could rip through the region into a full-fledged war at any moment. Lacklustre export data from China adds to the already poor performance in the region, and the People’s Bank of China (PBoC) or its government may soon take action to boost activity, export, and economic growth again. Should US yields and its interest rate differential against other currencies widen again, XAU/USD might return to its bullish pattern from earlier this year.
Daily digest market movers: Gold price at pivotal point
- Markets are further digesting and recovering from Monday’s turn of events in the different asset classes in financial markets. This Wednesday looks to be a second consecutive day of recovery this week, with several major assets heading back to their starting position pre-Monday.
- The US 10-year yield is also recovering and even returning to 4%, trading around 3.90% on Wednesday. The interest rate differentials between the United States (US) and other major countries are widening again in favor of the Greenback.
- At one point this week, the CME Fedwatch tool started pricing in emergency interest rate cuts from the US Federal Reserve (Fed). However, the Fed and its Chairman, Jerome Powell, have made it very clear on previous occasions that the central bank will not act on a single turn of events to save the day for equity markets. Concerns amongst traders on a possible Fed policy mistake are growing.
- The Lebanese group Hezbollah launched a series of drone and rocket attacks against Israel on Tuesday in retaliation for Israel’s reported killings of a top Hezbollah commander and Hamas leader last week. A counter-reaction from Israel is to be expected.
- Chinese export data showed only 7.0% growth year-over-year in July, down from 8.6% a month earlier and missing the 9.7% expected by analysts. Chinese imports rose substantially by 7.2%, above the 3.5% expected.
Technical Analysis: Gold’s bullish triangle still intact
From a technical point of view, Gold price looks to be at the right moment for a buy. Since the end of July, XAU/USD has not fallen below the 55-day Simple Moving Average (SMA), and when it did on Monday, it bounced off the moving average to the tick. With price action now back above the green ascending trend line in the chart below, a test to the upside near the all-time high of $2,483.75 is the logical next move, where a breakout could see Gold swirl to $2,600.00.
On the downside, breaking the green ascending trend line and the 55-day SMA would mean issues ahead. The 100-day SMA might still be able to catch any excursions lower at $2,344.54. If that level gives way, a wider area opens up. Gold could lose over 2% from breaking below the 100-day SMA and heading to the pivotal support held throughout spring and summer, near $2,281.28.
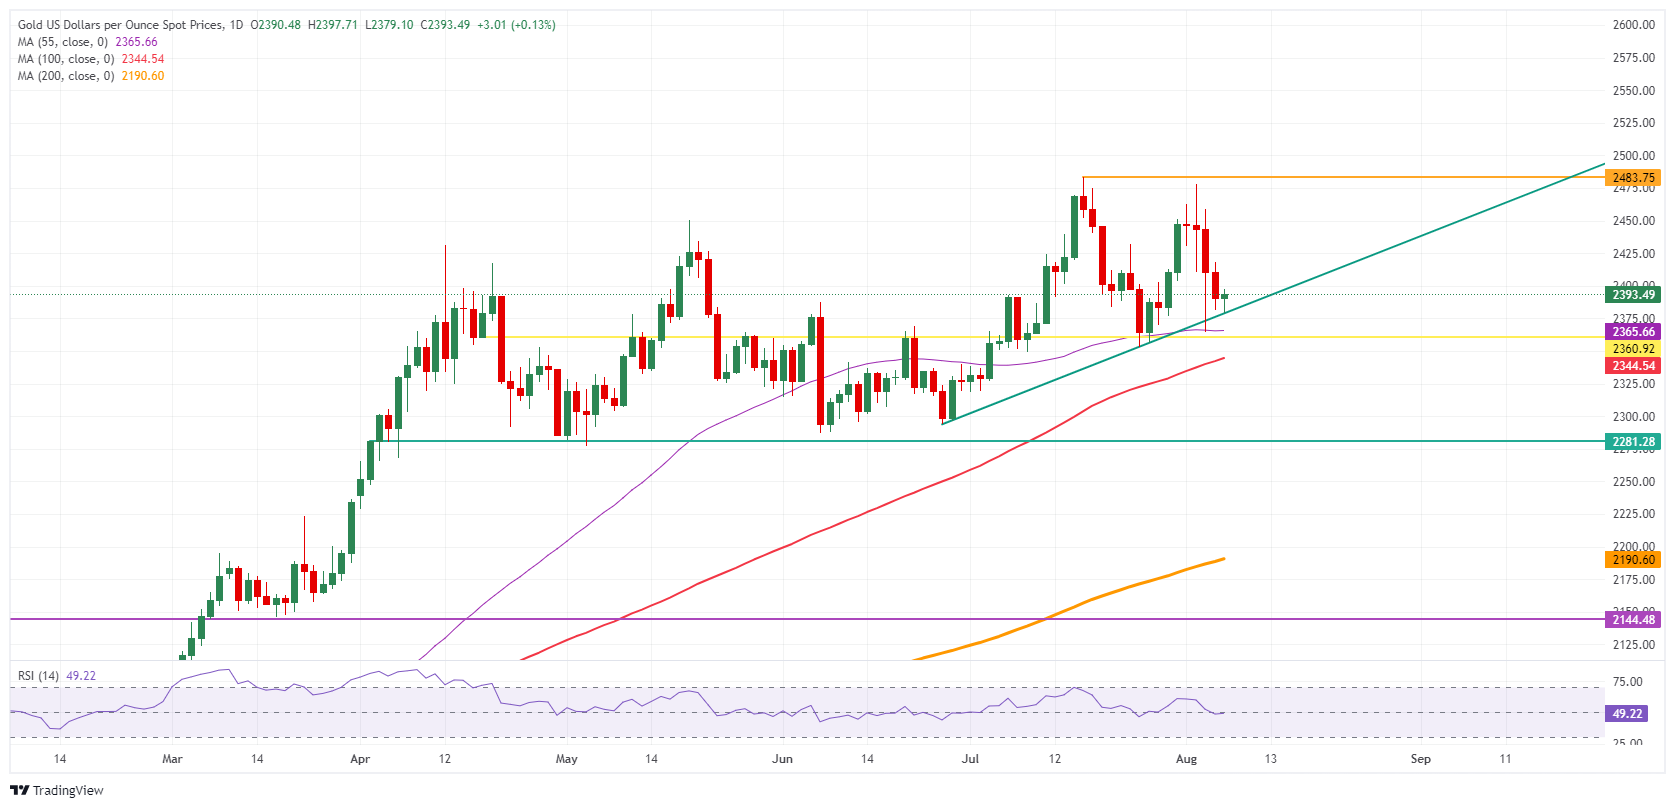
XAU/USD: Daily Chart
Gold FAQs
Gold has played a key role in human’s history as it has been widely used as a store of value and medium of exchange. Currently, apart from its shine and usage for jewelry, the precious metal is widely seen as a safe-haven asset, meaning that it is considered a good investment during turbulent times. Gold is also widely seen as a hedge against inflation and against depreciating currencies as it doesn’t rely on any specific issuer or government.
Central banks are the biggest Gold holders. In their aim to support their currencies in turbulent times, central banks tend to diversify their reserves and buy Gold to improve the perceived strength of the economy and the currency. High Gold reserves can be a source of trust for a country’s solvency. Central banks added 1,136 tonnes of Gold worth around $70 billion to their reserves in 2022, according to data from the World Gold Council. This is the highest yearly purchase since records began. Central banks from emerging economies such as China, India and Turkey are quickly increasing their Gold reserves.
Gold has an inverse correlation with the US Dollar and US Treasuries, which are both major reserve and safe-haven assets. When the Dollar depreciates, Gold tends to rise, enabling investors and central banks to diversify their assets in turbulent times. Gold is also inversely correlated with risk assets. A rally in the stock market tends to weaken Gold price, while sell-offs in riskier markets tend to favor the precious metal.
The price can move due to a wide range of factors. Geopolitical instability or fears of a deep recession can quickly make Gold price escalate due to its safe-haven status. As a yield-less asset, Gold tends to rise with lower interest rates, while higher cost of money usually weighs down on the yellow metal. Still, most moves depend on how the US Dollar (USD) behaves as the asset is priced in dollars (XAU/USD). A strong Dollar tends to keep the price of Gold controlled, whereas a weaker Dollar is likely to push Gold prices up.
추천 기사


