

Gold rises as Trump extends Iran ceasefire amid stalled peace talks
- Gold rebounds from one-week lows, but gains remain limited amid higher-for-longer rate expectations from the Federal Reserve.
- US President Donald Trump extends the ceasefire with Iran after stalled negotiations.
- Technically, XAU/USD remains capped below the 50-day SMA, with the 100-day SMA acting as immediate support.
Gold (XAU/USD) rebounds on Wednesday, trimming a portion of the losses recorded on the previous day. The move follows the announcement by US President Donald Trump extending the ceasefire with Iran just hours before it was due to expire. At the time of writing, XAU/USD is trading around $4,750, recovering from a one-week low of $4,668 touched on Tuesday.
Trump extends ceasefire but keeps naval blockade in place
The ceasefire extension comes after Iranian leaders rejected negotiations “under the shadow of threats” and refused to attend the second round of peace talks expected in Pakistan. Donald Trump said the decision was made at the request of Pakistan’s leadership to allow time for Iran to present a unified proposal for negotiations.
However, the US has not lifted the naval blockade of Iranian ports. “I have therefore directed our Military to continue the Blockade… and will extend the Ceasefire until such time as their proposal is submitted, and discussions are concluded, one way or the other,” Trump said in a Truth Social post.
The ceasefire has done little to bring clarity, with both sides still far from any meaningful settlement. Iran has not formally accepted the extension, and with the naval blockade still in place, it remains unclear whether Tehran will return to the negotiating table.
Gold struggles as higher-for-longer rate outlook persists
While not a lasting solution in the Middle East crisis, the extension of the ceasefire has calmed immediate fears and supported a modest recovery in bullion. Since the US-Iran war began, Gold has behaved more like a risk-sensitive asset, with price action largely driven by moves in the US Dollar (USD) and Oil prices.
At the same time, fading expectations of Federal Reserve (Fed) interest rate cuts amid rising inflation risks from higher energy costs continue to act as a headwind, limiting any meaningful recovery in the Gold price, with the metal still down nearly 10% since the onset of the war.
Oil prices remain elevated, showing little reaction to the ceasefire news, as supply through the Strait of Hormuz remains largely restricted. Recent US data highlight the impact of higher energy costs, with Retail Sales rising by 1.7% MoM in March after a 0.7% increase in February, while the Consumer Price Index (CPI) jumped 0.9% MoM, accelerating sharply from 0.3% previously.
This backdrop supports expectations that the Fed may delay rate cuts and keep borrowing costs higher for longer. Looking ahead, the US economic calendar is relatively light on Wednesday, leaving traders focused on geopolitical headlines for fresh direction.
Technical analysis: XAU/USD holds above key SMAs but lacks bullish conviction
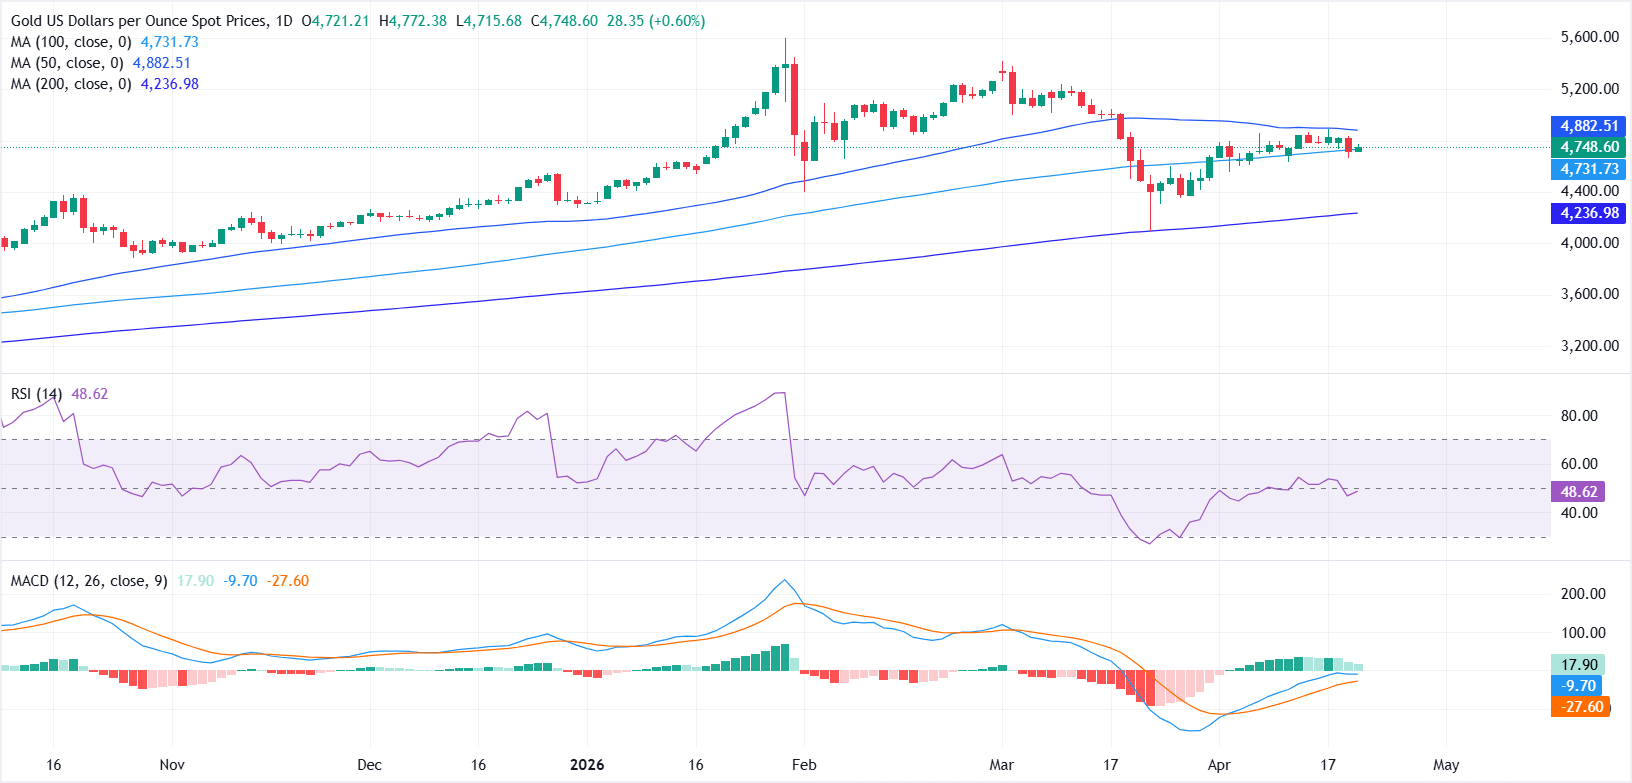
In the daily chart, XAU/USD holds above the 100-day Simple Moving Average (SMA) at $4,731 and the 200-day SMA at $4,236, keeping the broader trend underpinned, but it remains capped beneath the 50-day SMA at $4,882, which limits immediate topside traction. The Relative Strength Index (RSI) at 48 sits near neutral territory, while the Moving Average Convergence Divergence (MACD) indicator is positive, together suggesting balanced momentum after the recent pullback.
On the topside, initial resistance comes at the 50-day SMA near $4,882; a clear break above this barrier would open the way for a more convincing recovery phase. On the downside, immediate support is located at the 100-day SMA around $4,731, with a deeper floor at the 200-day SMA near $4,237.
(The technical analysis of this story was written with the help of an AI tool.)
Gold FAQs
Gold has played a key role in human’s history as it has been widely used as a store of value and medium of exchange. Currently, apart from its shine and usage for jewelry, the precious metal is widely seen as a safe-haven asset, meaning that it is considered a good investment during turbulent times. Gold is also widely seen as a hedge against inflation and against depreciating currencies as it doesn’t rely on any specific issuer or government.
Central banks are the biggest Gold holders. In their aim to support their currencies in turbulent times, central banks tend to diversify their reserves and buy Gold to improve the perceived strength of the economy and the currency. High Gold reserves can be a source of trust for a country’s solvency. Central banks added 1,136 tonnes of Gold worth around $70 billion to their reserves in 2022, according to data from the World Gold Council. This is the highest yearly purchase since records began. Central banks from emerging economies such as China, India and Turkey are quickly increasing their Gold reserves.
Gold has an inverse correlation with the US Dollar and US Treasuries, which are both major reserve and safe-haven assets. When the Dollar depreciates, Gold tends to rise, enabling investors and central banks to diversify their assets in turbulent times. Gold is also inversely correlated with risk assets. A rally in the stock market tends to weaken Gold price, while sell-offs in riskier markets tend to favor the precious metal.
The price can move due to a wide range of factors. Geopolitical instability or fears of a deep recession can quickly make Gold price escalate due to its safe-haven status. As a yield-less asset, Gold tends to rise with lower interest rates, while higher cost of money usually weighs down on the yellow metal. Still, most moves depend on how the US Dollar (USD) behaves as the asset is priced in dollars (XAU/USD). A strong Dollar tends to keep the price of Gold controlled, whereas a weaker Dollar is likely to push Gold prices up.
추천 기사


