

Gold hovers below $4,600 as traders weigh Mideast de-escalation hopes and interest rate outlook
- Gold set for worst monthly drop since October 2008 amid Middle East turmoil.
- US Dollar holds near ten-month highs, limiting strong follow-through buying in XAU/USD.
- Technically, XAU/USD remains mildly bullish within an ascending triangle on the 4-hour chart.
Gold (XAU/USD) trades with an upside bias on Tuesday, on hopes of de-escalation in the Middle East conflict. However, price action remains trapped in a one-week-old trading range, reflecting indecision among traders amid mixed signals on geopolitical developments, a firm US Dollar (USD), and shifting expectations around Federal Reserve (Fed) monetary policy path.
At the time of writing, XAU/USD is trading around $4,483, after briefly climbing above the $4,600 mark during the Asian session. The US Dollar Index (DXY), which tracks the Greenback's value against a basket of six major currencies, is trading near 100.33, easing slightly after touching ten-month highs of 100.64.
Middle East headlines keep markets cautious
The Wall Street Journal reported on Tuesday that Donald Trump has decided he is willing to end the US military campaign against Iran even if the Strait of Hormuz remains largely closed, raising hopes that the conflict could end soon.
However, the report also noted that he has decided the US should still achieve its main goals of degrading Iran’s naval and missile capabilities and continue diplomatic pressure to restore trade flows, keeping tensions elevated.
Trump, posting on Truth Social, criticized France for not allowing US military supply flights to pass through its airspace, calling the country “very unhelpful.” He also aimed at allies such as the United Kingdom, urging them to secure their own energy supplies amid disruptions in the Strait of Hormuz.
Meanwhile, a parliamentary committee in Iran has approved plans to impose tolls on shipping through the Strait of Hormuz, according to the Fars News Agency, citing the Islamic Revolutionary Guard Corps.
Macro headwinds weigh on Gold
As the war continues to escalate and Oil prices remain elevated, fueling inflation concerns, Gold is not behaving like a typical safe-haven or inflation hedge. Instead, price action is being driven by higher-for-longer interest rate expectations globally and sustained demand for the USD, with the metal now on track to post its worst monthly decline since October 2008.
At the same time, markets are beginning to push back earlier expectations of rate hikes, as traders grow concerned that rising Oil prices could slow economic growth even as they keep inflation high, creating a policy dilemma for major economies.
According to the CME FedWatch Tool, markets expect the Fed to keep interest rates unchanged at 3.50%-3.75% through 2026. A higher interest rate environment reduces the appeal of non-yielding assets such as Gold.
In the near term, Gold is likely to remain range-bound with a slight downside bias unless a clear end to the US-Iran conflict leads to a meaningful decline in Oil prices and a shift in interest rate expectations.
Technical analysis: XAU/USD eyes breakout above $4,600
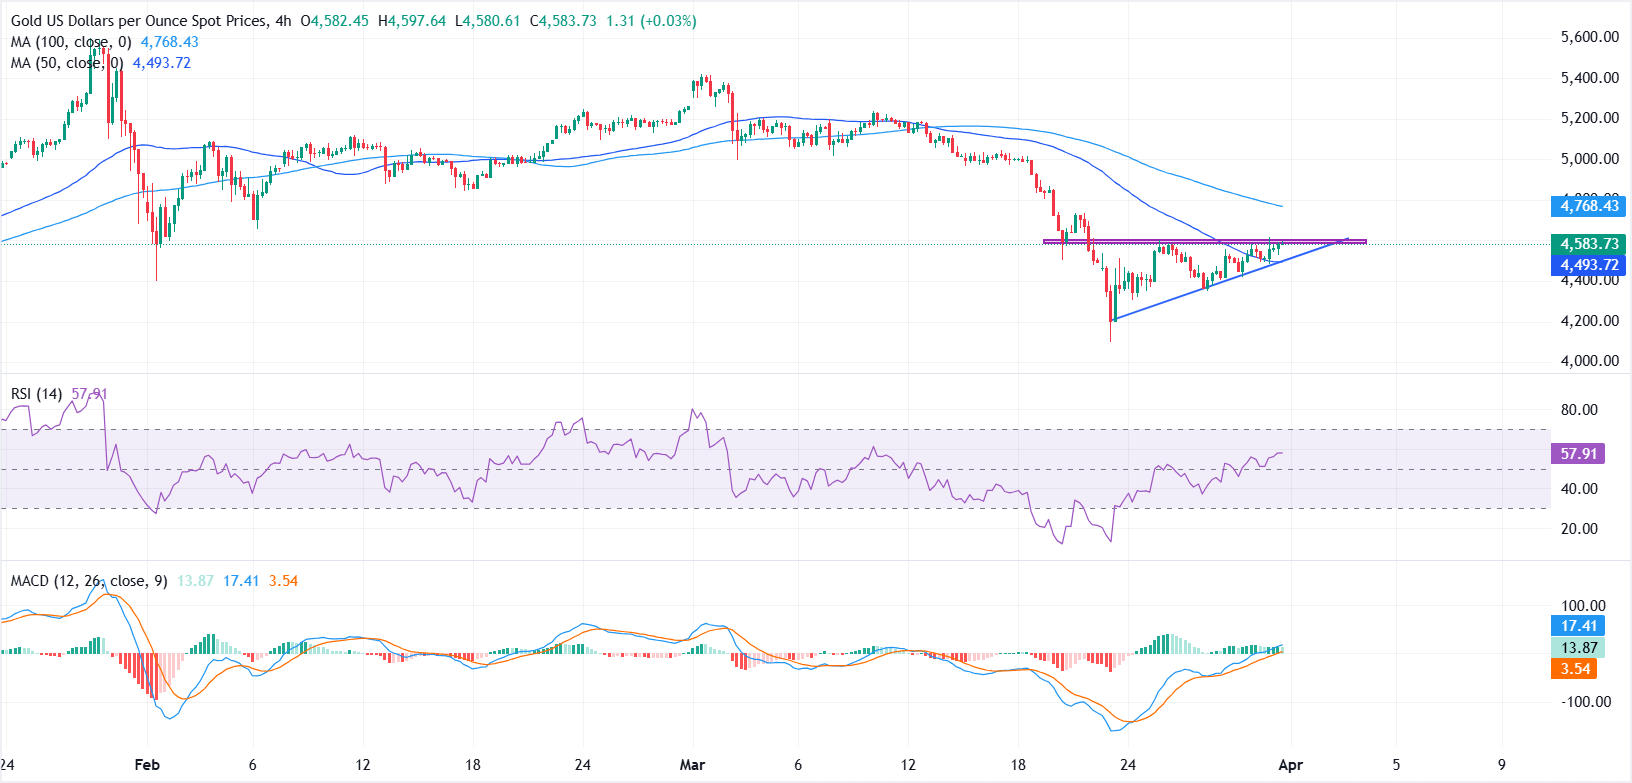
From a technical perspective, XAU/USD appears mildly bullish in the near term. On the 4-hour chart, an ascending triangle pattern is forming, suggesting building upside pressure. Spot now trades above the 50-period Simple Moving Average (SMA) at $4,494, which is acting as immediate support.
The Relative Strength Index (RSI) holds above the 50 mark, signaling building upside momentum, while the Moving Average Convergence Divergence (MACD) remains in positive territory, with the MACD line above its signal line and a modestly positive histogram suggesting buyers retain control in the current move.
On the upside, a clear break above the upper boundary of the triangle, near the $4,600 zone, could open the door for a move toward the 100-period SMA at $4,773.
On the downside, a break below the 50-period SMA at $4,494 could find support in the $4,300-$4,400 zone, followed by the March swing low near $4,100.
Gold FAQs
Gold has played a key role in human’s history as it has been widely used as a store of value and medium of exchange. Currently, apart from its shine and usage for jewelry, the precious metal is widely seen as a safe-haven asset, meaning that it is considered a good investment during turbulent times. Gold is also widely seen as a hedge against inflation and against depreciating currencies as it doesn’t rely on any specific issuer or government.
Central banks are the biggest Gold holders. In their aim to support their currencies in turbulent times, central banks tend to diversify their reserves and buy Gold to improve the perceived strength of the economy and the currency. High Gold reserves can be a source of trust for a country’s solvency. Central banks added 1,136 tonnes of Gold worth around $70 billion to their reserves in 2022, according to data from the World Gold Council. This is the highest yearly purchase since records began. Central banks from emerging economies such as China, India and Turkey are quickly increasing their Gold reserves.
Gold has an inverse correlation with the US Dollar and US Treasuries, which are both major reserve and safe-haven assets. When the Dollar depreciates, Gold tends to rise, enabling investors and central banks to diversify their assets in turbulent times. Gold is also inversely correlated with risk assets. A rally in the stock market tends to weaken Gold price, while sell-offs in riskier markets tend to favor the precious metal.
The price can move due to a wide range of factors. Geopolitical instability or fears of a deep recession can quickly make Gold price escalate due to its safe-haven status. As a yield-less asset, Gold tends to rise with lower interest rates, while higher cost of money usually weighs down on the yellow metal. Still, most moves depend on how the US Dollar (USD) behaves as the asset is priced in dollars (XAU/USD). A strong Dollar tends to keep the price of Gold controlled, whereas a weaker Dollar is likely to push Gold prices up.
추천 기사


