

Gold Price Forecast: XAU/USD is pushing against $4,150 resistance area
- Gold remains bid amid US Dollar weakness, with bulls pushing against $4,150 resistance area
- The Dollar eases as investors eye the end of the US government's closure.
- The US Senate reached a deal to resume us government funding on Monday.
Gold (XAU/USD) is trading higher for the third consecutive day on Tuesday, with bulls pushing against the $4,150 resistance area at the time of writing.. A somewhat softer US Dollar in moderate risk-on markets is underpinning precious metals as investors await developments on US government funding.
reacted
The US Dollar Index, which measures the value of the Greenback against a basket of currencies, reacted negatively to news reporting that the US Senate had reached a deal to end the largest government shutdown in history on Monday. The bill will be sent to the House, where it is expected to pass smoothly before being signed by President Trump, probably as soon as Wednesday.
Technical indicators show a growing bullish momentum
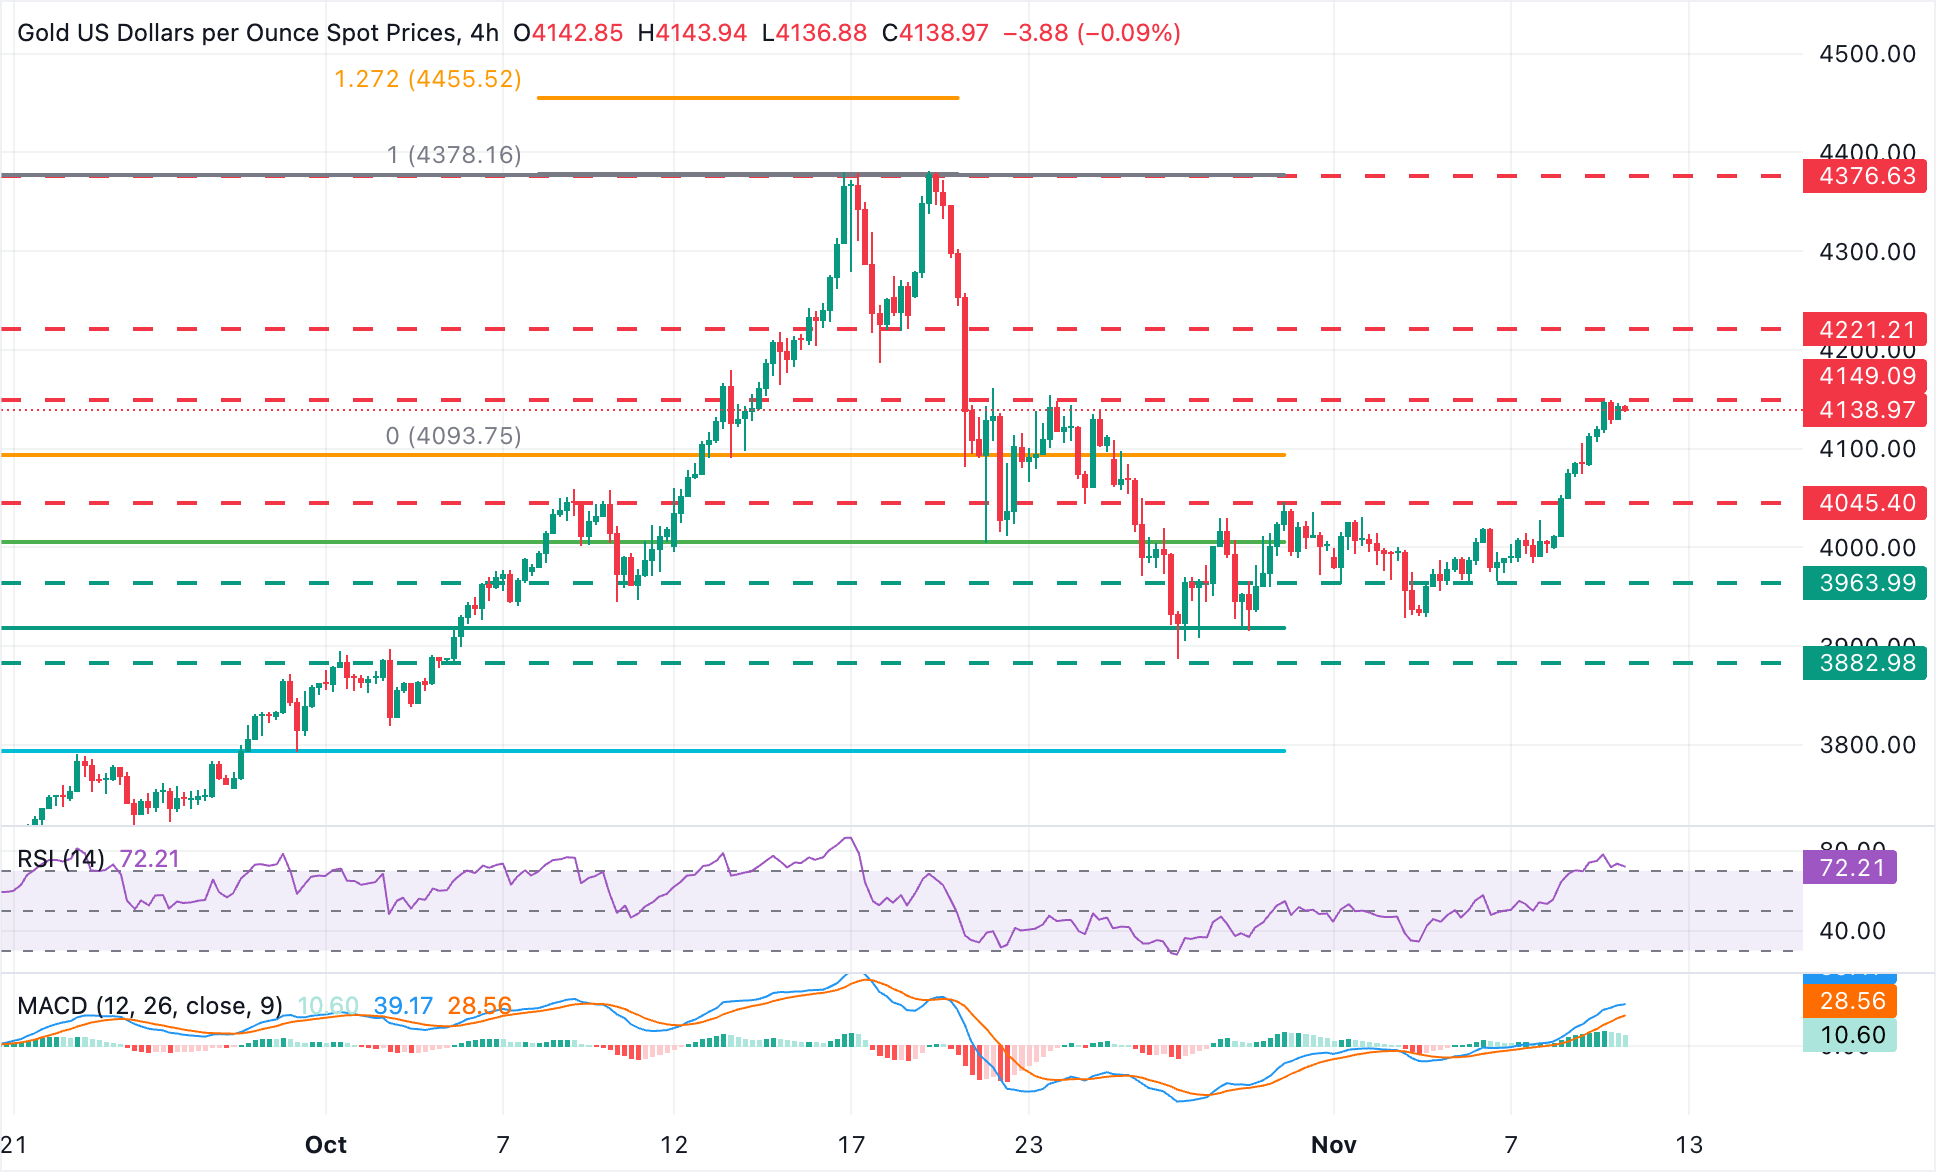
XAU/USD price action broke the top of the last two weeks’ trading range, at $4,050 on Monday, printing an impulsive positive candle on the daily chart, and highlighting the increasing bullish momentum. Technical indicators endorse that view. The 4-hour Relative Strength Index (RSI) is pulling back from oversold levels while Moving Average Convergence Divergence (MACD) keeps moving above the signal line.
A confirmation above the mentioned $4,150 area (October 22, 23, and 24 highs) would pave the path towards the previous support level at $4,220 (October 20 low), which might challenge bulls ahead of the all-time highs, around $4,380 (October 20, 21 highs).
To the downside, supports are at the top of the broken channel, in the mentioned $4,050 area (October 31 highs), ahead of the area right below the $4,000 (November 6, 7 lows), and the key support at the October 28 low near $3,880.
Gold FAQs
Gold has played a key role in human’s history as it has been widely used as a store of value and medium of exchange. Currently, apart from its shine and usage for jewelry, the precious metal is widely seen as a safe-haven asset, meaning that it is considered a good investment during turbulent times. Gold is also widely seen as a hedge against inflation and against depreciating currencies as it doesn’t rely on any specific issuer or government.
Central banks are the biggest Gold holders. In their aim to support their currencies in turbulent times, central banks tend to diversify their reserves and buy Gold to improve the perceived strength of the economy and the currency. High Gold reserves can be a source of trust for a country’s solvency. Central banks added 1,136 tonnes of Gold worth around $70 billion to their reserves in 2022, according to data from the World Gold Council. This is the highest yearly purchase since records began. Central banks from emerging economies such as China, India and Turkey are quickly increasing their Gold reserves.
Gold has an inverse correlation with the US Dollar and US Treasuries, which are both major reserve and safe-haven assets. When the Dollar depreciates, Gold tends to rise, enabling investors and central banks to diversify their assets in turbulent times. Gold is also inversely correlated with risk assets. A rally in the stock market tends to weaken Gold price, while sell-offs in riskier markets tend to favor the precious metal.
The price can move due to a wide range of factors. Geopolitical instability or fears of a deep recession can quickly make Gold price escalate due to its safe-haven status. As a yield-less asset, Gold tends to rise with lower interest rates, while higher cost of money usually weighs down on the yellow metal. Still, most moves depend on how the US Dollar (USD) behaves as the asset is priced in dollars (XAU/USD). A strong Dollar tends to keep the price of Gold controlled, whereas a weaker Dollar is likely to push Gold prices up.
추천 기사


