
AUD/JPY Price Forecast: Seems vulnerable while below 93.00 and 23.6% Fibo. level
- AUD/JPY attracts fresh sellers in reaction to the RBA’s dovish rate cut on Tuesday.
- Bets for more BoJ rate hikes in 2025 underpin the JPY and contribute to the slide.
- The technical setup favors bears and supports prospects for a further depreciation.
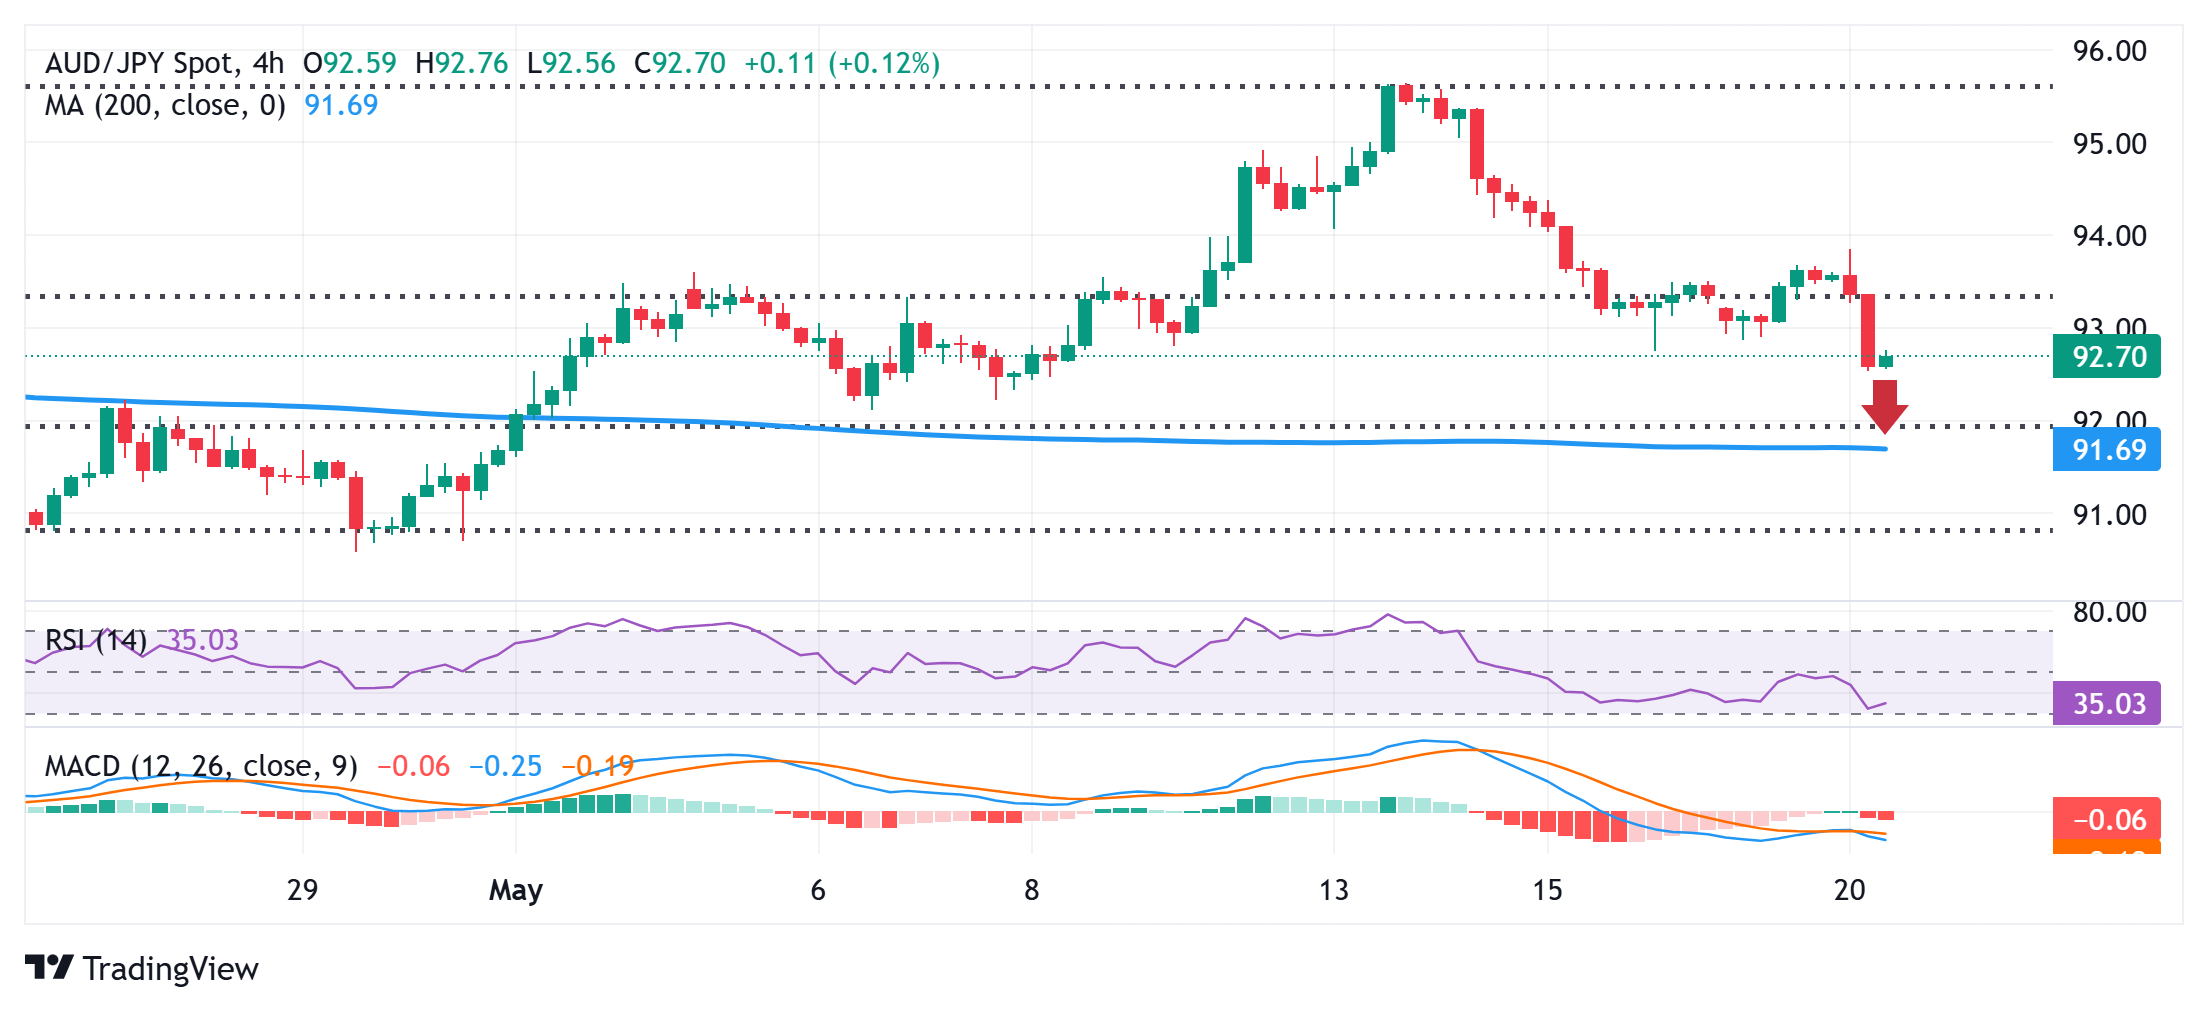
The AUD/JPY cross comes under renewed selling pressure following the previous day's modest uptick and drops to a nearly two-week low during the first half of the European session on Tuesday. Spot prices currently trade around the 92.70 region, down over 0.85% for the day, and seem vulnerable to slide further.
An intraday breakdown and acceptance below the 23.6% Fibonacci retracement level of the April-May move higher validates the negative outlook. Moreover, oscillators on the daily chart have just started gaining negative traction and are holding deep in the bearish territory on the 4-hour chart. This, in turn, suggests that the path of least resistance for the AUD/JPY cross is to the downside amid the Reserve Bank of Australia's (RBA) dovish outlook, which marks a big divergence in comparison to bets for more rate hikes by the Bank of Japan (BoJ).
Hence, some follow-through weakness towards the 91.95-91.75 confluence, comprising the 200-period Simple Moving Average (SMA) on the 4-hour chart and the 38.2% Fibo. level, looks like a distinct possibility. A convincing break below the said support should pave the way for deeper losses towards the 91.40 intermediate support before the AUD/JPY cross eventually drops to the 91.00 round figure en route to the 90.84 region, or the 50% Fibo. level.
On the flip side, any attempted recovery might now be seen as a selling opportunity near the 93.00 mark. This should cap the AUD/JPY cross near the 93.50-93.60 region, or the 23.6% Fibo. level. A sustained strength beyond the latter, however, might trigger a short-covering move and lift spot prices beyond the 94.00 round figure, towards the 94.65-94.75 region en route to the 95.00 psychological mark.
AUD/JPY 4-hour chart
RBA FAQs
The Reserve Bank of Australia (RBA) sets interest rates and manages monetary policy for Australia. Decisions are made by a board of governors at 11 meetings a year and ad hoc emergency meetings as required. The RBA’s primary mandate is to maintain price stability, which means an inflation rate of 2-3%, but also “..to contribute to the stability of the currency, full employment, and the economic prosperity and welfare of the Australian people.” Its main tool for achieving this is by raising or lowering interest rates. Relatively high interest rates will strengthen the Australian Dollar (AUD) and vice versa. Other RBA tools include quantitative easing and tightening.
While inflation had always traditionally been thought of as a negative factor for currencies since it lowers the value of money in general, the opposite has actually been the case in modern times with the relaxation of cross-border capital controls. Moderately higher inflation now tends to lead central banks to put up their interest rates, which in turn has the effect of attracting more capital inflows from global investors seeking a lucrative place to keep their money. This increases demand for the local currency, which in the case of Australia is the Aussie Dollar.
Macroeconomic data gauges the health of an economy and can have an impact on the value of its currency. Investors prefer to invest their capital in economies that are safe and growing rather than precarious and shrinking. Greater capital inflows increase the aggregate demand and value of the domestic currency. Classic indicators, such as GDP, Manufacturing and Services PMIs, employment, and consumer sentiment surveys can influence AUD. A strong economy may encourage the Reserve Bank of Australia to put up interest rates, also supporting AUD.
Quantitative Easing (QE) is a tool used in extreme situations when lowering interest rates is not enough to restore the flow of credit in the economy. QE is the process by which the Reserve Bank of Australia (RBA) prints Australian Dollars (AUD) for the purpose of buying assets – usually government or corporate bonds – from financial institutions, thereby providing them with much-needed liquidity. QE usually results in a weaker AUD.
Quantitative tightening (QT) is the reverse of QE. It is undertaken after QE when an economic recovery is underway and inflation starts rising. Whilst in QE the Reserve Bank of Australia (RBA) purchases government and corporate bonds from financial institutions to provide them with liquidity, in QT the RBA stops buying more assets, and stops reinvesting the principal maturing on the bonds it already holds. It would be positive (or bullish) for the Australian Dollar.
추천 기사


