


EUR/USD briefly back at 1.09 after Trump’s tariffs face headwind
- EUR/USD briefly heads back to 1.0900 on a flurry of headlines on Friday.
- The World Trade Organization could examine if US President Trump’s tariff policy is illegal.
- Markets have a sign of relief on the odds of a spending bill being passed, avoiding the US government shutdown, later this Friday.
The EUR/USD pair edges higher and recovers to 1.0900 at the time of writing on Friday, erasing its sluggish performance from earlier this week. The resurgence in the pair comes after two headlines emerged late Thursday. United States (US) Senate Democratic Leader Chuck Schumer announced that he plans to vote to keep the government open, backing the House-passed government funding measures and effectively ending the shutdown risk in the US.
Meanwhile, Canada initiated a dispute complaint at the World Trade Organization (WTO) and requested a look into US President Donald Trump’s tariff implementations, which might be illegal and contradict the WTO trade rules, Reuters reports. That would mean a huge setback for President Trump’s plans ahead of the reciprocal tariffs that will take effect in April.
Daily digest market movers: Last call
- Gold, as a safe haven asset, has breached the $3,000 mark on Friday in a recession-feared-induced rally as traders are concerned about economic growth and the tariffs outlook, with reciprocal levies coming into effect in April.
- At 14:00 GMT, the University of Michigan will release its preliminary consumer expectations reading for March:
- The US Consumer Sentiment Index is expected to decline to 63.1 from 64.7 in February.
- The US 5-year Consumer Inflation Expectation has no forecast and was 3.5% in the final February reading.
- Equities are attempting to brush off this week’s negative tone. All indices are up over 0.50% across Europe and the US on Friday.
- The CME Fedwatch Tool projects a 97.0% chance for the Federal Reserve (Fed) to keep interest rates unchanged in Wednesday’s upcoming decision. The chances of a rate cut at the May meeting stand at 32.8%, while they show a 78.5% probability of rates being lower than current levels in June.
- The US 10-year yield trades around 4.329%, off its near five-month low of 4.10% printed on March 4 and after hitting a five-day high on Thursday.
Technical Analysis: A vital close
Friday’s close is vital for the EUR/USD pair. From the looks on the technical charts, the pair has good odds of closing above a crucial ascending trend line (green in the chart below), which offered support on Thursday and Friday. A close above that line would mean that the 1.1000 psychological level could get in the cards heading into next week.
On the upside, 1.1000 is the key level to look out for. Once that level is breached, the pair enters the famous 1.1000-1.1500 range, where often it tends to stay for quite some time. Certainly, the 1.1200 big figure, which coincides with the highs of September and October last year, looks interesting for a brief test and possible breach higher.
On the downside, the ascending trend line at 1.0840 should still provide support for now. In case it breaks, the road is open to head into the 1.0700 region. The 200-day Simple Moving Average (SMA) around 1.0722 should be key for traders who want to buy the dip.
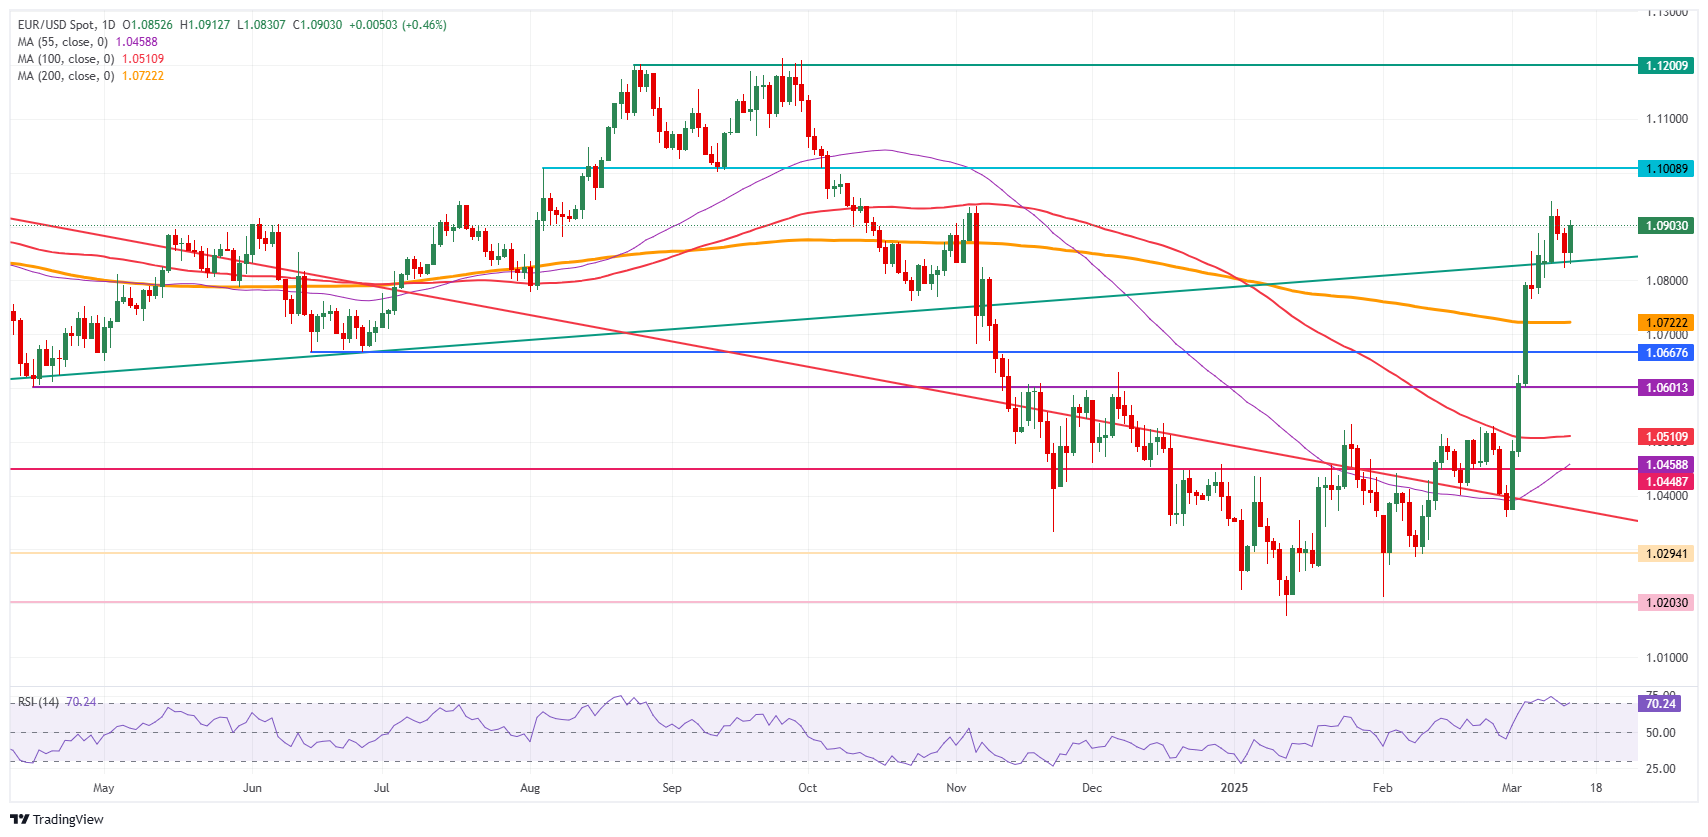
EUR/USD: Daily Chart
US-China Trade War FAQs
Generally speaking, a trade war is an economic conflict between two or more countries due to extreme protectionism on one end. It implies the creation of trade barriers, such as tariffs, which result in counter-barriers, escalating import costs, and hence the cost of living.
An economic conflict between the United States (US) and China began early in 2018, when President Donald Trump set trade barriers on China, claiming unfair commercial practices and intellectual property theft from the Asian giant. China took retaliatory action, imposing tariffs on multiple US goods, such as automobiles and soybeans. Tensions escalated until the two countries signed the US-China Phase One trade deal in January 2020. The agreement required structural reforms and other changes to China’s economic and trade regime and pretended to restore stability and trust between the two nations. However, the Coronavirus pandemic took the focus out of the conflict. Yet, it is worth mentioning that President Joe Biden, who took office after Trump, kept tariffs in place and even added some additional levies.
The return of Donald Trump to the White House as the 47th US President has sparked a fresh wave of tensions between the two countries. During the 2024 election campaign, Trump pledged to impose 60% tariffs on China once he returned to office, which he did on January 20, 2025. With Trump back, the US-China trade war is meant to resume where it was left, with tit-for-tat policies affecting the global economic landscape amid disruptions in global supply chains, resulting in a reduction in spending, particularly investment, and directly feeding into the Consumer Price Index inflation.
추천 기사


