

Euro holds gains amid US-Iran peace hopes, better-than-expected Eurozone data
- EUR/USD extends gains on Thursday, reaching session highs above 1.1770.
- Hopes of a swift end to the US-Iran war are keeping a moderate risk appetite alive, supporting the Euro.
- German Factory Orders and Eurozone Retail Sales figures for March beat expectations.
The Euro (EUR) appreciates against the US Dollar (USD) for the second consecutive day on Thursday, trading at 1.1765 at the time of writing, fuelled by hopes of a peace deal that would end Iran’s war and upbeat Eurozone macroeconomic releases.
Data released by Eurostat on Thursday showed that Eurozone Retail Sales edged down by 0.1% in March, above the market consensus of a 0.3% drop, amid the impact of the energy shock stemming from the blockade of the Strait of Hormuz. These figures follow a downwardly revised 0.3% decline in February. Year-on-year, sales grew by 1.2%, also beating the 1% advance expected and following a 1.3% growth in February.
A few hours earlier, Destatis released German Factory orders figures, which also beat expectations, with a 5% growth in March, well above the 1% forecast by market analysts and accelerating from the 1.4% increase posted in February.
The Euro is also drawing some support from lower Oil prices amid news of progress in the peace negotiations between the US and Iran. Latest reports affirm that Tehran is reviewing a peace plan submitted by the US, and Al Hadath, a sister channel of Al Arabiya, posted on X that talks to gradually reopen the Strait of Hormuz are advanced, which has contributed to lifting investors’ mood.
Technical Analysis: Key resistance remains at 1.1790
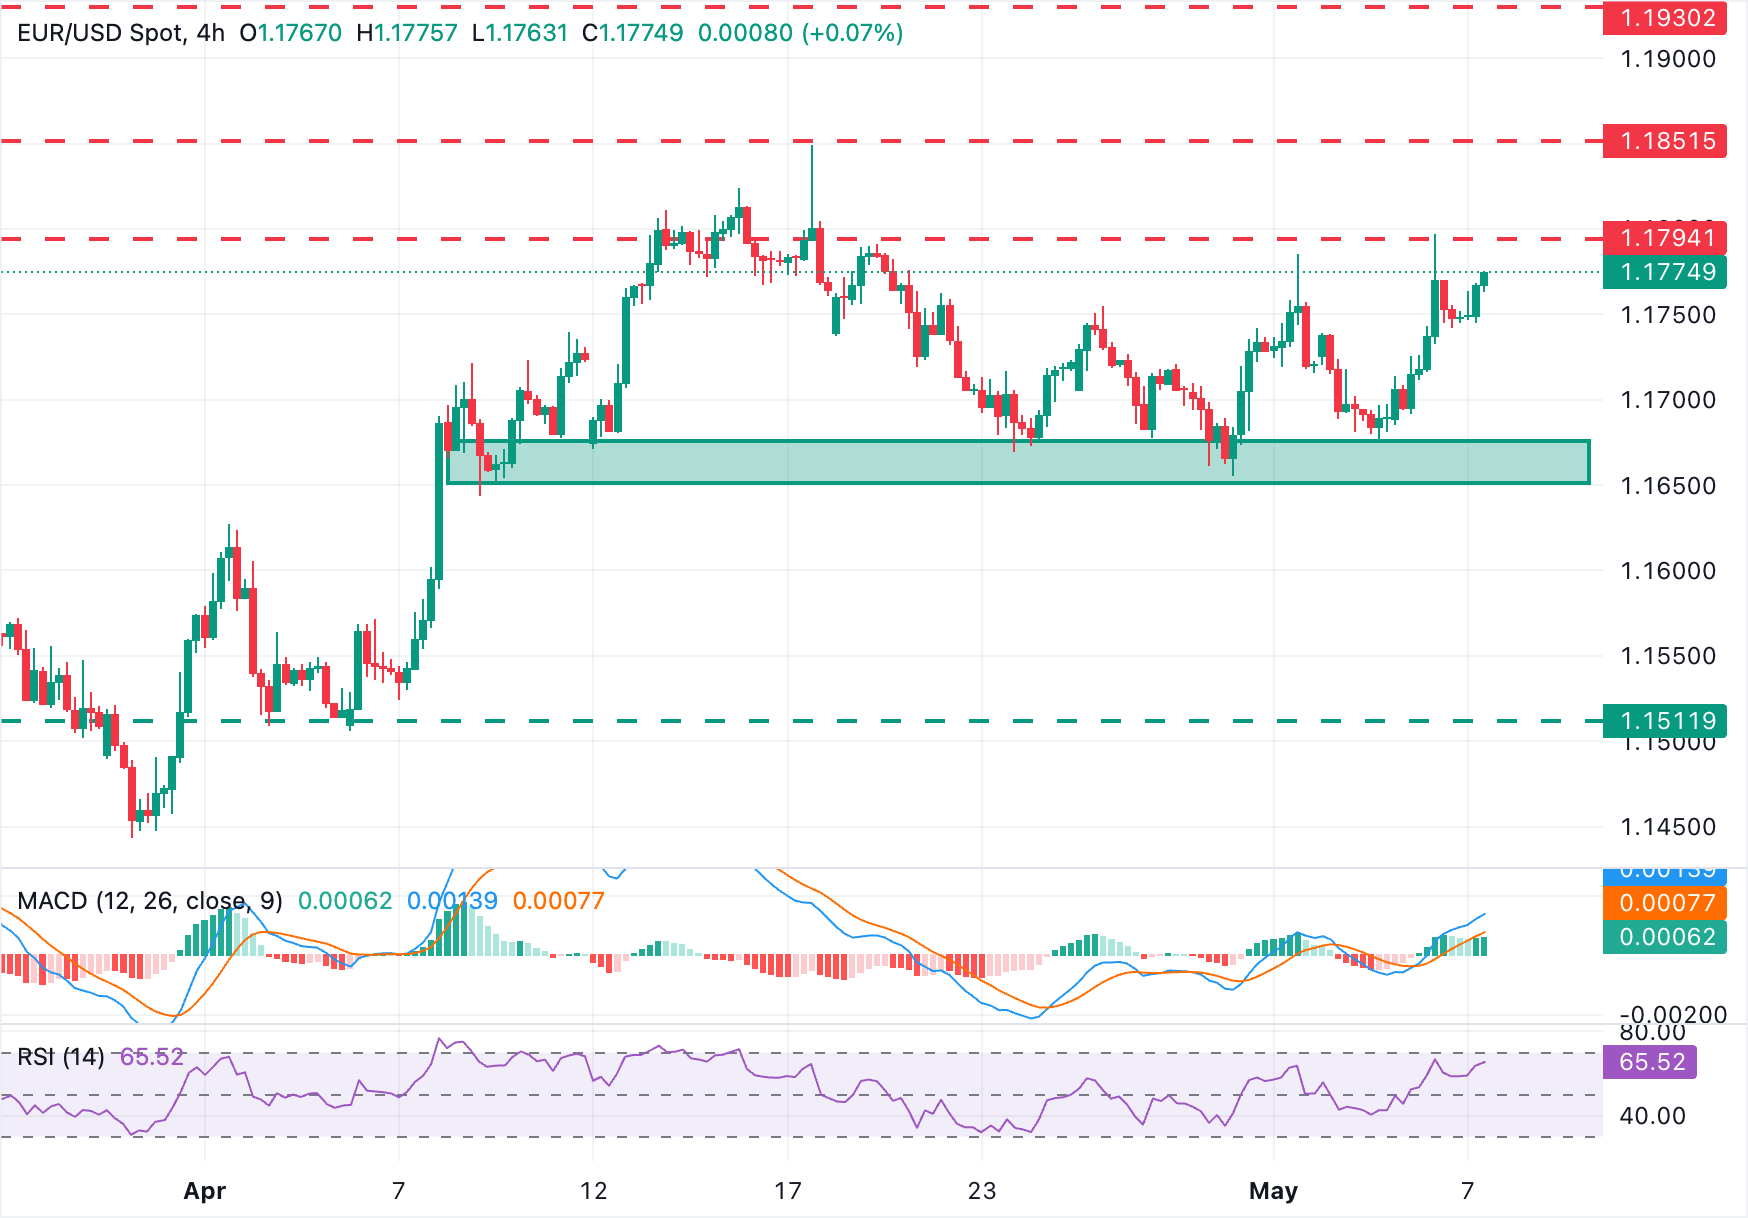
EUR/USD maintains a constructive near-term bias, yet with price action contained below the top of the last three weeks' trading channel, in the area between 1.1790 and the 1.1800 psychological level.
Momentum dynamics support the bullish tone, with the 4-hour Relative Strength Index (RSI) hovering near 65, signaling firm buying interest, while the Moving Average Convergence Divergence (MACD) histogram prints widening green bars.
Bulls, however, will likely be challenged at the mentioned resistance below 1.1800, which closes the path towards April's peak near 1.1850. On the downside, session lows are at 1.1745, but the key area for bears lies between there and 1.1775, which contained downside attempts several times in April.
(The technical analysis of this story was written with the help of an AI tool.)
Economic Indicator
Retail Sales (MoM)
The Retail Sales data, released by Eurostat on a monthly basis, measures the volume of retail sales in the Eurozone. It shows the performance of the retail sector in the short term, which accounts for around 5% of the total value added of the Eurozone economies. Retail Sales data is widely followed as an indicator of consumer spending. Percent changes reflect the rate of changes in such sales, with the MoM reading comparing sales volumes in the reference month with the prior month. Generally, a high reading is seen as bullish for the Euro (EUR), while a low reading is seen as bearish
Read more.Last release: Thu May 07, 2026 09:00
Frequency: Monthly
Actual: -0.1%
Consensus: -0.3%
Previous: -0.2%
Source: Eurostat
Economic Indicator
Factory Orders s.a. (MoM)
The Factory orders released by the Deutsche Bundesbank is an indicator that includes shipments, inventories, and new and unfilled orders. An increase in the factory order total may indicate an expansion in the German economy and could be an inflationary factor. It is worth noting that the German Factory barely influences, either positively or negatively, the total Eurozone GDP. A high reading is positive (or bullish) for the EUR, while a low reading is negative.
Read more.Last release: Thu May 07, 2026 06:00
Frequency: Monthly
Actual: 5%
Consensus: 1%
Previous: 0.9%
Source: Federal Statistics Office of Germany
추천 기사


